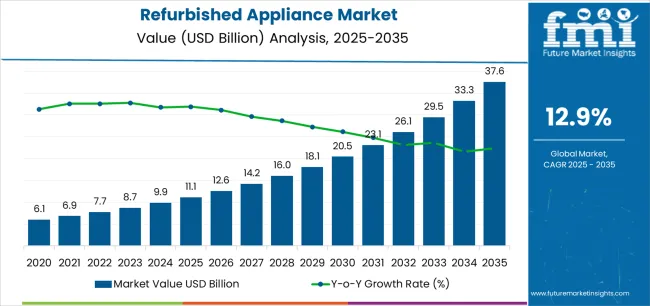
The Refurbished Appliance Market is estimated to be valued at USD 11.1 billion in 2025 and is projected to reach USD 37.6 billion by 2035, registering a compound annual growth rate (CAGR) of 12.9% over the forecast period.
The Refurbished Appliance market is witnessing steady growth, driven by increasing consumer preference for cost-effective, sustainable alternatives to new appliances. Rising environmental awareness and the emphasis on circular economy principles are accelerating adoption of refurbished products across residential and commercial sectors. Technological advancements in appliance diagnostics, testing, and restoration are enhancing the quality, reliability, and longevity of refurbished products, increasing consumer confidence.
Growing online retail penetration and digital platforms that facilitate direct access to certified refurbished appliances are further boosting market expansion. Price-sensitive customers, coupled with rising disposable income in emerging economies, are contributing to demand growth. Strong regulatory frameworks encouraging electronic waste recycling and responsible disposal practices are also creating favorable conditions for the market.
The combination of affordability, sustainability, and accessibility is positioning refurbished appliances as a viable alternative to new products As businesses and consumers increasingly adopt refurbished solutions, the market is expected to experience long-term expansion, driven by technological improvements, increasing awareness, and enhanced availability through diverse sales channels.
| Metric | Value |
|---|---|
| Refurbished Appliance Market Estimated Value in (2025 E) | USD 11.1 billion |
| Refurbished Appliance Market Forecast Value in (2035 F) | USD 37.6 billion |
| Forecast CAGR (2025 to 2035) | 12.9% |
The market is segmented by Product Type, End User, and Sales Channel and region. By Product Type, the market is divided into Home Appliance and Consumer Electronics. In terms of End User, the market is classified into Commercial and Residential. Based on Sales Channel, the market is segmented into Online Market Places, Thrift Stores/Resale Stores, Consignment Shops, and Other Channels. Regionally, the market is classified into North America, Latin America, Western Europe, Eastern Europe, Balkan & Baltic Countries, Russia & Belarus, Central Asia, East Asia, South Asia & Pacific, and the Middle East & Africa.
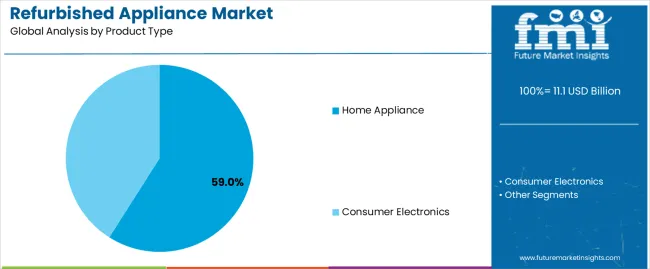
The home appliance segment is projected to hold 59.0% of the market revenue in 2025, making it the leading product type. Growth in this segment is driven by the increasing demand for essential household appliances such as washing machines, refrigerators, microwaves, and ovens at affordable prices. Refurbished appliances in this category offer reliable performance and quality comparable to new products while reducing overall purchase costs.
Technological advancements in appliance refurbishment, including quality testing, part replacement, and certification processes, are enhancing customer confidence. Environmental concerns and the push for sustainable consumption are further encouraging the adoption of refurbished home appliances.
The scalability of refurbishing processes allows for widespread availability across urban and semi-urban markets The combination of cost-effectiveness, quality assurance, and sustainability has reinforced the dominance of home appliances, making them the preferred product type among both individual consumers and commercial buyers.
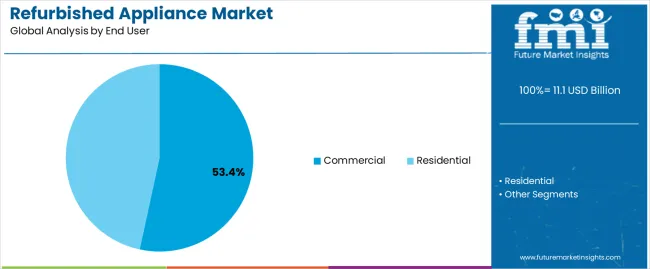
The commercial end-user segment is expected to account for 53.4% of the market revenue in 2025, establishing it as the leading end-use industry. Growth in this segment is being driven by the demand from hotels, restaurants, hospitals, and office complexes that seek cost-effective, reliable appliances for operational use. Refurbished appliances provide an optimal balance between quality and affordability, allowing businesses to manage operational costs effectively while maintaining performance standards.
The ability to access certified refurbished products with warranties ensures reduced risk for commercial buyers. Sustainability initiatives within corporate environments and procurement policies emphasizing green solutions further accelerate adoption.
As refurbishment technologies improve, enabling consistent quality and longer product lifecycles, commercial buyers are increasingly relying on refurbished appliances for scalability and efficiency The combination of financial savings, operational reliability, and alignment with corporate sustainability goals ensures that the commercial segment remains the dominant end-user category in the refurbished appliance market.
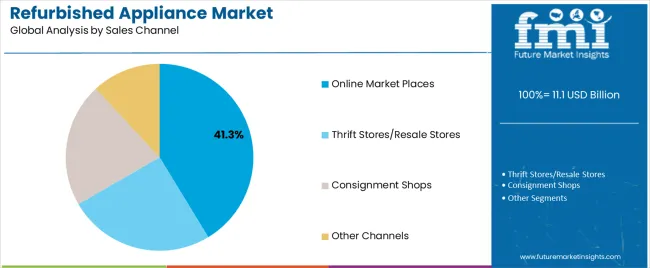
The online marketplaces segment is projected to hold 41.3% of the market revenue in 2025, making it the leading sales channel. Growth in this segment is being driven by the increasing consumer preference for convenient, digital purchasing options that allow comparison, reviews, and easy access to certified refurbished products. Online platforms offer broader reach, enabling refurbished appliances to be sold to urban and semi-urban consumers, while providing logistics and warranty support.
Digital marketing and e-commerce penetration have enhanced visibility and trust for refurbished products, encouraging wider adoption. The scalability of online marketplaces allows sellers to manage inventory efficiently and reach niche customer segments.
Integration of secure payment gateways, return policies, and product certification further reinforces customer confidence As the e-commerce ecosystem continues to expand and consumers prioritize convenience, affordability, and sustainability, online marketplaces are expected to remain the primary sales channel driving the growth of the refurbished appliance market.
From 2020 to 2025, the refurbished appliance market experienced a CAGR of 13.10%. The market for refurbished appliance has expanded due to government programs supporting waste reduction and sustainable consumption.
Consumer perceptions of refurbished appliance have gradually changed in the market due to increased quality assurance efforts by retailers and manufacturers, cost savings, and environmental concerns.
In the upcoming years, the market for refurbished appliance will probably rise steadily due to a mix of environmental, technological, and economic concerns.
Refurbished appliance will become a more and more popular option for homes worldwide as long as efforts are made to enhance consumer perception and product quality. Projections indicate that the global refurbished appliance market is expected to experience a CAGR of 13.60% from 2025 to 2035.
| Historical CAGR (2020 to 2025) | 13.10% |
|---|---|
| Forecasted CAGR (2025 to 2035) | 13.60% |
The tables showcase essential economies such as the United States, Germany, China, India, and Japan, highlighting the refurbished appliance market dynamics. Based on a comprehensive analysis, India presents a substantial opportunity due to the strong presence of refurbished appliance providers.
| Countries | Forecast CAGRs from 2025 to 2035 |
|---|---|
| The United States | 8.40% |
| Germany | 9.10% |
| China | 15.90% |
| India | 16.70% |
| Japan | 16.20% |
The refurbished appliance market in the United States is expected to expand with a CAGR of 8.40% from 2025 to 2035. In the United States, an increasing focus on environmental sustainability drives people to look for environmentally friendly products. Because they reduce waste and prolong product lifespans, refurbished appliance support sustainability initiatives and appeal to eco-aware consumers.
In the United States, the market for refurbished appliance has been expanding rapidly in recent years. This development has been attributed to various factors, including growing consumer awareness of sustainability, cost-effectiveness, and technological breakthroughs in restoration techniques.
The refurbished appliance market in Germany is expected to expand with a CAGR of 9.10% from 2025 to 2035. Refurbished appliance available in Germany include various products such as refrigerators, washing machines, dryers, dishwashers, stoves, ovens, vacuum cleaners, and small kitchen appliances.
These appliance may be sourced from various channels, including customer returns, trade-ins, demonstration models, and excess inventory.
In Germany, several factors influence consumer demand for refurbished appliance. Many consumers are primarily motivated by cost savings when buying new equipment, especially considering Germany's reputation for producing high-quality but somewhat pricey appliance.
Refurbished appliance provide a more environmentally responsible option by prolonging the lifespan of existing equipment, appealing to consumers who are becoming more conscious of environmental sustainability.
The refurbished appliance market in China is set to register a CAGR of 15.90%. With a sizable population, China offers a diverse variety of income levels. Due to their cheaper costs compared to new products, refurbished appliance appeal to many customers, particularly those with limited budgets.
China's growing middle class is looking for more reasonably priced appliance that function well. This market finds refurbished appliance appealing because they balance quality and affordability.
Expanding online shopping sites in China has facilitated customer access to refurbished appliance. Online marketplaces give customers all around the nation convenience and choice by offering a large selection of refurbished products.
The Chinese government has supported the circular economy and product reuse and recycling. Initiatives and policies on sustainability and waste reduction could obliquely boost the market for refurbished appliance.
The refurbished appliance market in India has grown significantly in recent years due to shifting consumer preferences and environmental consciousness. The refurbished appliance market offers an economical and environment-friendly substitute. The refurbished appliance market in India is set to register a CAGR of 16.70%.
The main factor driving the refurbished appliance market in India is the growing middle-class population. As disposable income rises and urbanization accelerates, consumers seek to upgrade their lifestyles by investing in modern conveniences such as refrigerators, washing machines, and air conditioners. Increasing Indian government initiatives to promote sustainability and reduce waste generation drives market growth.
The refurbished appliance market in Japan is set to register a CAGR of 16.20%. The elderly population in Japan is one of the factors driving the refurbished appliance market.
The growing need for smaller and more energy-efficient appliance to meet the changing needs of an aging population is increasing as more people retire and reduce the size of their houses. Refurbished appliance offer an affordable option that enables them to modernize their living areas without going over budget for brand-new equipment.
Japan’s commitment to environmental sustainability is driving the adoption of refurbished appliance. Technological advancement and improvement in the refurbished processes have also contributed to refurbished appliance in Japan.
The section below shows the leading segment. The home appliance segment is expected to account for a market share of 59% in 2025. Based on end-users, the commercial segment is expected to have a share of 53.4%.
| Category | Market Share |
|---|---|
| Home Appliance | 59% |
| Commercial | 53.4% |
The home appliance segment emerged as the dominant force in the refurbished appliance market, commanding 59% of the market share in 2025.
Essential household items include refrigerators, washing machines, dishwashers, and ovens. These appliance are always in demand due to things like urbanization, population increase, and changing lifestyles. As a result, there is a sizable and steady customer base for household appliance in the reconditioned market.
Buying new home appliance may be costly, particularly for high-end ones with cutting-edge features. Compared to new appliance, refurbished appliance can save a lot of money, making them a desirable choice for those on a tight budget or seeking good value.
Environmental sustainability is gaining popularity, and a lot of customers are looking for ways to cut back on waste and lessen their environmental impact. Reusing and refurbishing household appliance rather than throwing them away helps reduce waste and conserves resources, which aligns with the beliefs of customers who care about the environment.
Based on end-users, the commercial segment is expected to account for a market share of 53.4% in 2025. Commercial enterprises frequently have limited resources, particularly startups and small companies. Compared to buying brand-new equipment, refurbished appliance provide a more affordable option enabling firms to spend their resources more effectively.
Businesses require prompt replacements of commercial appliance when they unexpectedly break down to minimize downtime and continue operating. Refurbished appliance offer a quicker and more cost-effective solution than purchasing new equipment, allowing businesses to get back to their regular operations quickly.
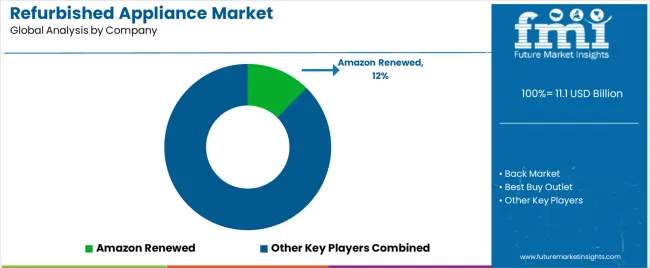
Players in the sector can expand their audience and boost sales by building a strong online presence on e-commerce sites and corporate websites. Customers can conveniently search and buy refurbished appliance from online channels while lounging in the comfort of their own homes.
| Attributes | Details |
|---|---|
| Estimated Market Size in 2025 | USD 11.1 billion |
| Projected Market Valuation in 2035 | USD 37.6 billion |
| Value-based CAGR 2025 to 2035 | 12.9% |
| Forecast Period | 2025 to 2035 |
| Historical Data Available for | 2020 to 2025 |
| Market Analysis | Value in USD million |
| Key Regions Covered | North America; Latin America; Western Europe; Eastern Europe; South Asia and Pacific; East Asia; The Middle East and Africa |
| Key Market Segments Covered | Product Type, End User, Sales Channel, Region |
| Key Countries Profiled | The United States, Canada, Brazil, Mexico, Germany, The United Kingdom, France, Spain, Italy, Russia, Poland, Czech Republic, Romania, India, Bangladesh, Australia, New Zealand, China, Japan, South Korea, GCC countries, South Africa, Israel |
| Key Companies Profiled | Reebelo; Back Market; Amazon Renewed; Best Buy Outlet; Walmart Renewed; eBay Refurbished; Newegg Renewed; RefurbKing; FactoryPure; Sears Outlet; Wayfair Outlet; B&H Refurbished Appliance; AJ Madison Outlet; Costco; Renewgoo |
The global refurbished appliance market is estimated to be valued at USD 11.1 billion in 2025.
The market size for the refurbished appliance market is projected to reach USD 37.6 billion by 2035.
The refurbished appliance market is expected to grow at a 12.9% CAGR between 2025 and 2035.
The key product types in refurbished appliance market are home appliance, _washing machines, _dishwashers, _ovens and ranges, _microwaves, _air conditioners, consumer electronics, _television, _audio equipment, _gaming consoles, _smartphones and tablets and _laptops and computers.
In terms of end user, commercial segment to command 53.4% share in the refurbished appliance market in 2025.


Full Research Suite comprises of:
Market outlook & trends analysis
Interviews & case studies
Strategic recommendations
Vendor profiles & capabilities analysis
5-year forecasts
8 regions and 60+ country-level data splits
Market segment data splits
12 months of continuous data updates
DELIVERED AS:
PDF EXCEL ONLINE
Refurbished Dental Equipment Market Size and Share Forecast Outlook 2025 to 2035
Refurbished Printers Market Analysis – Size, Share & Forecast 2025 to 2035
Refurbished Computers and Laptops Market Analysis - Size, Share, & Forecast Outlook 2025 to 2035
Refurbished Sneaker Market Trends - Growth & Forecast 2025 to 2035
Refurbished Running Shoes Market Growth - Trends & Forecast 2025 to 2035
Refurbished Smartphone Market Trends – Growth & Forecast 2024-2034
Refurbished Wearable Device Market Insights – Trends & Forecast 2024-2034
Portable Appliance Tester (PAT) Market Size and Share Forecast Outlook 2025 to 2035
Consumer Appliances Market Analysis by Product Type, Technology, Sales Channel, End User and Region 2025 to 2035
Household Appliances Market Trends – Growth & Forecast 2025 to 2035
Smart Home Appliances Market Growth – Trends & Forecast 2025 to 2035
Smart Kitchen Appliances Market Size and Share Forecast Outlook 2025 to 2035
Personal Care Appliances Market Size and Share Forecast Outlook 2025 to 2035
Small Kitchen Appliances Market Growth – Demand & Trends to 2033
AI-Driven Smart Home Appliances – Enhancing Home Automation
Outdoor Kitchen Appliances Market Size and Share Forecast Outlook 2025 to 2035
Built-In Kitchen Appliance Market Outlook – Size, Share & Innovations 2025 to 2035
Household Kitchen Appliances Market Size and Share Forecast Outlook 2025 to 2035
Purpose-built Backup Appliance (PBBA) Market Size and Share Forecast Outlook 2025 to 2035
Smart Built-In Kitchen Appliance Market Size and Share Forecast Outlook 2025 to 2035

Thank you!
You will receive an email from our Business Development Manager. Please be sure to check your SPAM/JUNK folder too.
Chat With
MaRIA