The Refurbished Dental Equipment Market is estimated to be valued at USD 942.1 million in 2025 and is projected to reach USD 2169.6 million by 2035, registering a compound annual growth rate (CAGR) of 8.7% over the forecast period.
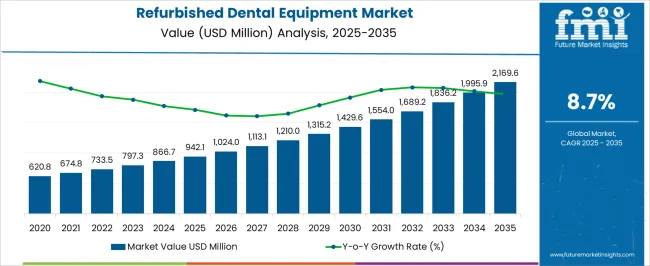
| Metric | Value |
|---|---|
| Refurbished Dental Equipment Market Estimated Value in (2025 E) | USD 942.1 million |
| Refurbished Dental Equipment Market Forecast Value in (2035 F) | USD 2169.6 million |
| Forecast CAGR (2025 to 2035) | 8.7% |
The refurbished dental equipment market is gaining traction as healthcare providers increasingly seek cost effective solutions without compromising on quality or compliance. Rising treatment demand, growing awareness of oral health, and cost pressures on both public and private healthcare systems are driving adoption of refurbished equipment.
Regulatory frameworks ensuring safety and certification of refurbished devices have built trust among buyers, while manufacturers and distributors are expanding service networks to support long term maintenance. Advances in refurbishment processes, including digital calibration and sterilization standards, are enhancing the reliability and performance of reused devices.
The outlook remains positive as hospitals and dental clinics balance the need for advanced technology with budget constraints, creating sustained opportunities in the global market.
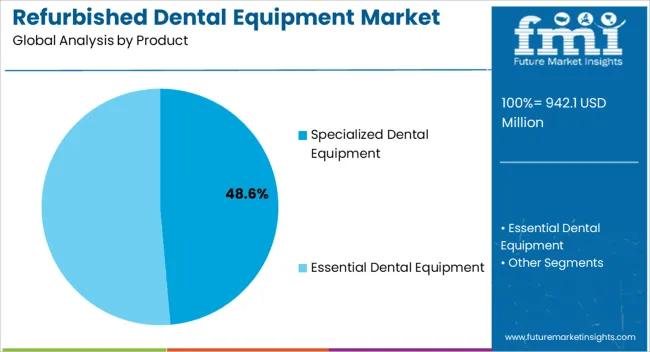
The specialized dental equipment segment is expected to represent 48.60% of total revenue by 2025 within the product category, positioning it as the leading segment. Growth in this area is being driven by increasing demand for advanced diagnostic and surgical instruments at lower capital expenditure.
Refurbished specialized devices provide hospitals and dental practices access to high performance technologies at a fraction of the cost of new equipment. Their availability has been reinforced by rising trade in certified refurbished models and growing emphasis on sustainability in medical procurement.
This combination of affordability, functionality, and compliance has strengthened the specialized dental equipment segment as the dominant contributor within the product category.
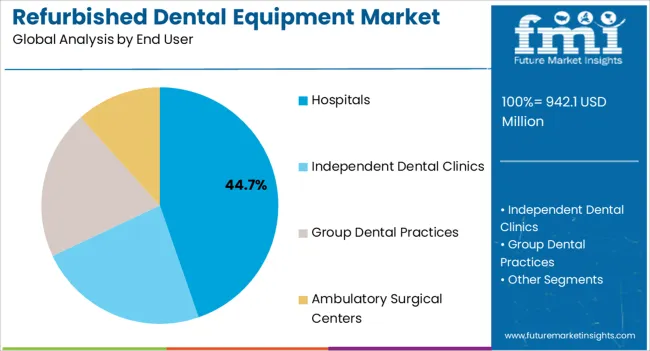
The hospitals segment is projected to account for 44.70% of total market revenue by 2025 under the end user category, making it the most significant segment. Hospitals face high patient volumes and require reliable equipment across multiple departments, driving strong demand for refurbished devices that can meet both capacity and cost efficiency needs.
Procurement budgets in hospitals are often restricted, and refurbished dental equipment offers a viable solution to expand service coverage without compromising standards. Additionally, hospitals are more likely to invest in long term service contracts and certified refurbished products, which ensures compliance with quality and safety regulations.
This alignment of affordability, scale, and operational reliability has positioned hospitals as the dominant end user segment in the refurbished dental equipment market.
Sales of the refurbished dental equipment market grew at a CAGR of 6.7% between 2020 to 2025. The refurbished dental equipment market contributes 11.4% revenue share to the global dental equipment market was valued at USD 942.1 Billion in 2025.
One of the primary drivers is the significant cost savings that these equipment offer compared to purchasing new equipment. Dental practices, particularly smaller practices or those on a limited budget can save a substantial amount of money by opting for refurbished equipment. This cost advantage allows them to allocate their resources to other areas of their practice.
Another reason for the boost in sales is the manufacturers ensure that dental equipment undergoes thorough testing and inspection to ensure its reliability and functionality. This quality assurance provides dental practices with confidence in the performance of the equipment and helps mitigate concerns about reliability and longevity.
Advancements in technology are driving refurbished dental technology is continually advancing, and new equipment with advanced features and capabilities is regularly introduced to the market. Refurbished dental equipment provides an opportunity for practices to access upgraded technology at a lower cost. It allows them to take advantage of improved functionality, efficiency, and patient care without the expense of investing in brand-new equipment.
Considering this, FMI expects the global market to grow at a CAGR of 8.7% through the forecasted years.
Refurbished dental equipment is readily available and can be quickly implemented in practices offering dental services. This is advantageous for practices that need to replace or add equipment promptly due to equipment failure, expansion, or other reasons. Quick implementation minimizes downtime and allows dental practices to resume their operations promptly.
Refurbished dental equipment offers flexibility and customization options. Dental practices can select from a wide range of equipment that suits their specific needs, preferences, and budget by choosing equipment with the desired features, specifications, and configurations to align with their workflow and patient requirements.
Moreover, the market is expected to grow in the coming years, driven by upgraded technological advancement at a lower cost and the increasing adoption of refurbished equipment in healthcare facilities.
Overall, the market represents a promising opportunity for both healthcare providers and manufacturers, offering a range of benefits over new dental equipment and addressing key challenges in the field of dentistry.
One of the primary restraints is the perception of lower quality and reliability compared to new equipment. Few customers may hesitate to purchase equipment due to concerns about its performance, longevity, and potential need for repairs.
Dental practices typically rely on a range of equipment and technologies that need to work seamlessly together. Compatibility and integration issues may arise when incorporating refurbished equipment into an existing setup. Compatibility concerns can include software compatibility, compatibility with existing instruments, or integration with other systems.
Dental equipment is subject to various regulations and standards related to safety, sanitation, and performance. Ensuring that refurbished equipment meets these standards can be a challenge, particularly if the equipment is older or has undergone significant modifications. Compliance with regulatory requirements is crucial to gaining customer trust and maintaining market viability.
Despite the growing acceptance of refurbished equipment in various industries, including healthcare, there may still be a lingering perception that refurbished products are of lower quality or less desirable. Overcoming this perception and building trust in the market can be a challenge for refurbished dental equipment manufacturers.
These factors are expected to hamper the revenue growth of the market over the forecast period.
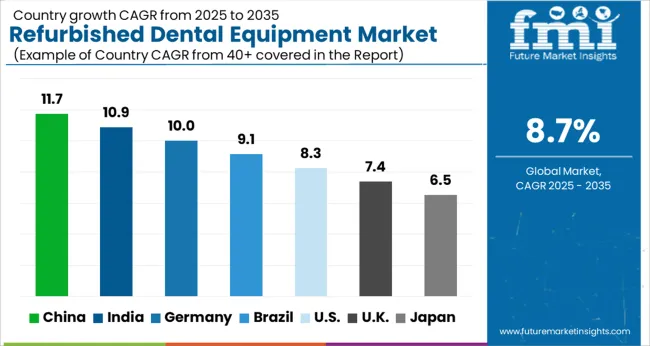
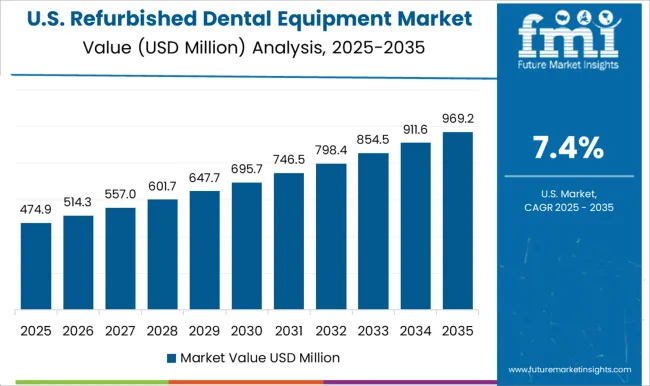
The USA dominated the North American market & accounted for 95.1% share by value in 2025.
USA market leads for usage of refurbished dental equipment. The demand for dental services has been on the rise in the United States due to factors such as increasing awareness of oral health and expanded dental insurance coverage. This growing demand has fueled the need for dental equipment, including refurbished options.
This equipment offers cost advantages over new equipment, making it an attractive option for dental practices, especially smaller or new practices with budget constraints. Refurbished equipment allows these practices to access quality equipment at a lower price point.
There is a growing emphasis on sustainability and reducing waste in various industries, including healthcare. Refurbished dental equipment aligns with these sustainability goals by extending the lifespan of equipment and reducing electronic waste.
The American Dental Association provides resources and guidance to dental professionals on various aspects of dental equipment, including recommendations for purchasing and maintaining equipment. While their focus is primarily on new equipment, their guidelines and standards can also apply to refurbished equipment.
The ADA's Council on Dental Practice may offer insights and information on cost-effective options, which could include refurbished equipment as an alternative.
Due to high demand, more advanced products, will experience a high adoption rate among dentists. The demand will be increasing due to rise in demand for dental services, which will drive the expansion of the market.
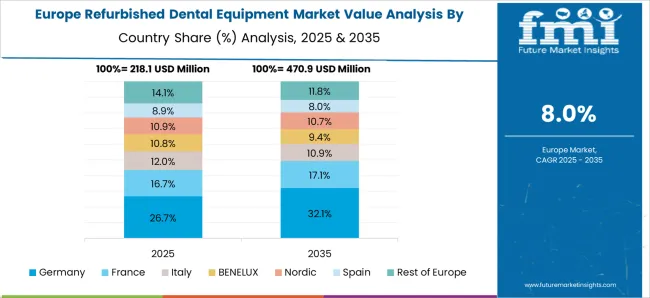
Germany dominated the European market and accounted for around 22.8% in 2025.
Germany has been one of the leading countries in Europe in terms of using dental equipment, including refurbished dental equipment. They provide guidelines and support to dental professionals to ensure that refurbished equipment meets quality and safety standards. This support and acceptance from professional bodies have further contributed to the growth of the refurbished dental equipment market.
Additionally, Economic factors, such as cost constraints and the need to optimize resources, have driven the demand for refurbished dental equipment. Additionally, market competition among equipment suppliers and manufacturers has led to wider availability of refurbished options and more competitive pricing.
China is projected to be the most attractive market in the East Asia and held a market share of 58.7% in 2025.
The refurbished dental equipment market in China is expected to grow significantly in the coming years due to several factors.
China’s improved healthcare infrastructure has led to an increased demand for dental services. As more people seek dental treatments, dental clinics and practices are expanding, and there is a need for affordable equipment options to meet the rising demand. Refurbished equipment provides a cost-effective solution for these clinics to acquire necessary dental tools and devices.
The availability of a wide range of refurbished dental equipment options has been a driver for market growth in China. Dental lasers, X-ray machines, sterilization equipment, and other essential dental equipment can be found in refurbished condition, allowing dental practices to find suitable solutions that meet their specific requirements. The availability of a broad product range has contributed to the increasing popularity of this equipment.
The specialized dental equipment segment held the major chunk of about 65.2% in global market by the end of 2025.
Intraoral cameras and 3D imaging systems play important roles in modern dental practices, offering enhanced diagnostic capabilities, improved patient communication, and efficient treatment planning.
Small, portable devices called intraoral cameras are used to take high-definition pictures of a patient's mouth. By enabling dentists to graphically demonstrate and explain oral issues and treatment alternatives, they have a direct impact on patient communication and participation.
3D imaging systems, such as cone beam computed tomography (CBCT) scanners, provide detailed three-dimensional images of the patient's oral and maxillofacial structures. They offer valuable information for treatment planning and comprehensive evaluations.
Common uses of 3D imaging systems in dental practices include implant planning, and endodontic evaluation & 3D imaging systems help evaluate the temporomandibular joints (TMJ) for disorders and abnormalities, assisting in the diagnosis and treatment planning for patients with TMJ-related issues.
The hospitals' segment accounted for a revenue share of 42.1% in the global market at the end of 2025.
Hospitals are one of the primary settings where dental equipment is used. In recent years, there has been an increase in the adoption of these equipment in hospitals around the world, driven by a variety of factors including convenience, and cost.
One advantage of Hospital-based dental clinics is that they often provide oral and maxillofacial surgical services. Intraoral cameras can be used to capture detailed images of the patient's oral cavity, teeth, and surrounding tissues, assisting in treatment planning and documentation.
Hospitals often provide dental care for medically compromised patients who require specialized dental treatment. Refurbished dental equipment can be utilized in the dental management of these patients, including procedures like oral hygiene maintenance, dental prophylaxis, and restorative care.
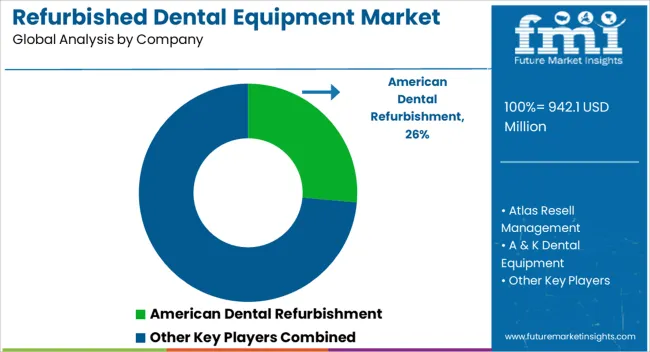
Leading companies are focusing on increasing their product portfolios in order to improve their competitive position in the marketplace and increase their reach in emerging regions.
The key techniques used by manufacturers to get a competitive edge in the market consist of pricing strategies, marketing approaches, advances in technology, compliance with regulations, and acquisition and distribution agreements with other businesses to expand their business.
For instance:
Similarly, recent developments have been tracked by the team at Future Market Insights related to companies in the refurbished dental equipment market space, which are available in the full report
| Attribute | Details |
|---|---|
| Forecast Period | 2025 to 2035 |
| Historical Data Available for | 2020 to 2025 |
| Market Analysis | USD Million for Value |
| Key Regions Covered | North America; Latin America; Europe; South Asia; East Asia; Oceania and Middle East and Africa (MEA). |
| Key Countries Covered | USA, Canada, Brazil, Mexico, Argentina, Germany, UK, France, Italy, Spain, Russia, BENELUX, Rest of EU, China, Japan, South Korea, India, Thailand, Indonesia, Malaysia, Australia, New Zealand, Türkiye, GCC Countries, South Africa & North Africa. |
| Key Segments Covered | Product, End User and Region |
| Key Companies Profiled | American Dental Refurbishment; Atlas Resell Management; A & K Dental Equipment; Capital Dental Equipment; Collin’s Dental Equipment, Inc.; Independent Dental Inc.; Pre-Owned Dental Inc.; SPS Dental; Renew Digital LLC; DCI Dental Equipment |
| Report Coverage | Market Forecast, Competition Intelligence, DROT Analysis, Market Dynamics and Challenges, Strategic Growth Initiatives |
| Customization & Pricing | Available upon Request |
The global refurbished dental equipment market is estimated to be valued at USD 942.1 million in 2025.
The market size for the refurbished dental equipment market is projected to reach USD 2,169.6 million by 2035.
The refurbished dental equipment market is expected to grow at a 8.7% CAGR between 2025 and 2035.
The key product types in refurbished dental equipment market are specialized dental equipment, _intraoral cameras, _chairside cad/cam systems, _3d imaging systems, _surgical microscopes, _dental lasers, _endodontic equipment, _cone beam computed tomography (cbct) systems, _others, essential dental equipment, _dental patient chairs, _delivery systems, _dental operatory lights, _x-ray imaging equipment, _sterilization equipment, _handpieces, _utility equipment and _others.
In terms of end user, hospitals segment to command 44.7% share in the refurbished dental equipment market in 2025.


Full Research Suite comprises of:
Market outlook & trends analysis
Interviews & case studies
Strategic recommendations
Vendor profiles & capabilities analysis
5-year forecasts
8 regions and 60+ country-level data splits
Market segment data splits
12 months of continuous data updates
DELIVERED AS:
PDF EXCEL ONLINE
Refurbished Appliance Market Forecast and Outlook 2025 to 2035
Refurbished Printers Market Analysis – Size, Share & Forecast 2025 to 2035
Refurbished Computers and Laptops Market Analysis - Size, Share, & Forecast Outlook 2025 to 2035
Refurbished Sneaker Market Trends - Growth & Forecast 2025 to 2035
Refurbished Running Shoes Market Growth - Trends & Forecast 2025 to 2035
Refurbished Smartphone Market Trends – Growth & Forecast 2024-2034
Refurbished Wearable Device Market Insights – Trends & Forecast 2024-2034
Dental Implant and Prosthetic Market Size and Share Forecast Outlook 2025 to 2035
Dental Wounds Treatment Market Size and Share Forecast Outlook 2025 to 2035
Dental Radiometer Market Size and Share Forecast Outlook 2025 to 2035
Dental Anaesthetic Market Size and Share Forecast Outlook 2025 to 2035
Dental Diamond Bur Market Size and Share Forecast Outlook 2025 to 2035
Dental Laboratory Market Size and Share Forecast Outlook 2025 to 2035
Dental Matrix Systems Market Size and Share Forecast Outlook 2025 to 2035
Dental Permanent Cements Market Size and Share Forecast Outlook 2025 to 2035
Dental Bleaching Agent Market Size and Share Forecast Outlook 2025 to 2035
Dental Care Products Market Size and Share Forecast Outlook 2025 to 2035
Dental Etching Liquid Market Size and Share Forecast Outlook 2025 to 2035
Dental Sutures Market Analysis - Size, Share, and Forecast Outlook 2025 to 2035
Dental Hygiene Devices Market Size and Share Forecast Outlook 2025 to 2035

Thank you!
You will receive an email from our Business Development Manager. Please be sure to check your SPAM/JUNK folder too.
Chat With
MaRIA