

- Market Size (2026)
- USD 12.2 Bn
- Forecast (2036)
- USD 46.4 Bn
- CAGR (2026 to 2036)
- 14.3%
How big is Regenerative Agriculture Ingredients & Supply Chain Market in 2026?
USD 12.2 billion in 2026 and USD 46.4 billion by 2036 at a 14.3% CAGR.
Sales of regenerative agriculture ingredients and supply-chain systems are projected to expand at 14.3% CAGR from 2026 to 2036. Revenue is estimated at USD 12.2 billion in 2026 and is forecast to reach USD 46.4 billion by 2036. Demand is expected to come from food companies that need crop records to stay connected through storage and processing. Regenerative agriculture practices provide a useful adjacent view of farm-level systems used before ingredient sourcing begins.
Verification is expected to become part of normal purchasing because farm claims lose value when crops move through shared elevators without clear records. Food companies need field data that remains usable after harvest and processing. The commercial value comes from making each approved ingredient easier to defend during customer review.
Country strategy is expected to differ by crop base and claim scrutiny. Brazil offers large grain and oilseed volumes. France and Germany place more pressure on documented environmental claims. The UK adds a label-trust check for customer-facing products. Demand for organic fertilizer inputs is expected to move with this proof burden when crop programs require evidence before contract expansion.
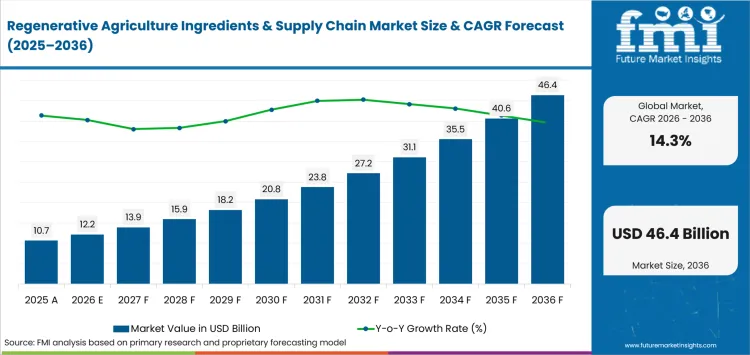
Key Takeaways of Regenerative Agriculture Ingredients & Supply Chain Market
- Demand for regenerative agriculture ingredients and supply chain solutions is shaped by the need to connect farm-practice data with processor records, reduce environmental claim risk, and maintain crop identity through storage, handling, and ingredient approval.
- By crop, Cereals hold 36.3% share in 2026, while Verified Supply Chain accounts for 47.3% share in 2026 within solution, reflecting large-scale grain traceability requirements and the need to link farm-practice records with procurement and processor documents.
- Brazil leads country growth at 14.4% CAGR through 2036, followed by the USA at 14.0% and the UK at 13.6%, shaped by grain and oilseed export flows, CPG network scale, and retailer scrutiny of environmental claims.
- Competition centers on SAI Platform, Regrow, Cargill, ADM, Nestlé, Danone, General Mills, PepsiCo, and Indigo Ag, spanning verification frameworks, MRV systems, grain origination, and regenerative procurement standards.
- Verification cost allocation, data ownership, identity-preserved handling, MRV platform connectivity, and evidence maintenance across commercial handling remain key considerations for wider supply chain adoption.
- Commercial expansion is expected to follow traceable performance from field through final ingredient approval, with contracts defining verification responsibilities and data ownership before supply volumes expand.
Analyst Perspective
"The regenerative agriculture ingredients & supply chain market is increasingly shaped by traceability from farm practices through processing and final ingredient delivery. Food companies are evaluating whether regenerative claims remain verifiable across commercial handling, storage, and processing stages. Suppliers that connect farm-level data with lot documentation, verification systems, and ingredient specifications will be better positioned to build credible long-term supply relationships."
— Nandini Roy Choudhury, Principal Analyst at Future Market Insights
Source: FMI's proprietary forecasting model and primary research
How is the Regenerative Agriculture Ingredients & Supply Chain Market segmented?
The industry is segmented by crop, solution, end user, and region.
Crop analysis distinguishes cereals, oilseeds and cocoa alongside dairy and other crop groups. Cereals lead because grain chains already use storage and lot tracking at scale. Solution analysis separates verified supply chain, certification and MRV from other service models. Verified Supply Chain leads by connecting farm-practice data with claims used by processors and food companies. End user analysis covers CPG, ingredient companies and retailers alongside foodservice and other commercial users. CPG leads because finished-product claims carry direct legal and brand risk.
What supports demand for cereals within the crop category?
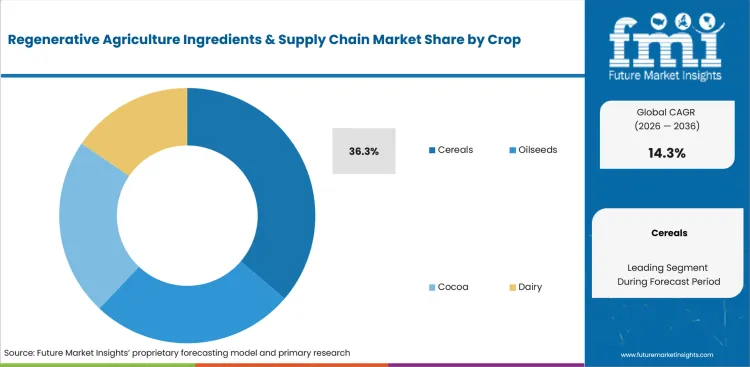
Cereals move through large storage, milling and processing networks where farm-practice identity can be lost after harvest. Wheat and corn programs therefore require field records that remain connected to each crop lot through elevators, processors and ingredient approval. Large grain volumes also make cereals suitable for repeatable verification systems because commercial buyers can spread documentation costs across substantial ingredient flows.
- Cereals are projected to hold 36.3% share in 2026, driven by their scale across food ingredients, feed, milling and starch-processing supply chains. Regenerative claims retain commercial value when farm-practice records remain linked with crop identity after storage and processing.
- Food and beverage companies favor cereals because wheat and corn already move through structured storage and lot-tracking systems at commercial scale. Verified grain programs can support flour, starch, feed and packaged-food applications without requiring an entirely separate sourcing model.
How does verified supply chain shape demand within the solution category?
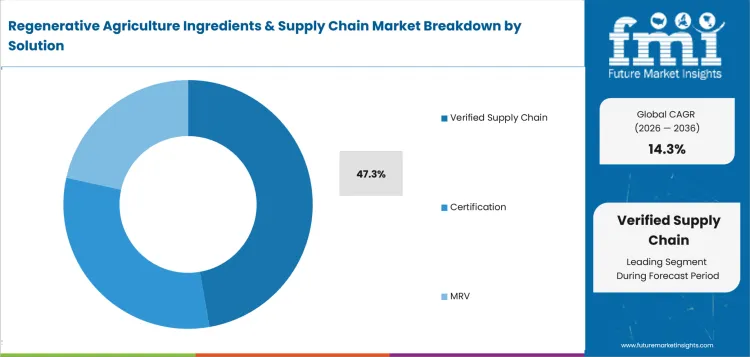
Verified Supply Chain addresses the largest trust gap between farm-practice claims and finished ingredient approval. Certification may confirm that a farm followed a defined practice, but procurement teams still need evidence that the approved crop remained identifiable through storage, transportation and processing. MRV systems collect field data, while verified supply-chain processes connect that information with processor records and ingredient specifications.
- Verified Supply Chain is expected to account for 47.3% share in 2026, attributable to the need for traceability from farm intake through final ingredient approval. The solution helps procurement teams confirm that verified crops remained connected to farm records after ordinary commercial handling.
- CPG companies and ingredient suppliers use verified supply chains to reduce repeated checks across farms, elevators and processing facilities. Digital MRV, soil testing and identity-preserved storage strengthen this model by keeping practice data usable after harvest.
How is CPG positioned within the end user category?
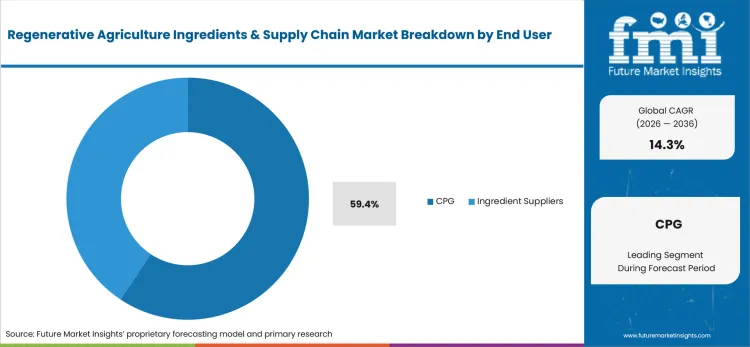
CPG companies lead demand because finished products carry direct exposure to retailer checks, consumer scrutiny and environmental-claim requirements. A regenerative ingredient claim must usually be supported by farm records, processor documents and final product specifications. Large packaged-food companies also purchase enough crop volume to justify dedicated verification programs across suppliers and regions.
- CPG is projected to capture 59.4% share in 2026, supported by direct responsibility for consumer-facing sourcing and sustainability claims. Packaged-food companies need evidence that remains traceable from farm practice through final ingredient use.
- Food and beverage companies use procurement standards to convert regenerative farm programs into repeatable ingredient demand. Large CPG buyers can require suppliers to maintain field records, crop identity and processor documentation within one sourcing system.
What are the drivers, restraints, and opportunities in the Regenerative Agriculture Ingredients & Supply Chain Market?
Traceable farm records, identity-preserved handling and MRV evidence are pushing regenerative ingredients from pilot sourcing into repeatable supply agreements.
- Driver: Food and beverage companies are using verified farm-practice records to reduce claim risk and secure repeatable ingredient supply.
- Restraint: Verification cost and inconsistent farm records can delay commercial sourcing when crop lots pass through multiple handlers.
- Opportunity: Digital MRV, soil testing and identity-preserved storage can turn regenerative sourcing into a documented procurement system.
Demand is expected to be driven by evidence that proves what happened before a crop becomes a finished ingredient. A claim about no-till or cover crops loses value when grain is mixed without records. SAI Platform reported in April 2026 that more than 35 pilot initiatives across 25 countries and 23 production systems had validated its four-step regenerative agriculture framework. That scale of validation signals a market shift from voluntary farm practice programs toward supply-chain proof requirements that reach processors and ingredient buyers.
The main restraint is the cost of producing evidence across many farms and handlers. Each storage point can weaken the connection between farm practice and final ingredient specification. The Competition and Markets Authority published supply-chain green-claim guidance in January 2026 to explain business responsibility for environmental claims. This creates pressure to verify claims before they reach packaging and customer-facing materials.
The opportunity is concentrated in systems that combine field data with processing records. Regrow announced PlanAI in February 2025 to help agrifood companies build supply-specific regenerative agriculture plans for Scope 3 targets. Providers that connect MRV software with procurement documents reduce repeated checks across the supply chain. This supports integrated food ingredients when one evidence file supports purchasing and compliance.
Which country CAGRs are profiled in the Regenerative Agriculture Ingredients & Supply Chain Market?
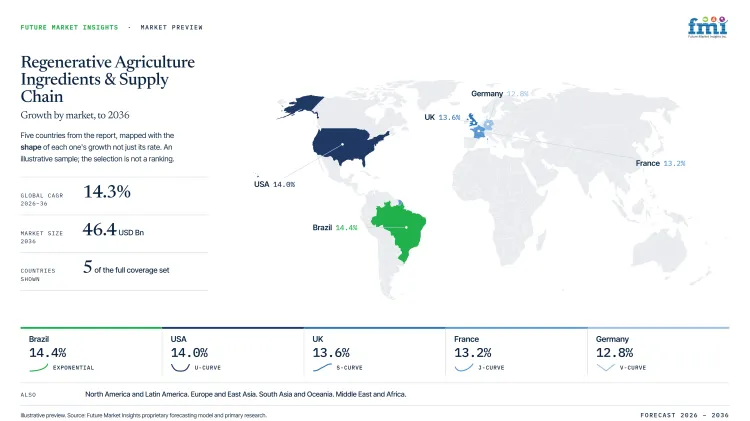
| Country | CAGR |
|---|---|
| USA | 14.0% |
| France | 13.2% |
| Germany | 12.8% |
| UK | 13.6% |
| Brazil | 14.4% |
How do country-level CAGRs compare in the Regenerative Agriculture Ingredients & Supply Chain Market?
Across the five profiled countries, Brazil records the highest forecast CAGR at 14.4%. USA and UK follow with growth above France and Germany. The spread between Brazil and Germany is 1.6 percentage points. These rates describe different commercialization speeds and do not rank countries by absolute revenue.
- Brazil and USA form the upper growth band due to large crop flows and deeper grain-handling networks.
- The UK follows the USA by 0.4 percentage points, with retailer claim scrutiny shaping demand for verified records.
- France records a CAGR 0.4 percentage points below the UK because processor review and EU claim rules influence adoption timing.
- Germany records the lowest profiled CAGR, yet its food processing base still supports high-value verified sourcing contracts.
- The pattern shows a gradual step-down and not a sharp divide between high-growth and low-growth countries.
Countries with similar CAGRs can still present different entry conditions due to crop mix and documentation cost. The full report provides country-level analysis across North America and Latin America. Coverage extends to Europe and East Asia along with South Asia and Oceania plus the Middle East and Africa.
Country-wise Analysis
- The United States combines large cereal acreage with CPG companies that require sourcing records before claim approval. Regenerative agriculture ingredients and supply-chain demand in the USA is projected to rise at 14.0% CAGR from 2026 to 2036. USDA NASS estimated in June 2026 that 95.3 million acres of corn were planted for the 2026 season. That crop base creates a large pool for cereal programs that depend on field-level evidence and lot identity. Cargill and ADM provide origination and processing scale that can move farm records into ingredient contracts. Investment plans should assign responsibility for verification cost before harvest because evidence gaps become harder to fix after grain enters shared storage.
- France combines cereal production with strict claim expectations across food processors and retail channels. Demand in France is forecast to expand at 13.2% CAGR through 2036. Agreste estimated in July 2026 that French soft wheat production would reach 32.0 million tonnes in 2026. The figure supports cereal-based sourcing programs where farm practices and crop identity must remain visible after storage. Local mills and starch processors need evidence that stays clear after grain handling. Commercial teams should keep farm evidence and processor records in one approval file because claim review becomes slower when the two records are separated.
- Germany offers a disciplined food processing base and a retail environment that asks for proof behind environmental claims. The German sector is projected to record 12.8% CAGR during the forecast period. Destatis reported in 2026 that Germany harvested approximately 22 million tonnes of winter wheat in 2025, supporting a food processing base where regenerative grain sourcing programs require documented field evidence across crop categories. SAI Platform and Regrow can support harmonized verification where German processors request comparable evidence across crop categories. Investment teams should define the audit record before launch because high documentation standards can delay repeat orders.
- The UK combines cereal production with active scrutiny of food labels and environmental claims. Demand is anticipated to advance at 13.6% CAGR from 2026 to 2036. DEFRA reported in May 2026 that 540 thousand hectares were farmed organically in the UK in 2025. That land base gives food companies a measurable starting point for verified farm-sourcing programs. Customer-facing sourcing claims require evidence that procurement and compliance teams can read without extra translation. System selection should favor tools that keep field practice and ingredient-lot evidence together because separate proof files raise approval time for CPG programs.
- Brazil combines very large crop flows with export customers that ask for proof on origin and land-use controls. Demand in Brazil is forecast to rise at 14.4% CAGR through 2036. IBGE estimated in July 2026 that Brazil would produce 347.4 million tonnes of cereals, legumes and oilseeds in 2026. The crop scale can support large verified ingredient flows when farms and elevators align records. Cargill, ADM and PepsiCo have direct relevance because their crop sourcing programs depend on traceable farm practice data. Investment plans should include land-use screening because export-facing customers require proof before higher-volume contracts move forward.
Who are the notable companies in the Regenerative Agriculture Ingredients & Supply Chain Market?
The notable companies shaping this market include SAI Platform; Cargill; ADM; Nestlé; Danone; General Mills; PepsiCo; Regrow; and Indigo Ag.
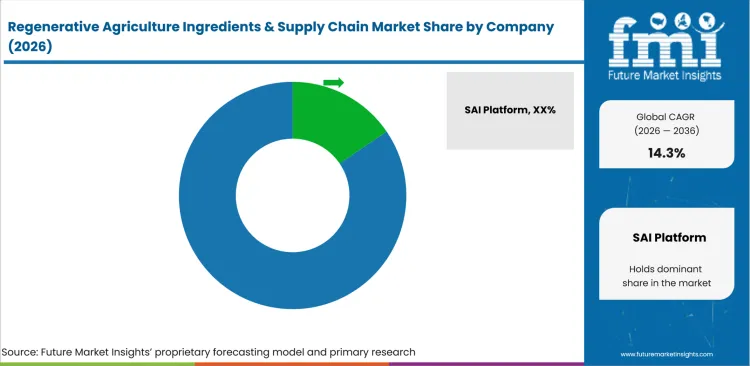
The competitive outlook combines standard-setting groups with crop origination companies and CPG programs. Framework providers compete through clear definitions and practical verification routes. Agribusiness companies compete through grower reach and identity-preserved handling. CPG companies compete through procurement rules that pull verified ingredients into branded supply chains. MRV software providers compete through field data, reporting tools and claim documentation.
- SAI Platform and Regrow compete through verification frameworks and digital MRV capabilities. Their commercial test is whether programs stay practical across crops and regions.
- Cargill and ADM compete through farmer relationships and ingredient origination networks. They can connect practice adoption with grain handling and processor records.
- Nestlé and Danone, like General Mills and PepsiCo, compete through procurement standards that turn regenerative farm programs into repeatable ingredient demand.
Competitive Benchmarking: Regenerative Agriculture Ingredients & Supply Chain Market
| Company | Crop Sourcing and Origination | MRV and Verification | Ingredient Supply Integration | Geographic Reach |
|---|---|---|---|---|
| SAI Platform | Low | High | Medium | Global member network |
| Cargill | High | Medium | High | Global origination and processing |
| ADM | High | Medium | High | North America and Europe |
| Nestlé | Medium | High | High | Global food and beverage portfolio |
| Danone | Medium | High | Medium | Europe and North America |
| General Mills | High | Medium | High | North America |
| PepsiCo | High | Medium | High | Global snacks and beverage supply |
| Regrow | Low | High | Medium | Global MRV software programs |
| Indigo Ag | Medium | High | Medium | North America |
Scoring basis: High indicates a documented core capability within the exact workflow and a dedicated commercial offer. Medium indicates direct support through an adjacent platform or documented program use. Low indicates limited direct evidence that the company supports the named capability within this workflow.
Key Developments in the Regenerative Agriculture Ingredients & Supply Chain Market
- In September 2025, ADM reported that its regenerative agriculture program engaged more than 5 million acres in 2024. The milestone shows that large agribusiness programs can expand farm enrollment while supporting ingredient companies that need Scope 3 and sourcing evidence.
- In September 2025, PepsiCo partnered with Mars and ADM on a regenerative agriculture program in Poland. The initiative covers 5,454 hectares and connects rapeseed oil and wheat sourcing with branded food and pet care supply chains.
- In April 2025, Regrow earned CDP accreditation as a solutions partner for forest and land disclosures. The accreditation strengthens its role in agricultural emissions reporting and farm-level claim support.
Notable Companies in the Regenerative Agriculture Ingredients & Supply Chain Market
Verification and Program Framework Providers
- SAI Platform
- Regrow
- Indigo Ag
Agribusiness and Ingredient Supply Groups
- Cargill
- ADM
CPG and Food Program Owners
- Nestlé
- Danone
- General Mills
- PepsiCo
Regenerative Agriculture Ingredients & Supply Chain Market - Report Scope
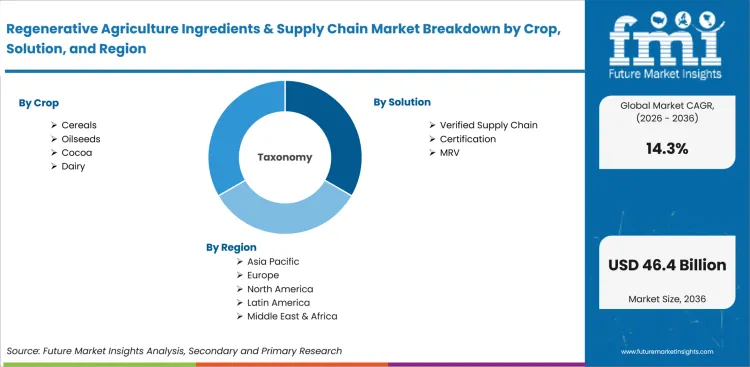
| Coverage field | Report scope |
|---|---|
| Market breakdown | Crop, solution, end user, and region. |
| Quantitative Units | Revenue in USD Billion, CAGR in %. |
| Market Definition | Revenue from regenerative ingredients and verification systems. The scope also includes traceability services and supply-chain work tied to regenerative crop sourcing for food and beverage applications. |
| Regions Covered | North America and Latin America. Europe and East Asia. South Asia and Oceania. Middle East and Africa. |
| Countries Covered | USA and France. Germany and UK. Brazil. |
| Companies Profiled | SAI Platform and Cargill. ADM and Nestlé. Danone and General Mills. PepsiCo with Regrow and Indigo Ag |
| Forecast Period | 2026 to 2036. |
| Approach | Hybrid bottom-up and top-down market sizing supported by primary interviews and official desk research. |
Regenerative Agriculture Ingredients & Supply Chain Market - Research Methodology
| Method | Approach |
|---|---|
| Primary Research | FMI analysts gathered input from manufacturers, service providers, technology developers, distributors, end users, procurement teams, and subject-matter experts. Interviews examined purchasing decisions, product or service evaluation, adoption barriers, approval requirements, pricing considerations, and expectations for technical or commercial support. Respondents were also asked what evidence is required before a trial, pilot, or initial order develops into regular purchasing. |
| Desk Research | Desk research covered government statistics, regulatory publications, trade data, industry associations, technical literature, standards, company filings, product information, and official corporate announcements. Sources were reviewed for relevance, publication date, geographic coverage, and consistency with the defined market scope. Claims relating to performance, applications, approvals, capacity, investment, and commercial activity were retained only when supported by credible public evidence. |
| Market Sizing and Forecasting | The market model combined the baseline value with historical performance, segment structure, pricing and volume indicators, adoption levels, company participation, and country-level demand conditions. Forecast assumptions considered economic activity, investment trends, regulatory developments, technology adoption, purchasing cycles, supply availability, and barriers to wider market use. Segment and regional estimates were reconciled before the final market total was calculated. |
| Data Validation | Estimates were checked against multiple independent indicators, including public data, company activity, trade patterns, industry developments, and findings from primary interviews. Validation tested whether products, services, applications, and company revenues fell within the defined market boundaries. Adjacent categories, unsupported claims, overlapping revenues, and activities without direct market relevance were excluded to reduce double counting and maintain consistency across segments and countries. |
Regenerative Agriculture Ingredients & Supply Chain Market by Segments
Regenerative Agriculture Ingredients & Supply Chain Market segmented by Crop:
- Cereals
- Oilseeds
- Cocoa
- Dairy
- Other crops
Regenerative Agriculture Ingredients & Supply Chain Market segmented by Solution:
- Verified Supply Chain
- Certification
- MRV
- Other solutions
Regenerative Agriculture Ingredients & Supply Chain Market segmented by End User:
- CPG
- Ingredient companies
- Retailers
- Foodservice
- Other commercial users
Regenerative Agriculture Ingredients & Supply Chain Market by Region:
- North America
- United States
- Canada
- Latin America
- Brazil
- Mexico
- Argentina
- Chile
- Western Europe
- Germany
- France
- United Kingdom
- Italy
- Spain
- Benelux
- Nordics
- Eastern Europe
- Poland
- Czech Republic
- Romania
- Hungary
- East Asia
- China
- Japan
- South Korea
- South Asia and Pacific
- India
- ASEAN
- Australia and New Zealand
- Middle East and Africa
- GCC Countries
- South Africa
- Türkiye
- Israel
Research Sources and Bibliography
- Sustainable Agriculture Initiative Platform. (2026, April 21). SAI Platform completes global pilot phase as industry prepares for regenerative agriculture transition.
- ADM. (2025, September 8). ADM Exceeds 5M Regenerative Agriculture Acreage Goal.
- Competition and Markets Authority. (2026, January 22). Making green claims: Getting it right, across the supply chain.
- Agreste. (2026, July 15). Grandes cultures. Recul attendu des récoltes de blé tendre et d’orges du fait de rendements en baisse.
- Statistisches Bundesamt. (2026, February 26). Gemüseernte erreicht 2025 neuen Höchststand.
- Department for Environment, Food & Rural Affairs. (2026, May 7). Organic farming statistics 2025: United Kingdom.
- Instituto Brasileiro de Geografia e Estatística. (2026, July 14). In June, IBGE estimates crops of 347.4 million tonnes for 2026.
- ADM. (2025, September 9). PepsiCo, Mars, and ADM Partner to Advance Regenerative Agriculture to Support Farmers in Poland Through a Holistic, Landscape-Level Approach.
- Regrow Ag. (2025, April 22). Regrow Earns CDP Accreditation as Solutions Partner for Forest and Land Disclosures.
This bibliography is provided for reader reference and is not exhaustive. The full report contains the complete reference list and detailed citations.
This Report Answers
- How large is the regenerative agriculture ingredients and supply-chain opportunity in 2026 and 2036?
- Which crop, solution and end-user categories lead the forecast?
- Why do cereals hold the leading crop share in 2026?
- How does Verified Supply Chain influence claim review and ingredient approval?
- Why does CPG represent the largest end-user group?
- How do country growth rates differ across USA and France as well as Germany, UK and Brazil?
- Which companies support verification and origination as well as MRV and CPG-led programs?
- What limits verified sourcing when crop lots move through multiple handlers?
- How can digital MRV and identity-preserved handling reduce approval friction?
Frequently Asked Questions
How big is the Regenerative Agriculture Ingredients & Supply Chain Market in 2026?
The regenerative agriculture ingredients and supply chain market is valued at USD 12.2 billion in 2026 and is forecast to reach USD 46.4 billion by 2036, driven by growing demand from food companies that need verified farm-practice records connected through storage, processing, and ingredient approval.
What is the CAGR of the Regenerative Agriculture Ingredients & Supply Chain Market from 2026 to 2036?
The regenerative agriculture ingredients and supply chain market is projected to grow at a CAGR of 14.3% between 2026 and 2036, supported by expanding requirements for traceable farm-practice data across commercial grain handling, processor documentation, and CPG sourcing programs.
Which crop leads the Regenerative Agriculture Ingredients & Supply Chain Market?
Cereals account for 36.3% of the regenerative agriculture ingredients and supply chain market by crop in 2026, driven by their scale across food ingredients, milling, starch processing, and feed supply chains where farm-practice identity must remain linked with crop lots through storage and handling.
Which country is growing fastest in the Regenerative Agriculture Ingredients & Supply Chain Market?
The regenerative agriculture ingredients and supply chain market in Brazil is projected to grow at a CAGR of 14.4% through 2036, supported by very large cereal, legume, and oilseed crop flows and export-facing customers that require verified origin and land-use documentation before high-volume contracts move forward.
Who are the leading companies in the Regenerative Agriculture Ingredients & Supply Chain Market?
Leading companies in the regenerative agriculture ingredients and supply chain market include SAI Platform, Cargill, ADM, Nestlé, Danone, General Mills, PepsiCo, Regrow, and Indigo Ag, spanning verification frameworks, digital MRV systems, grain origination networks, and CPG-led regenerative procurement programs.
Preview the report firsthand - request a free sample
Get SampleGet the brochure for pricing and purchase details.
Get PDFTable of Content
- Key Takeaways
- Market Size and CAGR
- Top Growth Driver
- Fastest Growing Segment
- Leading Region
- Key Companies
- Emerging Opportunities
- Executive Summary
- Global Market Outlook
- Demand-side Trends
- Supply-side Trends
- Technology Roadmap Analysis
- Analysis and Recommendations
- Analyst Perspective (What is happening? Why now? What should investors know?)
- Key Questions Answered
- How large is the market?
- What is the CAGR?
- What are key trends?
- Which region dominates?
- Who are the leaders?
- Market Overview
- Market Coverage / Taxonomy
- Market Definition / Scope / Limitations
- Research Methodology
- Chapter Orientation
- Analytical Lens and Working Hypotheses
- Market Structure, Signals, and Trend Drivers
- Benchmarking and Cross-market Comparability
- Market Sizing, Forecasting, and Opportunity Mapping
- Research Design and Evidence Framework
- Desk Research Programme (Secondary Evidence)
- Expert Input and Fieldwork (Primary Evidence)
- Tooling, Models, and Reference Databases
- Data Engineering and Model Build
- Quality Assurance and Audit Trail
- Market Background
- Market Dynamics (Drivers, Restraints, Opportunity, Trends)
- Scenario Forecast (Optimistic, Likely, Conservative)
- Impact Analysis
- AI Impact
- Sustainability Impact
- Regulatory Impact
- Technology Impact
- Consumer / Buyer Analysis
- Purchase Drivers
- Adoption Barriers
- Buyer Journey
- Opportunity Map Analysis
- Product Life Cycle Analysis
- Supply Chain Analysis
- Investment Feasibility Matrix
- Value Chain Analysis
- PESTLE and Porter's Analysis
- Regulatory Landscape
- Regional Parent Market Outlook
- Production and Consumption Statistics
- Import and Export Statistics
- Global Market Analysis and Forecast, 2021 to 2036
- Historical Market Size Value (USD Billion) Analysis, 2021 to 2025
- Current and Future Market Size Value (USD Billion) Projections, 2026 to 2036
- Y-o-Y Growth Trend Analysis
- Absolute $ Opportunity Analysis
- Global Market Pricing Analysis, 2021 to 2036
- Global Market Analysis and Forecast, By Crop, 2021 to 2036
- Introduction / Key Findings
- Historical Market Size Value (USD Billion) Analysis By Crop, 2021 to 2025
- Current and Future Market Size Value (USD Billion) Analysis and Forecast By Crop, 2026 to 2036
- Cereals
- Oilseeds
- Cocoa
- Dairy
- Cereals
- Y-o-Y Growth Trend Analysis By Crop, 2021 to 2025
- Absolute $ Opportunity Analysis By Crop, 2026 to 2036
- Global Market Analysis and Forecast, By Solution, 2021 to 2036
- Introduction / Key Findings
- Historical Market Size Value (USD Billion) Analysis By Solution, 2021 to 2025
- Current and Future Market Size Value (USD Billion) Analysis and Forecast By Solution, 2026 to 2036
- Verified Supply Chain
- Certification
- MRV
- Verified Supply Chain
- Y-o-Y Growth Trend Analysis By Solution, 2021 to 2025
- Absolute $ Opportunity Analysis By Solution, 2026 to 2036
- Global Market Analysis and Forecast, By End User, 2021 to 2036
- Introduction / Key Findings
- Historical Market Size Value (USD Billion) Analysis By End User, 2021 to 2025
- Current and Future Market Size Value (USD Billion) Analysis and Forecast By End User, 2026 to 2036
- CPG
- Ingredient Suppliers
- CPG
- Y-o-Y Growth Trend Analysis By End User, 2021 to 2025
- Absolute $ Opportunity Analysis By End User, 2026 to 2036
- Global Market Analysis and Forecast, By Region, 2021 to 2036
- Introduction
- Historical Market Size Value (USD Billion) Analysis By Region, 2021 to 2025
- Current Market Size Value (USD Billion) Analysis and Forecast By Region, 2026 to 2036
- North America
- Latin America
- Western Europe
- Eastern Europe
- East Asia
- South Asia and Pacific
- Middle East & Africa
- Market Attractiveness Analysis By Region
- North America Market Analysis and Forecast, By Country, 2021 to 2036
- Historical Market Size Value (USD Billion) Trend Analysis By Market Taxonomy, 2021 to 2025
- Market Size Value (USD Billion) Forecast By Market Taxonomy, 2026 to 2036
- By Country
- USA
- Canada
- By Crop
- By Solution
- By End User
- By Country
- Market Attractiveness Analysis
- By Country
- By Crop
- By Solution
- By End User
- Key Takeaways
- Latin America Market Analysis and Forecast, By Country
- Historical Market Size Value (USD Billion) Trend Analysis By Market Taxonomy, 2021 to 2025
- Market Size Value (USD Billion) Forecast By Market Taxonomy, 2026 to 2036
- By Country
- Brazil
- Mexico
- Chile
- Rest of Latin America
- By Crop
- By Solution
- By End User
- By Country
- Market Attractiveness Analysis
- By Country
- By Crop
- By Solution
- By End User
- Key Takeaways
- Western Europe Market Analysis and Forecast, By Country
- Historical Market Size Value (USD Billion) Trend Analysis By Market Taxonomy, 2021 to 2025
- Market Size Value (USD Billion) Forecast By Market Taxonomy, 2026 to 2036
- By Country
- Germany
- UK
- Italy
- Spain
- France
- Nordic
- BENELUX
- Rest of Western Europe
- By Crop
- By Solution
- By End User
- By Country
- Market Attractiveness Analysis
- By Country
- By Crop
- By Solution
- By End User
- Key Takeaways
- Eastern Europe Market Analysis and Forecast, By Country
- Historical Market Size Value (USD Billion) Trend Analysis By Market Taxonomy, 2021 to 2025
- Market Size Value (USD Billion) Forecast By Market Taxonomy, 2026 to 2036
- By Country
- Russia
- Poland
- Hungary
- Balkan & Baltic
- Rest of Eastern Europe
- By Crop
- By Solution
- By End User
- By Country
- Market Attractiveness Analysis
- By Country
- By Crop
- By Solution
- By End User
- Key Takeaways
- East Asia Market Analysis and Forecast, By Country
- Historical Market Size Value (USD Billion) Trend Analysis By Market Taxonomy, 2021 to 2025
- Market Size Value (USD Billion) Forecast By Market Taxonomy, 2026 to 2036
- By Country
- China
- Japan
- South Korea
- By Crop
- By Solution
- By End User
- By Country
- Market Attractiveness Analysis
- By Country
- By Crop
- By Solution
- By End User
- Key Takeaways
- South Asia and Pacific Market Analysis and Forecast, By Country
- Historical Market Size Value (USD Billion) Trend Analysis By Market Taxonomy, 2021 to 2025
- Market Size Value (USD Billion) Forecast By Market Taxonomy, 2026 to 2036
- By Country
- India
- ASEAN
- Australia & New Zealand
- Rest of South Asia and Pacific
- By Crop
- By Solution
- By End User
- By Country
- Market Attractiveness Analysis
- By Country
- By Crop
- By Solution
- By End User
- Key Takeaways
- Middle East & Africa Market Analysis and Forecast, By Country
- Historical Market Size Value (USD Billion) Trend Analysis By Market Taxonomy, 2021 to 2025
- Market Size Value (USD Billion) Forecast By Market Taxonomy, 2026 to 2036
- By Country
- Kingdom of Saudi Arabia
- Other GCC Countries
- Türkiye
- South Africa
- Other African Union
- Rest of Middle East & Africa
- By Crop
- By Solution
- By End User
- By Country
- Market Attractiveness Analysis
- By Country
- By Crop
- By Solution
- By End User
- Key Takeaways
- Key Countries Market Analysis
- USA
- Pricing Analysis
- Market Share Analysis, 2025
- By Crop
- By Solution
- By End User
- Canada
- Pricing Analysis
- Market Share Analysis, 2025
- By Crop
- By Solution
- By End User
- Mexico
- Pricing Analysis
- Market Share Analysis, 2025
- By Crop
- By Solution
- By End User
- Brazil
- Pricing Analysis
- Market Share Analysis, 2025
- By Crop
- By Solution
- By End User
- Chile
- Pricing Analysis
- Market Share Analysis, 2025
- By Crop
- By Solution
- By End User
- Germany
- Pricing Analysis
- Market Share Analysis, 2025
- By Crop
- By Solution
- By End User
- UK
- Pricing Analysis
- Market Share Analysis, 2025
- By Crop
- By Solution
- By End User
- Italy
- Pricing Analysis
- Market Share Analysis, 2025
- By Crop
- By Solution
- By End User
- Spain
- Pricing Analysis
- Market Share Analysis, 2025
- By Crop
- By Solution
- By End User
- France
- Pricing Analysis
- Market Share Analysis, 2025
- By Crop
- By Solution
- By End User
- India
- Pricing Analysis
- Market Share Analysis, 2025
- By Crop
- By Solution
- By End User
- ASEAN
- Pricing Analysis
- Market Share Analysis, 2025
- By Crop
- By Solution
- By End User
- Australia & New Zealand
- Pricing Analysis
- Market Share Analysis, 2025
- By Crop
- By Solution
- By End User
- China
- Pricing Analysis
- Market Share Analysis, 2025
- By Crop
- By Solution
- By End User
- Japan
- Pricing Analysis
- Market Share Analysis, 2025
- By Crop
- By Solution
- By End User
- South Korea
- Pricing Analysis
- Market Share Analysis, 2025
- By Crop
- By Solution
- By End User
- Russia
- Pricing Analysis
- Market Share Analysis, 2025
- By Crop
- By Solution
- By End User
- Poland
- Pricing Analysis
- Market Share Analysis, 2025
- By Crop
- By Solution
- By End User
- Hungary
- Pricing Analysis
- Market Share Analysis, 2025
- By Crop
- By Solution
- By End User
- Kingdom of Saudi Arabia
- Pricing Analysis
- Market Share Analysis, 2025
- By Crop
- By Solution
- By End User
- Türkiye
- Pricing Analysis
- Market Share Analysis, 2025
- By Crop
- By Solution
- By End User
- South Africa
- Pricing Analysis
- Market Share Analysis, 2025
- By Crop
- By Solution
- By End User
- USA
- Market Structure Analysis
- Competition Dashboard
- Competition Benchmarking
- Market Share Analysis of Top Players
- By Regional
- By Crop
- By Solution
- By End User
- Emerging Startups
- Innovation Benchmarking
- Competition Analysis
- Competition Deep Dive
- SAI Platform
- Overview
- Product Portfolio
- Profitability by Market Segments
- Sales Footprint
- Strategy Overview
- Marketing Strategy
- Product Strategy
- Channel Strategy
- Cargill
- ADM
- Nestlé
- Danone
- General Mills
- PepsiCo
- Regrow
- Indigo Ag
- SAI Platform
- Case Studies
- Success Stories
- Recent Developments
- Competition Deep Dive
- Assumptions & Acronyms Used


