

- Market Size (2026)
- USD 400.9 Mn
- Forecast (2036)
- USD 803.5 Mn
- CAGR (2026 to 2036)
- 7.2%
How big is the Regenerative Agriculture Verified Food Ingredients Market in 2026?
USD 400.9 million in 2026 and USD 803.5 million by 2036 at a 7.2% CAGR.
Demand for regenerative agriculture verified food ingredients is projected to expand at 7.2% CAGR between 2026 and 2036, increasing valuation from USD 400.9 million in 2026 to USD 803.5 million by 2036. The industry outlook represents recurring commercial demand during the forecast period. Bunge opened its dedicated food-grade soy protein concentrate facility for commercial production in Indiana during May 2026. The facility processes local soybeans into protein ingredients for bakery, snacks, meat, and plant-based foods. Bunge said its integrated supply chain can work directly with farmers using regenerative practices, connecting farm participation with commercial ingredient output. Food manufacturers must verify lot identity and technical performance before applying sourcing claims across recurring formulas.
European importers face a separate document route for organic ingredients entering the European Union during formal customs review. Commission Delegated Regulation (EU) 2021/2306 requires a certificate of inspection for every consignment and requires issuance through TRACES. The control body must upload commercial and transport documents with the certificate record for shipment review. The shipment-level checkpoint cannot be replaced by a private regenerative claim during ingredient qualification and final customer review. Companies selling one ingredient across several countries therefore need legal import records and separate evidence supporting the regenerative claim. Any mismatch between lot identity and customer labeling can delay release or require claim changes. Regional teams reduce that risk by matching purchase orders with certified origin records and final formulation documents.
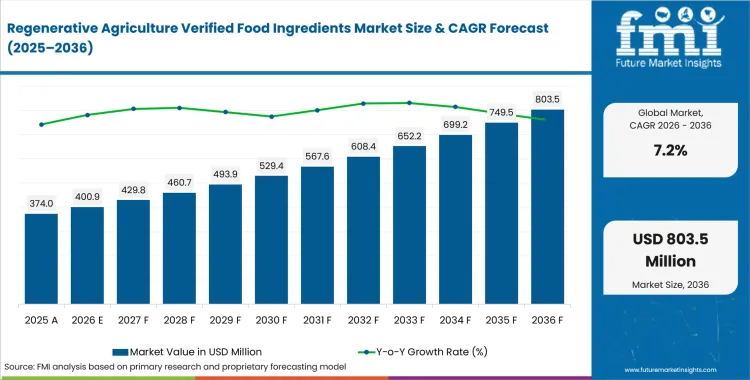
Key Takeaways of Regenerative Agriculture Verified Food Ingredients Market
- Customer-backed crop programs support demand by connecting verified farm practices with ingredient lots that food manufacturers can approve for recurring formulas.
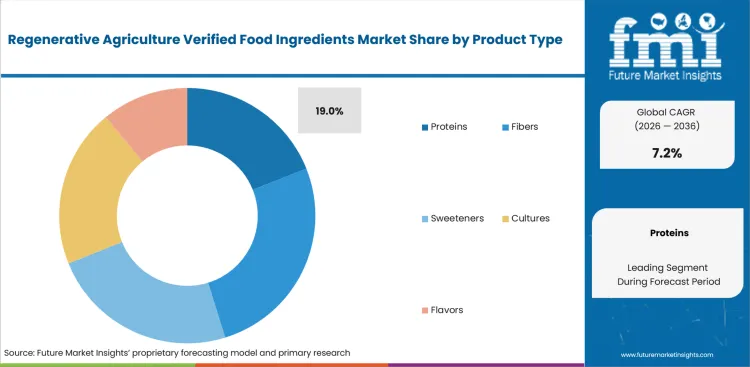
- Proteins are projected to capture 19.0% share in 2026, attributable to broad use across nutrition and formulation systems.
- Plant sources are anticipated to hold 23.0% by source in 2026, supported by large crop availability and established processing routes.
- Bakery is expected to account for 24.0% of application demand in 2026, reflecting steady flour use across packaged and fresh food production.
- Different certification systems and incomplete batch records slow qualification across national markets and customer-specific regenerative claims.
- Competition includes Cargill and ADM with ofi and Bunge, while Ingredion and focused grain specialists differentiate through application support.
Analyst Perspective
"Market scale depends on ingredient companies preserving verified farm records through processing and customer claim review. Processors must link field evidence with storage and milling records so each commercial lot remains defensible. Food manufacturers also need stable protein and flour performance across crop years before renewing verified sourcing contracts. Companies combining both requirements reduce repeated qualification work and give brands a clearer basis for long-term purchasing."
- Nandini Roy Choudhury, Principal Analyst, Future Market Insights
How is the Regenerative Agriculture Verified Food Ingredients Market segmented?
The regenerative agriculture verified food ingredients market is segmented by product type, source, application, end user, and region.
The market is assessed by product type, source, application, end user, and region across recurring commercial programs. Product type covers proteins, fibers, sweeteners, cultures, and flavors used across food and beverage formulations. Source analysis compares plant inputs with microbial food cultures, dairy analog materials, upcycled inputs, and mineral ingredients according to origin control and processing needs. Application coverage includes bakery, beverages, snacks, infant nutrition, and ready meals produced through repeat manufacturing schedules. End-user analysis separates food manufacturers, beverage manufacturers, foodservice operators, contract manufacturers, and retail brands with different approval roles. Regional analysis tracks North America, Europe, East Asia, South Asia and Pacific, Latin America, and Middle East and Africa. The taxonomy links ingredient function with the document route and production setting that shape commercial qualification.
Why do proteins account for the largest product type share?
Protein processors must preserve crop identity through crushing and concentration so final lots remain linked to verified farm records. Bunge and Bangkok Produce expanded a blockchain-traced soy program in September 2025 for food and feed supply across Southeast Asia. The commercial system scales traceability for soy and soy meal while regenerative projects remain a future collaboration rather than an operating program. Customers using plant-based protein gain stronger origin records, but regenerative claims require separate evidence from active farm programs.
- Based on product type, proteins are projected to account for 19.0% in 2026 due to broad use across nutrition products and familiar formulation systems. Established quality tests give manufacturers familiar specifications across nutrition products and prepared-food categories during routine qualification. Consistent functionality also reduces qualification work compared with less familiar verified ingredient formats entering commercial production.
- Food manufacturers approve verified protein ingredients more readily with chain records that follow material from farm enrollment through final concentration. Reliable mass-balance controls prevent conventional volumes from weakening the evidence attached to contracted lots during customer review. Clear segregation plans also support annual claim renewals and routine quality reviews across protein formulations.
What supports plant within the source category?
Plant inputs fit grain and oilseed systems that already support testing and storage across large ingredient networks. Existing mills can process verified lots through established quality controls during customer qualification and routine production. Cargill and PepsiCo announced in July 2025 a program targeting 240,000 Iowa acres by 2030 within their shared corn supply chain. The program connects farm practices with corn used for integrated food ingredients and creates defined customer reporting. Field records must remain linked through grain handling so contracted ingredients retain credible origin evidence.
- By source, plant is estimated to hold 23.0% in 2026 owing to large crop availability and established grain processing routes. Existing mills and extraction facilities can add verified lots during customer qualification and production planning. Common crop specifications also simplify review for starches and sweeteners used in repeat food manufacturing.
- Manufacturers favor plant inputs that preserve certificate status through transport and processing across contracted farms. Programs create more value through lot records that connect field data with customer claim rules. Mixed-origin loads remain a material risk if traceability systems cannot identify each participating farm within the finished ingredient batch and customer claim.
How does bakery shape application demand?
Bakery production depends on flour consistency and documented grain origins across several large industrial production schedules. Ardent Mills reported in September 2025 that its regenerative agriculture programs enrolled 516,000 acres during fiscal 2025. The acreage gives bakery ingredients customers a wider grain base for bread and snack manufacturing. Commercial value depends on millers pairing farm records with flour specifications across changing crop years.
- The application category is forecast to be led by bakery at 24.0% share in 2026 due to repeat recipes and predictable flour purchasing across industrial production. Large production batches justify separate sourcing records and customer-specific claims across national plants and regional facilities. Repeat formulas also support direct performance comparisons between verified and conventional flour lots during qualification.
- Bakers adopt verified flour more readily with documented tolerances for protein strength and water absorption across crop years. Consistent specifications protect dough handling and finished texture during recurring production runs across several mill locations. Regenerative records add limited commercial value if the supporting flour data cannot pass customer recipe approval.
Why do food manufacturers remain central to end user demand?
Food manufacturers combine several ingredients within one formula and must defend each farm-linked claim across labels and customer records. Application teams also test taste and texture during routine commercial qualification across several branded product lines. Ingredion announced in April 2025 that external verification covered its full contracted stevia supply at the FSA Silver performance level. The development gives teams managing sweetener formulations a clear example of external farm verification supporting customer sourcing reviews.
- Food manufacturers are projected to hold 25.0% share in 2026 owing to direct control over formulation approval and finished-product claims. Manufacturing teams determine whether documentation supports the intended claim and ingredient performance meets production requirements. Their recurring orders can spread certification costs across several customer programs and multiple product lines.
- Food manufacturers prefer ingredient partners that combine farm records with allergen controls and specification management in one approval file. Qualification slows if a verified crop claim lacks batch documents or a clear substitution process. Application support becomes decisive for reformulations that must preserve taste and texture beside verified sourcing claims.
What are the drivers, restraints, and opportunities in the Regenerative Agriculture Verified Food Ingredients Market?
Customer-backed crop programs support demand; fragmented claim systems slow qualification; claim-ready document services create a route to repeat orders.
- Driver: Customer-backed crop programs are expanding ingredient demand by connecting farm practices with named commercial formulas and reporting requirements.
- Restraint: Different certification systems impose distinct record and labeling requirements for the same ingredient across national markets.
- Opportunity: Claim-ready document services can convert verified crop streams into repeat contracts across several formulas and customer regions.
Brand commitments create direct demand once farm programs connect verified crops with ingredients used in named formulas. ofi and Nestlé launched an agroforestry partnership in April 2025 covering about 25,000 cocoa farmers across Brazil, Côte d'Ivoire, and Nigeria. The program targets more than 72,000 hectares and creates a defined route for monitoring farm changes. Cocoa processors can use those records during customer reviews tied to sourcing commitments and annual brand reporting.
Certification fragmentation raises qualification costs through separate claim rules for the same ingredient across several markets. Formulators need accurate ingredient percentages and approved wording across every finished-product label and customer specification. USDA updated its organic labeling guidance in June 2026 and retained different thresholds for organic products and products made with organic ingredients. Incorrect calculations or certificates can delay packaging approval and interrupt repeat ingredient orders across national product lines.
Claim management offers a commercial opening for companies that can update verified product files without delaying production. The Regenerative Organic Alliance 2026 renewal process requires product worksheets and system plans for licensed products. New licensees must submit disclosure forms and current certificates for every changed commercial supply route. Updated labels require approval from the alliance before printing or commercial use across licensed products. Ingredient teams that maintain these records can support several customer formulas with fewer repeated qualification steps.
Which country CAGRs are profiled in the Regenerative Agriculture Verified Food Ingredients Market?
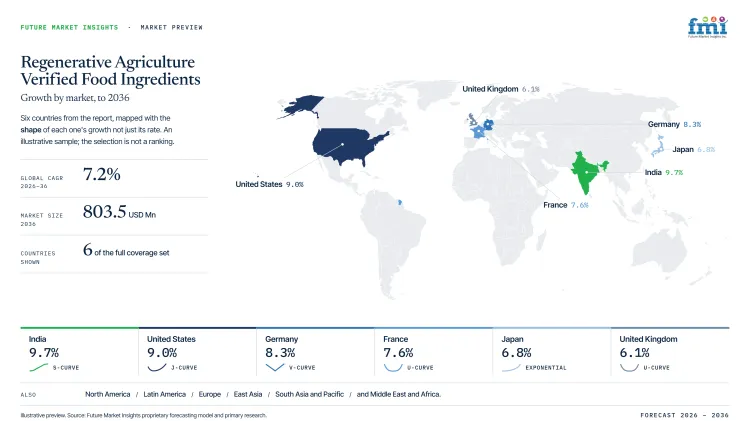
| Country | CAGR |
|---|---|
| India | 9.7% |
| United States | 9.0% |
| Germany | 8.3% |
| France | 7.6% |
| Japan | 6.8% |
| United Kingdom | 6.1% |
How do country-level CAGRs compare in the Regenerative Agriculture Verified Food Ingredients Market?
The six forecasts span 3.6 percentage points and form a gradual progression rather than separate performance tiers. India and the United States have large farm programs or export systems that can widen documented crop volumes. Germany and France combine established processing capacity with mature food manufacturing channels serving national customers. Japan and the United Kingdom operate formal certification routes with narrower gains in handling capacity or conversion supply. The spread reflects different routes for expanding traceable ingredient volumes rather than a simple difference in customer interest. Processor access and document control determine how efficiently farm evidence becomes repeat manufacturing business across national accounts.
- India combines export certification capacity with TraceNet records that connect processors and consignments across several destination markets.
- United States programs benefit from large farm networks, but imported organic ingredients require shipment-level NOP documentation before departure.
- Germany combines established milling capacity with customer-backed farm programs, although European claim reviews can extend ingredient qualification schedules.
- France combines corn-processing demand with structured farm training, yet adviser coverage and monoculture economics can slow wider program expansion.
- Japan offers an established network of audited ingredient handlers, but regenerative claims require separate farm evidence beyond Organic JAS status.
- United Kingdom processors bring experience with audited ingredient handling, yet fewer certified facilities increase service pressure for new verified crop programs.
Comparable CAGRs can produce different entry conditions through national certification routes and processor density or service costs. Companies need local document control and application support to convert forecast momentum into repeat ingredient contracts. The full report provides country-level CAGR analysis across North America, Latin America, Europe, East Asia, South Asia, Oceania and the Middle East and Africa.
Country-wise Analysis
- India's NPOP system links certified processors with export consignments through TraceNet transaction records across several destination markets. ADM announced in May 2026 that its Farm Forward partnership would engage 15,000 new soybean farmers across four Maharashtra districts. India's regenerative agriculture verified food ingredients outlook is anticipated to advance at 9.7% CAGR over the assessment period, supported by export-oriented soybean processing and expanding field programs. Digital advisory support and farmer-organization capacity can strengthen origin records for soybean ingredients entering export channels. USDA guidance updated in September 2025 requires Indian organic exports to use direct certification and electronic import certificates for United States shipments. Processors serving several markets therefore manage separate document routes for the same certified crop stream.
- United States ingredient networks combine national organic traceability rules with large farm programs linked to major food manufacturers. The regenerative agriculture verified food ingredients market in the United States is estimated to post 9.0% CAGR over the forecast period, influenced by federal conservation funding and established food processing capacity. USDA launched a USD 700 million regenerative agriculture pilot in December 2025 through EQIP and CSP contracts, combining whole-farm planning across both programs. The funding route can lower early practice costs and widen the documented crop base available for verified ingredient programs. USDA enforcement guidance updated in June 2026 requires electronic import certificates for foreign organic shipments before departure. Companies must therefore manage domestic farm records and import files across recurring customer qualification cycles and annual renewals.
- Germany combines established grain processing with customer-backed programs that connect growers to downstream ingredient users. ADM expanded its re:generations program to Germany in January 2025 with a 60,000-acre goal for wheat and oilseed farms. Adoption of regenerative agriculture verified food ingredients in Germany is estimated to expand at 8.3% CAGR through 2036, underpinned by documented wheat and oilseed programs serving established mills. ADM and Klim defined more than 30 indicators for monitoring farm practices and customer reporting. European organic records can extend qualification if one ingredient enters several branded formulas across multiple markets. Local application support must also translate farm results into stable milling specifications for repeat orders.
- France combines a large corn-processing base with farm networks that require local agronomic support during regenerative program expansion. In its August 2025 project update, Danone Ecosystem described Soil4Good as an ongoing 2024-2030 French program developed with Ingredion and public-sector partners. The project targets 200 farmers and uses a train-the-trainer model to widen technical support across participating areas. The regenerative agriculture verified food ingredients sector in France is projected to record 7.6% CAGR during the assessment period, reinforced by corn ingredient demand and local training capacity. Regional advisers and structured field records can widen documented corn supply for commercial food ingredient processors. Corn monoculture economics and limited technical coverage remain material frictions for farms considering broader practice changes. Ingredient processors need consistent records across participating farms before verified corn enters repeat customer formulas.
- Japan maintains a formal Organic JAS system with public lists for certified farms and processed-food operators. MAFF published an operator list current to July 1, 2026 for businesses consenting to public disclosure. Organic JAS status does not establish a regenerative claim, but the register identifies experienced handlers for segregated and audited ingredient flows. Regenerative agriculture verified food ingredient demand in Japan is forecast to rise at 6.8% CAGR over the forecast period, linked to careful claim review and established certification capability. Repacking or transformation requires continued record control and can extend qualification for ingredients drawn from several origins. Companies need qualified handlers near manufacturing clusters and separate farm evidence supporting every regenerative claim.
- United Kingdom processors use approved control bodies and maintain detailed records for ingredients carrying an organic claim. Defra reported in May 2026 that organic conversion covered 79 thousand hectares and certified processor numbers reached 1,715. Organic status does not establish a regenerative claim, but the operating base shows available experience with segregated ingredient records and audited handling. Regenerative agriculture verified food ingredient sales in the United Kingdom are forecast to expand at 6.1% CAGR by 2036, shaped by farm-program growth and existing certification capability. Fewer processors than in 2024 create a local handling constraint for new verified crop volumes. Brands need early contracts with qualified processors and separate evidence supporting every regenerative ingredient claim.
Who are the notable companies in the Regenerative Agriculture Verified Food Ingredients Market?
Cargill, ADM, ofi, Bunge, Ingredion, Ardent Mills, Scoular, and Tate & Lyle are the notable companies profiled in this market.
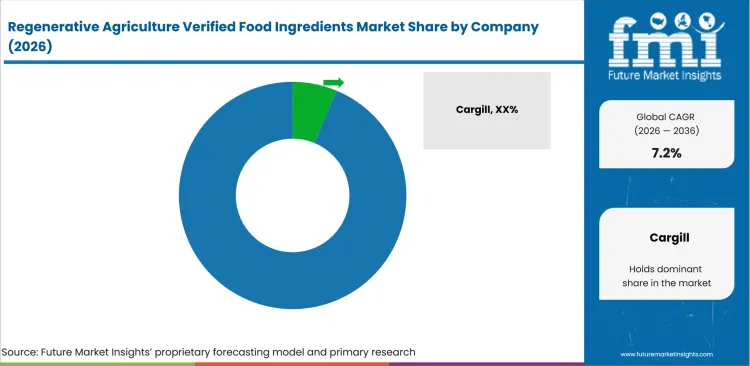
The competitive field combines global crop processors with specialists that provide application support and chain records for customer claims. Cargill and ADM connect farm programs with ingredient processing across several crop categories and regions. ofi and Bunge add traceable cocoa or oilseed supply, while Ingredion supports specialty formulation and verified stevia sourcing. Ardent Mills and Scoular provide North American grain routes for flour and dietary fiber applications. Tate & Lyle adds sweetener expertise through a French regenerative corn program serving specialty ingredient customers. The same discipline applies to food additives and requires clear specifications with origin records across customer formulas.
- Cargill and ADM combine broad crop origination with processing capacity and customer-backed farm programs across several regions. Their networks support large contracts across corn, wheat, and oilseed categories, but every customer claim requires crop-specific evidence and clear renewal records.
- ofi and Bunge compete through traceable cocoa or oilseed supply across global food manufacturing markets. Ingredion emphasizes specialty ingredients with external farm verification and formulation support for branded food customers. Different crop coverage remains a central qualification issue across all three commercial portfolios and customer programs.
- Ardent Mills and Scoular focus on grain supply, whereas Tate & Lyle adds sweetener formulation through European farm programs. Ardent Mills has a broad regenerative acreage base and Scoular operates an earlier customer-backed pilot. Tate & Lyle connects plant-based food development with specialty ingredient support across several customer regions and product categories.
Competitive Benchmarking: Regenerative Agriculture Verified Food Ingredients Market
| Company | Verified Ingredient Traceability | Regenerative Sourcing Programs | Food Formulation Support | Geographic Reach |
|---|---|---|---|---|
| Cargill | High | High | High | Global |
| ADM | Medium | High | High | Global |
| ofi | High | High | High | Global |
| Bunge | High | Medium | Medium | Global |
| Ingredion | High | Medium | High | Global |
| Ardent Mills | Medium | High | High | North America |
| Scoular | Medium | Low | Medium | North America |
| Tate & Lyle | Medium | High | High | Global |
Key Developments in the Regenerative Agriculture Verified Food Ingredients Market
- In December 2025, ofi launched Spice Maps for six priority spices across seven producing countries. The framework sets crop-specific 2030 goals and includes regenerative farming support for Indian chile growers. ofi also reported that 3,000 Cambodian pepper farmers used its direct application for field and crop records. The development gives spice manufacturers a clearer route for connecting origin evidence with customer sourcing requirements.
- In November 2025, Tate & Lyle established a regenerative agriculture program for French corn used in specialty ingredients. The program works with three farming partners and uses Regrow software to monitor several thousand acres. Local agronomists support farm data used for planning and customer reporting across participating French corn farms. The expansion creates a European ingredient route beside established programs in the United States and China.
- In June 2026, Puratos opened a Flour Competence Center in Belgium for flour analysis and application guidance. The center evaluates regenerative flour in finished bakery products and studies ingredients that can stabilize flour quality. Its findings feed into bakery improvers and sourdough or patisserie mixes used in industrial bakery production. The investment helps manufacturers qualify verified wheat while managing changes in protein content and water absorption.
Key Players in the Regenerative Agriculture Verified Food Ingredients Market
Global Crop and Ingredient Companies
- Cargill
- ADM
Integrated Ingredient Companies
- ofi
- Bunge
Specialty and Focused Ingredient Companies
- Ingredion
- Tate & Lyle
- Ardent Mills
- Scoular
Regenerative Agriculture Verified Food Ingredients Market - Report Scope
| Coverage field | Report scope |
|---|---|
| Market breakdown | Product Type, source, application, end user, and region. |
| Quantitative Units | Revenue in USD Million, CAGR in %. |
| Market Definition | Commercial demand for food ingredients carrying verified regenerative agriculture claims or documented farm-program evidence across defined product and end-use categories. |
| Regions Covered | North America, Latin America, Europe, East Asia, South Asia and Pacific, and Middle East and Africa. |
| Countries Covered | United States, Germany, United Kingdom, France, Japan, India, and 30+ countries. |
| Key Companies Profiled | Cargill, ADM, ofi, Bunge, Ingredion, Ardent Mills, Scoular, and Tate & Lyle. |
| Forecast Period | 2026 to 2036. |
| Approach | Hybrid bottom-up and top-down market sizing supported by primary interviews and official desk research. |
Regenerative Agriculture Verified Food Ingredients Market - Research Methodology
| Method | Approach |
|---|---|
| Primary Research | FMI analysts gathered input from manufacturers, service providers, technology developers, distributors, end users, procurement teams, and subject-matter experts. Interviews examined purchasing decisions, product or service evaluation, adoption barriers, approval requirements, pricing considerations, and expectations for technical or commercial support. Respondents were also asked what evidence is required before a trial, pilot, or initial order develops into regular purchasing. |
| Desk Research | Desk research covered government statistics, regulatory publications, trade data, industry associations, technical literature, standards, company filings, product information, and official corporate announcements. Sources were reviewed for relevance, publication date, geographic coverage, and consistency with the defined market scope. Claims relating to performance, applications, approvals, capacity, investment, and commercial activity were retained only when supported by credible public evidence. |
| Market Sizing and Forecasting | The market model combined the baseline value with historical performance, segment structure, pricing and volume indicators, adoption levels, company participation, and country-level demand conditions. Forecast assumptions considered economic activity, investment trends, regulatory developments, technology adoption, purchasing cycles, supply availability, and barriers to wider market use. Segment and regional estimates were reconciled before the final market total was calculated. |
| Data Validation | Estimates were checked against multiple independent indicators, including public data, company activity, trade patterns, industry developments, and findings from primary interviews. Validation also tested whether products, services, applications, and company revenues fell within the defined market boundaries. Adjacent categories, unsupported claims, overlapping revenues, and activities without direct market relevance were excluded to reduce double counting and maintain consistency across segments and countries. |
Regenerative Agriculture Verified Food Ingredients Market by Segments
Regenerative Agriculture Verified Food Ingredients Market Segmented by Product Type:
- Proteins
- Fibers
- Sweeteners
- Cultures
- Flavors
Regenerative Agriculture Verified Food Ingredients Market Segmented by Source:
- Plant
- Microbial
- Dairy Analog
- Upcycled
- Mineral
Regenerative Agriculture Verified Food Ingredients Market Segmented by Application:
- Bakery
- Beverages
- Snacks
- Infant Nutrition
- Ready Meals
Regenerative Agriculture Verified Food Ingredients Market Segmented by End User:
- Food Manufacturers
- Beverage Manufacturers
- Foodservice Operators
- Contract Manufacturers
- Retail Brands
Regenerative Agriculture Verified Food Ingredients Market by Region:
- North America
- United States
- Canada
- Mexico
- Latin America
- Brazil
- Chile
- Rest of Latin America
- Western Europe
- Germany
- UK
- Italy
- Spain
- France
- Nordic
- BENELUX
- Rest of Western Europe
- Eastern Europe
- Russia
- Poland
- Hungary
- Balkan and Baltic
- Rest of Eastern Europe
- East Asia
- China
- Japan
- South Korea
- South Asia and Pacific
- India
- ASEAN
- Australia and New Zealand
- Rest of South Asia and Pacific
- Middle East and Africa
- Kingdom of Saudi Arabia
- Other GCC Countries
- Turkiye
- South Africa
- Other African Union
- Rest of Middle East and Africa
Research Sources and Bibliography
- ADM. (2025, September 8). ADM exceeds 5M regenerative agriculture acreage goal.
- Bunge. (2026, May 11). Bunge Opens New Soy Protein Facility in Morristown, Indiana.
- European Commission. (2021, October 21). Commission Delegated Regulation (EU) 2021/2306 of 21 October 2021 supplementing Regulation (EU) 2018/848 of the European Parliament and of the Council with rules on the official controls in respect of consignments of organic products and in-conversion products intended for import into the Union and on the certificate of inspection.
- Regenerative Organic Alliance. (2026). Regenerative Organic Certified™ 2026 License Renewal Application.
- Bunge. (2025, September 15). Bunge and Bangkok Produce Merchandising expand partnership for blockchain-traced, deforestation-free soy supply.
- Bunge. (2026, June 11). Bunge Releases 2026 Global Sustainability Report.
- Cargill. (2025, July 15). PepsiCo and Cargill collaborate to empower farmers by advancing sustainable agriculture.
- Ardent Mills. (2025, September 9). Ardent Mills releases FY25 ESG report, showcasing progress in community impact, environmental efficiency and inclusive infrastructure.
- Ingredion. (2025, April 29). PureCircle by Ingredion first to achieve Farm Sustainability Assessment Silver performance level for 100% of stevia supply.
- ADM. (2026, July 15). General Mills, ADM, Walmart Partner to Accelerate Regenerative Agriculture Across 40,000 Midwest Wheat Acres.
- ofi. (2025, April 23). Nestlé and ofi launch global agroforestry partnership in largest collaboration yet.
- U.S. Department of Agriculture Agricultural Marketing Service. (2026, June). Labeling requirements for the U.S. organic market.
- Scoular. (2025, October 2). Scoular progresses on regenerative agriculture, other sustainability goals.
- ADM. (2026, May 28). ADM scales Farm Forward Initiative in India with TechnoServe partnership, targeting 15,000 new soybean farmers.
- U.S. Department of Agriculture Agricultural Marketing Service. (2025, September). International trade policies: India.
- U.S. Department of Agriculture Natural Resources Conservation Service. (2025, December 10). USDA launches new regenerative pilot program to lower farmer production costs and advance MAHA agenda.
- U.S. Department of Agriculture Agricultural Marketing Service. (2026, June). Strengthening Organic Enforcement frequently asked questions.
- ADM. (2025, January 23). ADM continues to drive farmer resilience with expansion of re:generations™ program to Germany.
- Danone Ecosystem. (2025, August 8). Soil4Good.
- Ministry of Agriculture, Forestry and Fisheries. (2026, July 1).
- Department for Environment, Food & Rural Affairs. (2026, May 7). Organic farming statistics 2025: United Kingdom.
- ofi. (2025, December 16). ofi launches first spices sustainability strategy as demand for plant-based ingredients accelerates.
- Tate & Lyle. (2025, November 19). Tate & Lyle extends its regenerative agriculture programme into Europe.
- Puratos. (2026, June 16). Puratos opens new research center to tackle flour variability.
This bibliography is provided for reader reference and is not exhaustive. The full report contains the complete reference list and detailed citations
This Report Answers
- How large is the regenerative agriculture verified food ingredients market in 2026 and 2036?
- Which product type options carry the strongest commercial pull and what manufacturer problem do they address?
- How does source influence certification effort and ingredient traceability across processing routes?
- Which application areas convert most readily from limited qualification into repeat ingredient purchasing?
- How do end-user groups compare chain records and formulation support before approving a verified ingredient?
- How do country growth rates differ across India and the United States plus Germany and France alongside Japan and the United Kingdom?
- Which companies combine crop programs with ingredient processing or formulation support across several regions?
- What certification and label controls most affect manufacturer confidence in verified ingredient claims?
- How should food manufacturers compare traceability depth and technical service before expanding a verified sourcing program?
Frequently Asked Questions
How big is the Regenerative Agriculture Verified Food Ingredients Market in 2026?
The regenerative agriculture verified food ingredients market is valued at USD 400.9 million in 2026 and is forecast to reach USD 803.5 million by 2036, driven by customer-backed crop programs connecting verified farm practices with ingredient lots that food manufacturers can approve for recurring commercial formulas.
What is the CAGR of the Regenerative Agriculture Verified Food Ingredients Market from 2026 to 2036?
The regenerative agriculture verified food ingredients market is projected to grow at a CAGR of 7.2% between 2026 and 2036, supported by expanding brand commitments to farm-linked sourcing, federal conservation funding for documented crop programs, and growing demand for claim-ready ingredient documentation across national markets.
Which application leads the Regenerative Agriculture Verified Food Ingredients Market?
Bakery accounts for 24.0% of the regenerative agriculture verified food ingredients market by application in 2026, driven by repeat recipes, predictable flour purchasing across industrial production schedules, and the ability to justify separate verified sourcing records across large production batches and national plants.
Which country is growing fastest in the Regenerative Agriculture Verified Food Ingredients Market?
The regenerative agriculture verified food ingredients market in India is projected to grow at a CAGR of 9.7% through 2036, supported by export-oriented soybean processing, TraceNet transaction records linking certified processors with consignments, and expanding field programs including ADM's Farm Forward initiative targeting 15,000 new soybean farmers across Maharashtra.
Who are the leading companies in the Regenerative Agriculture Verified Food Ingredients Market?
Leading companies in the regenerative agriculture verified food ingredients market include Cargill, ADM, ofi, Bunge, Ingredion, Ardent Mills, Scoular, and Tate & Lyle, spanning global crop origination, traceable cocoa and oilseed supply, specialty ingredient formulation, and North American grain routes for flour and fiber applications.
Preview the report firsthand - request a free sample
Get SampleGet the brochure for pricing and purchase details.
Get PDFTable of Content
- Key Takeaways
- Market Size and CAGR
- Top Growth Driver
- Fastest Growing Segment
- Leading Region
- Key Companies
- Emerging Opportunities
- Executive Summary
- Global Market Outlook
- Demand-side Trends
- Supply-side Trends
- Technology Roadmap Analysis
- Analysis and Recommendations
- Analyst Perspective (What is happening? Why now? What should investors know?)
- Key Questions Answered
- How large is the market?
- What is the CAGR?
- What are key trends?
- Which region dominates?
- Who are the leaders?
- Market Overview
- Market Coverage / Taxonomy
- Market Definition / Scope / Limitations
- Research Methodology
- Chapter Orientation
- Analytical Lens and Working Hypotheses
- Market Structure, Signals, and Trend Drivers
- Benchmarking and Cross-market Comparability
- Market Sizing, Forecasting, and Opportunity Mapping
- Research Design and Evidence Framework
- Desk Research Programme (Secondary Evidence)
- Expert Input and Fieldwork (Primary Evidence)
- Tooling, Models, and Reference Databases
- Data Engineering and Model Build
- Quality Assurance and Audit Trail
- Market Background
- Market Dynamics (Drivers, Restraints, Opportunity, Trends)
- Scenario Forecast (Optimistic, Likely, Conservative)
- Impact Analysis
- AI Impact
- Sustainability Impact
- Regulatory Impact
- Technology Impact
- Consumer / Buyer Analysis
- Purchase Drivers
- Adoption Barriers
- Buyer Journey
- Opportunity Map Analysis
- Product Life Cycle Analysis
- Supply Chain Analysis
- Investment Feasibility Matrix
- Value Chain Analysis
- PESTLE and Porter's Analysis
- Regulatory Landscape
- Regional Parent Market Outlook
- Production and Consumption Statistics
- Import and Export Statistics
- Global Market Analysis and Forecast, 2021 to 2036
- Historical Market Size Value (USD Million) Analysis, 2021 to 2025
- Current and Future Market Size Value (USD Million) Projections, 2026 to 2036
- Y-o-Y Growth Trend Analysis
- Absolute $ Opportunity Analysis
- Global Market Pricing Analysis, 2021 to 2036
- Global Market Analysis and Forecast, By Product Type, 2021 to 2036
- Introduction / Key Findings
- Historical Market Size Value (USD Million) Analysis By Product Type, 2021 to 2025
- Current and Future Market Size Value (USD Million) Analysis and Forecast By Product Type, 2026 to 2036
- Proteins
- Fibers
- Sweeteners
- Cultures
- Flavors
- Proteins
- Y-o-Y Growth Trend Analysis By Product Type, 2021 to 2025
- Absolute $ Opportunity Analysis By Product Type, 2026 to 2036
- Global Market Analysis and Forecast, By Source, 2021 to 2036
- Introduction / Key Findings
- Historical Market Size Value (USD Million) Analysis By Source, 2021 to 2025
- Current and Future Market Size Value (USD Million) Analysis and Forecast By Source, 2026 to 2036
- Plant
- Microbial
- Dairy Analog
- Upcycled
- Mineral
- Plant
- Y-o-Y Growth Trend Analysis By Source, 2021 to 2025
- Absolute $ Opportunity Analysis By Source, 2026 to 2036
- Global Market Analysis and Forecast, By Application, 2021 to 2036
- Introduction / Key Findings
- Historical Market Size Value (USD Million) Analysis By Application, 2021 to 2025
- Current and Future Market Size Value (USD Million) Analysis and Forecast By Application, 2026 to 2036
- Bakery
- Beverages
- Snacks
- Infant Nutrition
- Ready Meals
- Bakery
- Y-o-Y Growth Trend Analysis By Application, 2021 to 2025
- Absolute $ Opportunity Analysis By Application, 2026 to 2036
- Global Market Analysis and Forecast, By End User, 2021 to 2036
- Introduction / Key Findings
- Historical Market Size Value (USD Million) Analysis By End User, 2021 to 2025
- Current and Future Market Size Value (USD Million) Analysis and Forecast By End User, 2026 to 2036
- Food Manufacturers
- Ingredient Blenders
- Private Label
- Foodservice
- Nutraceutical Brands
- Food Manufacturers
- Y-o-Y Growth Trend Analysis By End User, 2021 to 2025
- Absolute $ Opportunity Analysis By End User, 2026 to 2036
- Global Market Analysis and Forecast, By Region, 2021 to 2036
- Introduction
- Historical Market Size Value (USD Million) Analysis By Region, 2021 to 2025
- Current Market Size Value (USD Million) Analysis and Forecast By Region, 2026 to 2036
- North America
- Latin America
- Western Europe
- Eastern Europe
- East Asia
- South Asia and Pacific
- Middle East & Africa
- Market Attractiveness Analysis By Region
- North America Market Analysis and Forecast, By Country, 2021 to 2036
- Historical Market Size Value (USD Million) Trend Analysis By Market Taxonomy, 2021 to 2025
- Market Size Value (USD Million) Forecast By Market Taxonomy, 2026 to 2036
- By Country
- USA
- Canada
- By Product Type
- By Source
- By Application
- By End User
- By Country
- Market Attractiveness Analysis
- By Country
- By Product Type
- By Source
- By Application
- By End User
- Key Takeaways
- Latin America Market Analysis and Forecast, By Country
- Historical Market Size Value (USD Million) Trend Analysis By Market Taxonomy, 2021 to 2025
- Market Size Value (USD Million) Forecast By Market Taxonomy, 2026 to 2036
- By Country
- Brazil
- Mexico
- Chile
- Rest of Latin America
- By Product Type
- By Source
- By Application
- By End User
- By Country
- Market Attractiveness Analysis
- By Country
- By Product Type
- By Source
- By Application
- By End User
- Key Takeaways
- Western Europe Market Analysis and Forecast, By Country
- Historical Market Size Value (USD Million) Trend Analysis By Market Taxonomy, 2021 to 2025
- Market Size Value (USD Million) Forecast By Market Taxonomy, 2026 to 2036
- By Country
- Germany
- UK
- Italy
- Spain
- France
- Nordic
- BENELUX
- Rest of Western Europe
- By Product Type
- By Source
- By Application
- By End User
- By Country
- Market Attractiveness Analysis
- By Country
- By Product Type
- By Source
- By Application
- By End User
- Key Takeaways
- Eastern Europe Market Analysis and Forecast, By Country
- Historical Market Size Value (USD Million) Trend Analysis By Market Taxonomy, 2021 to 2025
- Market Size Value (USD Million) Forecast By Market Taxonomy, 2026 to 2036
- By Country
- Russia
- Poland
- Hungary
- Balkan & Baltic
- Rest of Eastern Europe
- By Product Type
- By Source
- By Application
- By End User
- By Country
- Market Attractiveness Analysis
- By Country
- By Product Type
- By Source
- By Application
- By End User
- Key Takeaways
- East Asia Market Analysis and Forecast, By Country
- Historical Market Size Value (USD Million) Trend Analysis By Market Taxonomy, 2021 to 2025
- Market Size Value (USD Million) Forecast By Market Taxonomy, 2026 to 2036
- By Country
- China
- Japan
- South Korea
- By Product Type
- By Source
- By Application
- By End User
- By Country
- Market Attractiveness Analysis
- By Country
- By Product Type
- By Source
- By Application
- By End User
- Key Takeaways
- South Asia and Pacific Market Analysis and Forecast, By Country
- Historical Market Size Value (USD Million) Trend Analysis By Market Taxonomy, 2021 to 2025
- Market Size Value (USD Million) Forecast By Market Taxonomy, 2026 to 2036
- By Country
- India
- ASEAN
- Australia & New Zealand
- Rest of South Asia and Pacific
- By Product Type
- By Source
- By Application
- By End User
- By Country
- Market Attractiveness Analysis
- By Country
- By Product Type
- By Source
- By Application
- By End User
- Key Takeaways
- Middle East & Africa Market Analysis and Forecast, By Country
- Historical Market Size Value (USD Million) Trend Analysis By Market Taxonomy, 2021 to 2025
- Market Size Value (USD Million) Forecast By Market Taxonomy, 2026 to 2036
- By Country
- Kingdom of Saudi Arabia
- Other GCC Countries
- Türkiye
- South Africa
- Other African Union
- Rest of Middle East & Africa
- By Product Type
- By Source
- By Application
- By End User
- By Country
- Market Attractiveness Analysis
- By Country
- By Product Type
- By Source
- By Application
- By End User
- Key Takeaways
- Key Countries Market Analysis
- USA
- Pricing Analysis
- Market Share Analysis, 2025
- By Product Type
- By Source
- By Application
- By End User
- Canada
- Pricing Analysis
- Market Share Analysis, 2025
- By Product Type
- By Source
- By Application
- By End User
- Mexico
- Pricing Analysis
- Market Share Analysis, 2025
- By Product Type
- By Source
- By Application
- By End User
- Brazil
- Pricing Analysis
- Market Share Analysis, 2025
- By Product Type
- By Source
- By Application
- By End User
- Chile
- Pricing Analysis
- Market Share Analysis, 2025
- By Product Type
- By Source
- By Application
- By End User
- Germany
- Pricing Analysis
- Market Share Analysis, 2025
- By Product Type
- By Source
- By Application
- By End User
- UK
- Pricing Analysis
- Market Share Analysis, 2025
- By Product Type
- By Source
- By Application
- By End User
- Italy
- Pricing Analysis
- Market Share Analysis, 2025
- By Product Type
- By Source
- By Application
- By End User
- Spain
- Pricing Analysis
- Market Share Analysis, 2025
- By Product Type
- By Source
- By Application
- By End User
- France
- Pricing Analysis
- Market Share Analysis, 2025
- By Product Type
- By Source
- By Application
- By End User
- India
- Pricing Analysis
- Market Share Analysis, 2025
- By Product Type
- By Source
- By Application
- By End User
- ASEAN
- Pricing Analysis
- Market Share Analysis, 2025
- By Product Type
- By Source
- By Application
- By End User
- Australia & New Zealand
- Pricing Analysis
- Market Share Analysis, 2025
- By Product Type
- By Source
- By Application
- By End User
- China
- Pricing Analysis
- Market Share Analysis, 2025
- By Product Type
- By Source
- By Application
- By End User
- Japan
- Pricing Analysis
- Market Share Analysis, 2025
- By Product Type
- By Source
- By Application
- By End User
- South Korea
- Pricing Analysis
- Market Share Analysis, 2025
- By Product Type
- By Source
- By Application
- By End User
- Russia
- Pricing Analysis
- Market Share Analysis, 2025
- By Product Type
- By Source
- By Application
- By End User
- Poland
- Pricing Analysis
- Market Share Analysis, 2025
- By Product Type
- By Source
- By Application
- By End User
- Hungary
- Pricing Analysis
- Market Share Analysis, 2025
- By Product Type
- By Source
- By Application
- By End User
- Kingdom of Saudi Arabia
- Pricing Analysis
- Market Share Analysis, 2025
- By Product Type
- By Source
- By Application
- By End User
- Türkiye
- Pricing Analysis
- Market Share Analysis, 2025
- By Product Type
- By Source
- By Application
- By End User
- South Africa
- Pricing Analysis
- Market Share Analysis, 2025
- By Product Type
- By Source
- By Application
- By End User
- USA
- Market Structure Analysis
- Competition Dashboard
- Competition Benchmarking
- Market Share Analysis of Top Players
- By Regional
- By Product Type
- By Source
- By Application
- By End User
- Emerging Startups
- Innovation Benchmarking
- Competition Analysis
- Competition Deep Dive
- Cargill
- Overview
- Product Portfolio
- Profitability by Market Segments
- Sales Footprint
- Strategy Overview
- Marketing Strategy
- Product Strategy
- Channel Strategy
- ADM
- Olam Food Ingredients
- Bunge
- Ingredion
- ofi
- Ardent Mills
- Scoular
- Cargill
- Case Studies
- Success Stories
- Recent Developments
- Competition Deep Dive
- Assumptions & Acronyms Used


