Resveratrol Enriched Formulas Market Size and Share Forecast Outlook 2025 to 2035

A valuation of USD 1,120.3 million is anticipated for the Resveratrol Enriched Formulas Market in 2025, which is forecasted to advance steadily to USD 3,403.2 million by 2035. This rise reflects an absolute gain of over USD 2.28 billion across the decade, translating into a robust CAGR of 11.8%. The trajectory indicates a market expansion nearly tripling in size, driven by the growing integration of resveratrol into anti-aging, antioxidant, and repair-focused solutions.
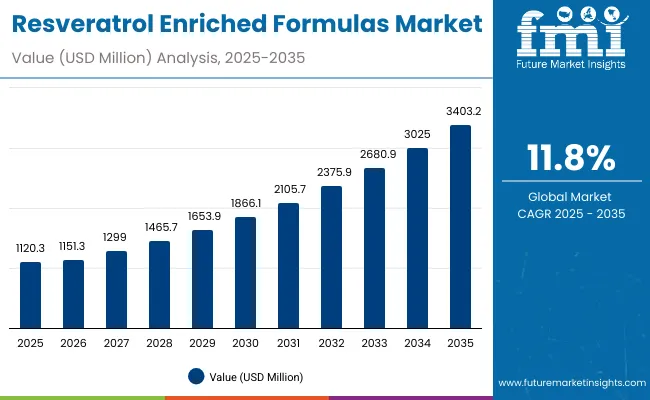
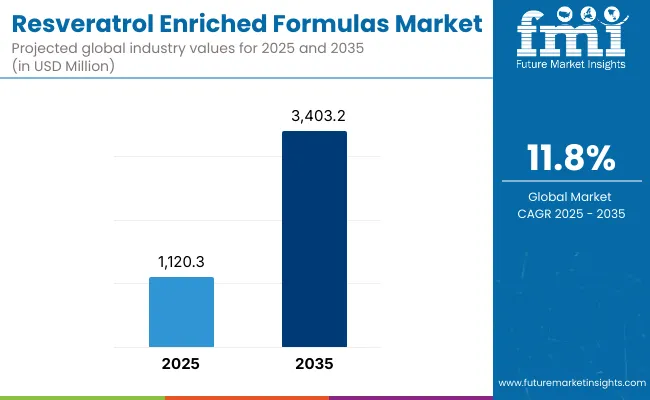
Resveratrol Enriched Formulas Market Value Analysis

Quick Stats for Resveratrol Enriched Formulas Market

  • Market Value (2025): USD 1,120.3 Million
  • Market Forecast Value (2035): USD 3,403.2 Million
  • Market Forecast CAGR (2025 to 2035): 11.8%
  • Leading Segment in 2025: Anti-aging Applications (54.5%)
  • Key Growth Regions: Asia-Pacific, North America, Europe
  • Top Key Players: DSM-Firmenich, BASF, Lonza, Givaudan, Croda, Evolva, Ashland, Sabinsa, Resvantage, Sabre Pharma

Resveratrol Enriched Formulas Market

Resveratrol Enriched Formulas Market Key Takeaways

Metric Value
Resveratrol Enriched Formulas Market Estimated Value In (2025e) USD 1,120.3 Million
Resveratrol Enriched Formulas Market Forecast Value In (2035f) USD 3,403.2 Million
Forecast CAGR (2025 to 2035) 11.80%

During the initial five years from 2025 to 2030, the market is expected to add approximately USD 746 million, moving from USD 1.12 billion to USD 1.87 billion. This stage will be shaped by product adoption across global skincare, nutricosmetics, and wellness platforms as consumer awareness of clinical efficacy strengthens. The segment leadership of anti-aging formulas, accounting for over 54.5% share in 2025, will reinforce this period of growth.

The second half of the forecast window, 2030 to 2035, is projected to contribute more than USD 1.53 billion in absolute value growth, equal to nearly two-thirds of the decade’s overall expansion. The market is expected to climb from USD 1.87 billion to over USD 3.40 billion within this interval.

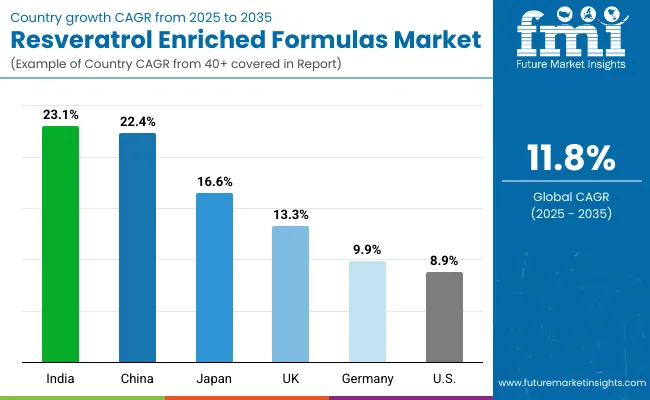
This acceleration will be driven by greater penetration in Asia-Pacific, where India, China, and Japan are forecasted to record the highest CAGRs of 23.1%, 22.4%, and 16.6% respectively. With evolving consumer preference for clean-label, plant-derived, and fermentation-based actives, sourcing diversification will further consolidate momentum. The outlook positions resveratrol-enriched formulas as a central ingredient category in advanced beauty and wellness ecosystems over the decade.

From 2020 to 2024, the Resveratrol Enriched Formulas Market steadily expanded, driven by rising consumer demand for anti-aging and wellness solutions. In 2025, market valuation is projected at USD 1,120.3 Million, with the revenue mix expected to evolve as clinical substantiation and digital-first distribution models gain traction.

By 2035, the market is forecasted to reach USD 3,403.2 Million, with software-like subscription models and clean-label positioning anticipated to increase recurring value streams. Competitive advantage is expected to move beyond ingredient sourcing to ecosystem strength, including regulatory alignment, consumer trust, and innovation in delivery formats.

Why the Resveratrol Enriched Formulas Market is growing?

Growth in the Resveratrol Enriched Formulas Market is being fueled by rising consumer preference for science-backed anti-aging and antioxidant solutions. Demand has been stimulated by expanding awareness of resveratrol’s role in cellular protection, wrinkle reduction, and skin-firmness enhancement. Clinical validations are increasingly being emphasized, leading to stronger adoption across beauty, wellness, and nutricosmetic platforms. The shift toward clean-label, natural, and plant-derived actives has encouraged wider acceptance of grape-derived and knotweed-based resveratrol, while fermentation-derived alternatives are being positioned to ensure supply stability and purity.

Digital channels and direct-to-consumer strategies are enabling rapid education and product discovery, particularly in emerging Asian markets where double-digit growth rates are anticipated. Premiumization is expected to be supported by higher willingness to pay for clinically proven outcomes, while regulatory advancements are pushing for standardization and quality assurance. Collectively, these factors are expected to reinforce sustained double-digit CAGR, with Asia-Pacific driving the strongest contribution to global expansion.

Segmental Analysis

The Resveratrol Enriched Formulas Market is segmented across application, product type, and source, each contributing distinct growth drivers. These segments are shaping the industry’s competitive direction, enabling targeted innovation and differentiated product strategies. Insights into these categories reveal how consumer priorities, scientific validations, and sourcing advancements are influencing demand trajectories.

Application trends highlight anti-aging as the core growth catalyst, while product type analysis underscores the importance of formats that ensure efficacy and user convenience. Source analysis emphasizes how supply diversification is strengthening reliability and addressing sustainability needs. Each segment is forecasted to undergo dynamic shifts over the decade, driven by evolving consumer awareness, enhanced clinical substantiation, and expansion across digital and premium retail ecosystems.
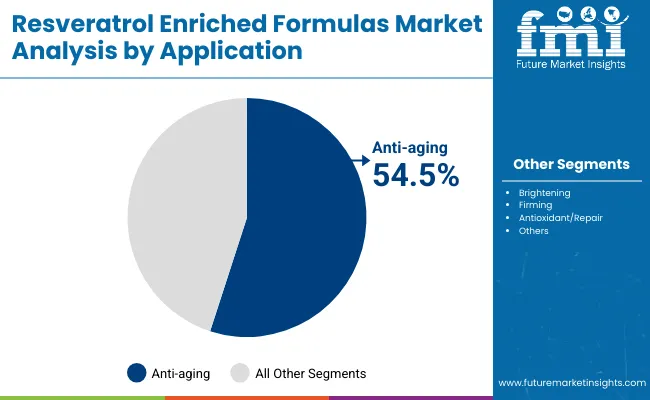
Insights into the Application Segment with Anti-aging Leading Market Share

Resveratrol Enriched Formulas Market By Application

Segment Market Value Share, 2025
Anti-aging 54.5%
Others 45.6%

The anti-aging segment is expected to remain the dominant application area within the Resveratrol Enriched Formulas Market, contributing 54.5% of total revenues in 2025. This dominance is being reinforced by rising demand for wrinkle-reduction, skin-firming, and cellular-repair claims that align with long-term consumer priorities. Products positioned with strong clinical substantiation are projected to secure greater adoption across premium and masstige tiers.

While antioxidant and repair-oriented products represent a significant share, the anti-aging positioning is anticipated to provide higher resilience against market fluctuations due to its strong association with visible outcomes. Over the forecast horizon, increased R&D investments and consumer trust in proven efficacy are expected to ensure that anti-aging remains the anchor segment for resveratrol-based innovations.
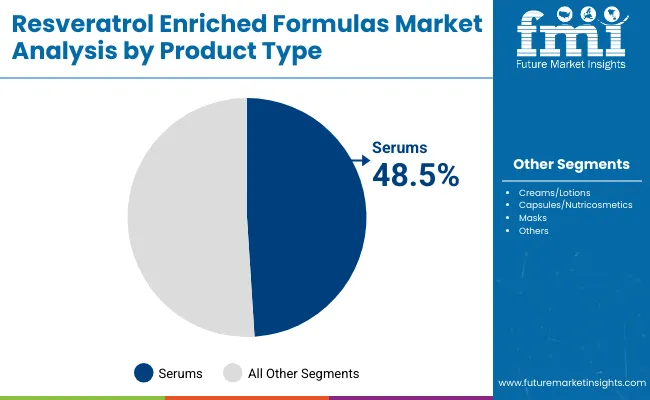
Insights into the Product Type Segment with Serums Driving Adoption

Resveratrol Enriched Formulas Market By Product Type

Segment Market Value Share, 2025
Serums 48.5%
Others 51.5%

The serum segment is projected to capture 48.5% of market revenues in 2025, driven by its role as a preferred delivery format for resveratrol actives. High concentration levels, better skin penetration, and perceived efficacy are reinforcing the appeal of serums among consumers seeking visible results. Premium positioning in e-commerce and specialty retail channels is expected to sustain growth momentum for this format.

While creams, capsules, and other categories contribute slightly higher cumulative value, the importance of serums lies in their ability to influence brand perception and consumer trust. With increasing consumer education on active formulations and multifunctional claims, serums are anticipated to consolidate their share as the benchmark product type within resveratrol-enriched skincare lines.
Insights into the Product Type Segment with Serums Driving Adoption

Resveratrol Enriched Formulas Market By Source

Segment Market Value Share, 2025
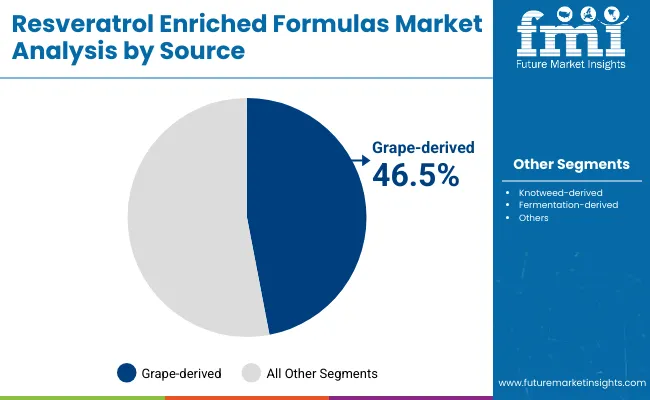
Grape-derived 46.5%
Others 53.5%

The grape-derived resveratrol segment is estimated to hold 46.5% share in 2025, reflecting its strong natural positioning and alignment with clean-label preferences. Consumer trust in grape-origin actives has supported steady adoption, particularly in premium skincare and nutricosmetics. However, growing concerns around supply volatility and rising emphasis on sustainable sourcing are expected to drive expansion of alternatives such as knotweed and fermentation-derived resveratrol.

While others collectively account for a higher share at 53.5%, grape-derived inputs are forecasted to maintain symbolic importance due to heritage associations and authenticity narratives. Over the forecast period, companies are expected to balance grape-derived credibility with scalable alternatives, ensuring that sourcing diversification supports both stability and consumer confidence.

What are the Drivers, Restraints, and Key Trends of the Resveratrol Enriched Formulas Market?

The Resveratrol Enriched Formulas Market is advancing on the back of evolving consumer behaviors, scientific validations, and sourcing transformations. However, the trajectory is also shaped by structural challenges that influence pricing, accessibility, and strategic execution across regions.

Scientific substantiation and clinical validation

Market growth is being reinforced by the expanding emphasis on clinical substantiation of resveratrol’s anti-aging and cellular repair properties. Brands are increasingly required to demonstrate efficacy through peer-reviewed trials and dermatological testing to secure consumer trust and regulatory clearance.

Evidence-backed formulations are positioned to gain wider acceptance, particularly in premium and masstige categories where willingness to pay is directly linked to proven outcomes. Over the forecast period, the role of validated claims is expected to deepen, strengthening brand differentiation and providing long-term resilience against commoditization risks.

Restraint - Raw material volatility and supply chain fragility

Growth potential is being constrained by volatility in raw material sourcing, particularly for grape-derived resveratrol. Climate variability, agricultural yield instability, and supply chain bottlenecks are exerting pressure on procurement consistency and cost structures. These challenges are magnified by rising demand for clean-label ingredients, which increases pressure on reliable sourcing at scale.

Companies are expected to diversify supply through knotweed and fermentation-based alternatives; however, scalability, quality parity, and consumer acceptance remain hurdles. Such structural pressures could temper growth in certain geographies, emphasizing the importance of risk-hedged sourcing strategies and long-term supplier partnerships.
Analysis of Resveratrol Enriched Formulas Market By Key Countries

Resveratrol Enriched Formulas Market Country Wise Analysis

Country CAGR
China 22.4%
USA 8.9%
India 23.1%
UK 13.3%
Germany 9.9%
Japan 16.6%

The Resveratrol Enriched Formulas Market demonstrates clear variations in growth dynamics across major economies, influenced by consumer awareness, regulatory environments, and innovation adoption. Asia-Pacific is projected to deliver the strongest performance, with India and China recording remarkable CAGRs of 23.1% and 22.4% respectively. India’s surge is being supported by a digitally native consumer base, rapid e-commerce expansion, and rising adoption of clean-label nutricosmetics.

China’s momentum is anchored by its social commerce ecosystem, high demand for nutricosmetics, and regulatory tightening that strengthens trust in clinically validated claims. Japan, with a 16.6% CAGR, reflects steady integration of resveratrol in anti-aging and functional wellness portfolios, supported by an aging population with high spending capacity.

In Europe, growth is robust though comparatively moderate. The United Kingdom is forecasted to expand at 13.3% CAGR, driven by premium skincare positioning and pharmacy-led adoption, while Germany’s 9.9% CAGR reflects stability in a mature but innovation-sensitive market.

North America shows a slower pace, with the United States projected at 8.9% CAGR, underpinned by premium product adoption and clinical substantiation but tempered by market maturity. Overall, Asia-Pacific is expected to outpace other regions, reshaping the global balance of the resveratrol market and consolidating leadership through digital-first strategies and sourcing innovations.
Sales Outlook for Resveratrol Enriched Formulas in the United States

Usa Resveratrol Enriched Formulas Market

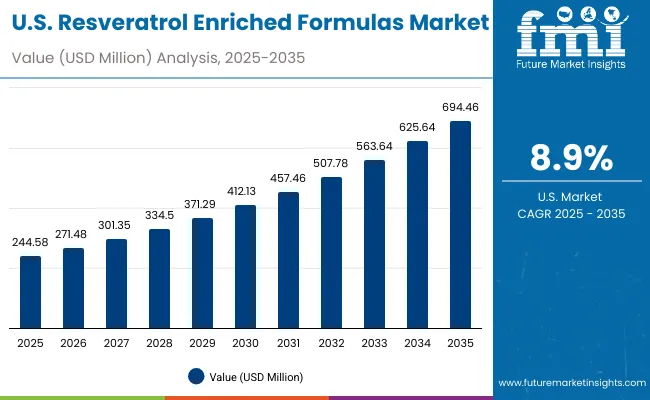
Year USA Resveratrol Enriched Formulas Market (USD Million)
2025 244.58
2026 271.48
2027 301.35
2028 334.50
2029 371.29
2030 412.13
2031 457.46
2032 507.78
2033 563.64
2034 625.64
2035 694.46

A CAGR of 8.9% has been projected for the United States, reflecting steady expansion in a mature but innovation-driven market. Market value is expected to rise from USD 244.58 million in 2025 to USD 694.46 million by 2035, supported by premium adoption and scientific substantiation. Clinical validation remains a key growth catalyst, reinforcing consumer confidence in anti-aging and antioxidant benefits.

Specialty retail and pharmacy channels will anchor trust, while e-commerce and direct-to-consumer models are broadening accessibility and brand discovery. Premium and masstige tiers are expected to consolidate their leadership, supported by consumer willingness to pay for efficacy-driven products. The USA contribution will remain vital to global revenues, though relative growth will be outpaced by Asia-Pacific markets.

  • Anti-aging products continue to dominate adoption patterns.
  • Specialty retail and pharmacies provide credibility.
  • E-commerce enhances consumer reach and education.
  • Premiumization supports resilience against commoditization.

Growth and Expansion Outlook for Resveratrol Enriched Formulas Market in the United Kingdom

A CAGR of 13.3% has been projected for the United Kingdom, supported by consumer demand for clinically validated skincare and wellness formulations. Market expansion will be driven by premium positioning in anti-aging and repair categories, supported by pharmacy-led retail and growing e-commerce channels.

Digital engagement, particularly influencer-driven awareness campaigns, is creating greater resonance with younger consumers seeking science-backed solutions. Premiumization is expected to sustain growth despite cost pressures, as evidence-based branding enhances consumer willingness to pay. The UK’s contribution will remain vital within Europe, ensuring stable revenue progression through a balance of traditional pharmacy trust and modern digital ecosystems.

  • Pharmacy retail remains the backbone of consumer trust.
  • E-commerce and influencer campaigns are expanding reach.
  • Premium categories retain resilience due to efficacy focus.
  • Mass-market growth is tempered by pricing sensitivity.

Growth and Expansion Outlook for Resveratrol Enriched Formulas Market in India

A CAGR of 23.1% has been forecasted for India, marking it as the fastest-growing country market globally. Growth is underpinned by rapid digital penetration, strong preventive skincare awareness, and rising disposable income. Direct-to-consumer channels are shaping affordability and transparency, while premium skincare categories gain traction in metro cities through global and domestic brand activity.

The young demographic and growing middle class are reinforcing adoption of nutricosmetics and resveratrol-based wellness formulations. Localization of formulations and culturally tailored campaigns are expected to accelerate adoption further, positioning India as a transformative market for resveratrol innovations.
  • Direct-to-consumer models are enabling affordable access.
  • Preventive skincare narratives are fueling early adoption.
  • Premium growth is concentrated in metropolitan clusters.
  • Localized products are enhancing cultural acceptance.

Sales Outlook for Resveratrol Enriched Formulas in China

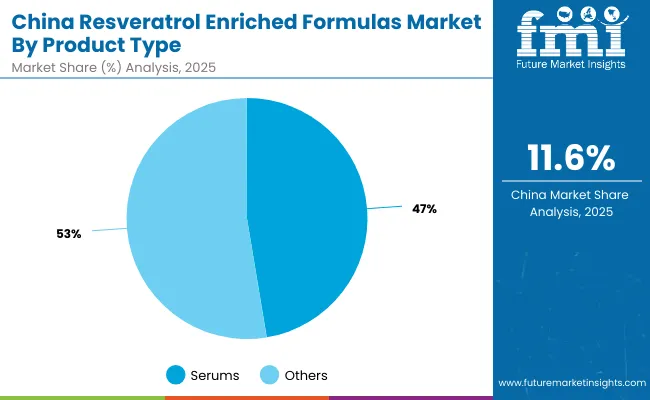
China Resveratrol Enriched Formulas Market By Product Type

A CAGR of 22.4% has been projected for China, consolidating its position as one of the most dynamic growth engines worldwide. Adoption is being accelerated by beauty-from-within narratives, with nutricosmetics and serums leading value creation. Social commerce ecosystems, particularly influencer-driven platforms, are reshaping brand-consumer engagement.

Regulatory reforms mandating stronger claim validation and transparency are expected to reinforce trust in clinically supported products, favoring established and science-led players. Urban centers will dominate premium demand, while mass growth will expand through e-commerce penetration in lower-tier cities. China’s role in shaping global resveratrol demand will continue to strengthen, making it a pivotal growth hub.
  • Serums dominate as the preferred product type.
  • Social commerce drives consumer engagement and trust.
  • Regulatory tightening is enhancing clinical transparency.
  • Tiered urban growth sustains premium adoption.

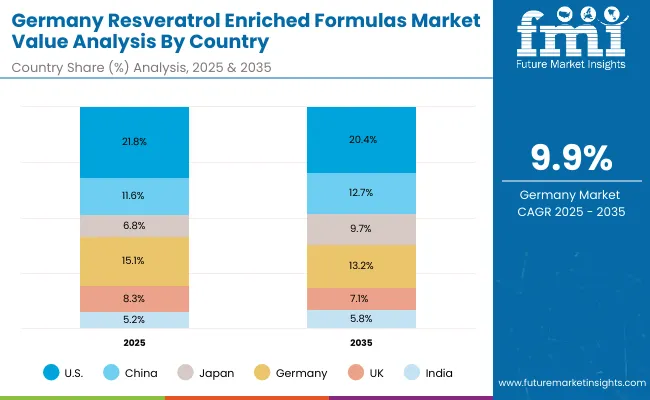
In-depth Analysis of Resveratrol Enriched Formulas in Germany

Germany Resveratrol Enriched Formulas Market

Countries 2025
USA 21.8%
China 11.6%
Japan 6.8%
Germany 15.1%
UK 8.3%
India 5.2%
Countries 2035
USA 20.4%
China 12.7%
Japan 9.7%
Germany 13.2%
UK 7.1%
India 5.8%

A CAGR of 9.9% has been projected for Germany, reflecting steady growth in a mature but innovation-driven market. Clinical substantiation remains central, ensuring that pharmacy and specialty retail channels anchor adoption. Anti-aging and repair-oriented formulations are expected to remain the largest contributors, as German consumers prioritize efficacy and dermatological credibility.

Sustainability narratives and clean-label preferences are shaping sourcing choices, with fermentation-derived resveratrol anticipated to gain traction for its stability and scalability. While competition intensifies, established players with strong dermatological partnerships are forecasted to retain leadership. Germany’s contribution will remain essential within Europe, offering stability, regulatory rigor, and quality benchmarks.

  • Pharmacy-led retail provides credibility in consumer choices.
  • Clean-label sourcing trends influence product positioning.
  • Fermentation-derived resveratrol gains traction for reliability.
  • Clinical substantiation ensures sustained premium demand.

Growth Outlook for Resveratrol Enriched Formulas Market in Japan

Segment Market Value Share, 2025
Serums 47.40%
Others 52.60%

The Resveratrol Enriched Formulas Market in Japan is projected to be valued at approximately USD 76.8 million in 2025, based on its 6.8% share of the global market. Within applications, anti-aging dominates with 54.5% share, reflecting strong consumer prioritization of wrinkle reduction, skin elasticity, and repair-focused formulations. The other category, contributing 45.5%, highlights multifunctional positioning such as antioxidant and brightening claims, which are also gaining steady traction. This balance demonstrates Japan’s inclination toward clinically validated, results-driven products where visible efficacy determines long-term adoption.

The prominence of anti-aging is being reinforced by Japan’s rapidly aging population, which maintains higher willingness to invest in functional skincare. Demand is further amplified by cultural emphasis on preventative beauty regimens and premium skincare rituals. With strong alignment toward science-led solutions, clinical substantiation, and dermatological partnerships, Japan is expected to record sustained momentum through 2035 at a CAGR of 16.6%.

  • Japan holds 6.8% global share in 2025 (~USD 76.8 Million).
  • Anti-aging leads with 54.5% share of applications.
  • Growing elderly population sustains premium adoption.
  • Preventive beauty culture reinforces long-term demand trajectory.

Opportunity Analysis of South Korea Resveratrol Enriched Formulas Market

Segment Market Value Share, 2025
Anti-aging 54.50%
Others 45.50%

The Resveratrol Enriched Formulas Market in South Korea is projected to be valued at approximately USD 55.9 million in 2025, based on its estimated 5% share of global revenues. Anti-aging is expected to dominate with 54.5% share, reflecting the country’s strong cultural emphasis on skin youthfulness, elasticity, and wrinkle reduction. Other applications, contributing 45.5%, highlight multifunctional positioning such as antioxidant repair and brightening benefits, which are also gaining traction in K-beauty portfolios.

Market growth is expected to be reinforced by South Korea’s reputation as a global beauty innovation hub. Rapid product launches, advanced formulations, and integration of resveratrol into both topical and nutricosmetic formats are anticipated to strengthen adoption. E-commerce platforms, coupled with global K-beauty influence, are projected to amplify exports, expanding South Korea’s role beyond domestic consumption. The market is forecasted to grow steadily at a double-digit pace, making South Korea a key contributor to Asia’s overall leadership in resveratrol adoption.
  • South Korea accounts for ~5% of global share in 2025 (~USD 55.9 Million).
  • Anti-aging dominates with 54.5% application share.
  • K-beauty innovation accelerates domestic and export demand.
  • E-commerce platforms amplify consumer reach and global presence.

Competitive Landscape of Resveratrol Enriched Formulas Market

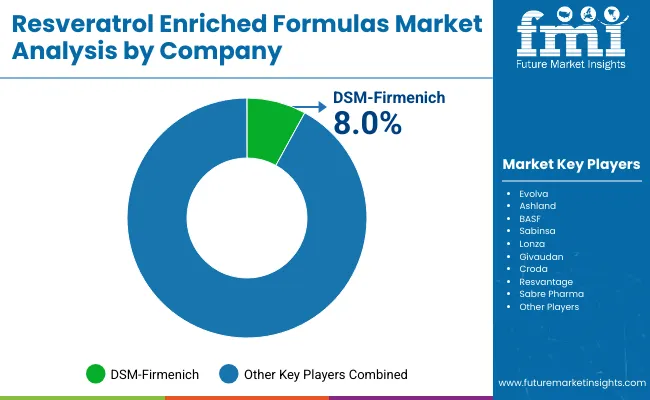
Resveratrol Enriched Formulas Market By Company

Companies Global Value Share 2025
DSM-Firmenich 8.00%
Others 92.00%

The Resveratrol Enriched Formulas Market is moderately fragmented, with global leaders, established mid-sized innovators, and specialized providers competing for share across applications such as anti-aging, antioxidant repair, and nutricosmetics. Global ingredient and fragrance majors such as DSM-Firmenich, BASF, Lonza, Givaudan, and Croda are recognized as dominant players, leveraging strong R&D capabilities, wide ingredient portfolios, and global distribution networks. Their strategies are increasingly focused on sustainable sourcing, fermentation-based resveratrol production, and clinical substantiation to meet regulatory and consumer expectations.

Mid-sized innovators such as Evolva, Ashland, Sabinsa, and Resvantage are expanding their footprints by delivering niche applications, clean-label solutions, and targeted formulations, particularly in serums and nutricosmetic categories. Their strengths lie in agility, partnerships with beauty brands, and faster adaptation to regional consumer preferences.

Specialized providers such as Sabre Pharma are focused on pharmaceutical and nutraceutical applications, emphasizing high-purity resveratrol formats tailored to health-focused formulations. These players often succeed through focused expertise and regional adaptability rather than global scale.

Competitive differentiation is expected to shift further from pure sourcing toward integrated positioning that combines clinical validation, sustainability narratives, and digital-first brand partnerships. This evolution will reward companies that balance innovation with compliance and consumer trust.

  • DSM-Firmenich is the leading company, holding around 8% global market share in 2024.
  • All listed companies (Evolva, DSM-Firmenich, Ashland, BASF, Sabinsa, Lonza, Givaudan, Croda, Resvantage, Sabre Pharma) are relevant players in the Resveratrol Enriched Formulas Market.
  • Market dominance remains with DSM-Firmenich due to its scale, R&D leadership, and integrated supply capabilities.

Key Developments in Resveratrol Enriched Formulas Market

  • In July 2025, the European Commission’s novel food framework has been amended to expand authorized use of transresveratrol, enabling wider incorporation into cosmetic and dietary formats within the EU-an important shift toward regulatory clarity and market expansion for highpurity resveratrol ingredients.
  • In July 2025, a marked surge in consumer searches for “resveratrol 500 mg supplement” was observed, reflecting a growing demand for standardized highdosage formulations and evidencing shifting consumer priorities toward precise dosing and transparency in ingredient potency.

Scope of the Report

Item Value
Market Size, 2025 USD 1,120.3 Million
Market Size, 2035 USD 3,403.2 Million
Absolute Growth (2025 to 2035) USD 2,282.9 Million
CAGR (2025 to 2035) 11.80%
Value Added 2025 to 2030 USD 745.8 Million
Value Added 2030 to 2035 USD 1,537.1 Million
Applications (2025) Anti-aging: USD 598.5 Million (54.5%); Others: USD 510.3 Million (45.6%)
Product Type (2025) Serums: USD 533.6 Million (48.5%); Others: USD 576.8 Million (51.5%)
Source (2025) Grape-derived: USD 511.8 Million (46.5%); Others: USD 599.0 Million (53.5%)
Channels E-commerce, Specialty Beauty Retail, Pharmacies, D2C
Growth Hotspots (CAGR) India 23.1%; China 22.4%; Japan 16.6%; UK 13.3%; Germany 9.9%; USA 8.9%
Regions Covered North America, Europe, East Asia, South Asia & Pacific, Latin America, Middle East & Africa
Countries Covered United States, China, India, Japan, United Kingdom, Germany, others in Europe, Asia-Pacific, Latin America, Middle East & Africa
Key Companies Profiled DSM-Firmenich, BASF, Lonza, Givaudan, Croda, Evolva, Ashland, Sabinsa, Resvantage, Sabre Pharma
Additional Attributes Evidence-backed claims, clean-label focus, fermentation scale-up, and digital distribution strategies are shaping market e xpansion.

Key Segments

By Source:

  • Grape-derived
  • Knotweed-derived
  • Fermentation-derived

By Application:

  • Anti-aging
  • Brightening
  • Firming
  • Antioxidant/repair

By Product Type:

  • Serums
  • Creams/lotions
  • Capsules/nutricosmetics
  • Masks

By Channel:

  • E-commerce
  • Specialty beauty retail
  • Pharmacies
  • D2C brand

By Tier:

  • Mass
  • Masstige
  • Premium

By Region:

  • North America
  • Latin America
  • Europe
  • East Asia
  • South Asia & Pacific
  • Middle East and Africa

Table of Content

  1. Executive Summary
    • Global Market Outlook
    • Demand-side Trends
    • Supply-side Trends
    • Technology Roadmap Analysis
    • Analysis and Recommendations
  2. Market Overview
    • Market Coverage / Taxonomy
    • Market Definition / Scope / Limitations
  3. Market Background
    • Market Dynamics
      • Drivers
      • Restraints
      • Opportunity
      • Trends
    • Scenario Forecast
      • Demand in Optimistic Scenario
      • Demand in Likely Scenario
      • Demand in Conservative Scenario
    • Opportunity Map Analysis
    • Product Life Cycle Analysis
    • Supply Chain Analysis
      • Supply Side Participants and their Roles
        • Producers
        • Mid-Level Participants (Traders/ Agents/ Brokers)
        • Wholesalers and Distributors
      • Value Added and Value Created at Node in the Supply Chain
      • List of Raw Material Suppliers
      • List of Existing and Potential Buyer’s
    • Investment Feasibility Matrix
    • Value Chain Analysis
      • Profit Margin Analysis
      • Wholesalers and Distributors
      • Retailers
    • PESTLE and Porter’s Analysis
    • Regulatory Landscape
      • By Key Regions
      • By Key Countries
    • Regional Parent Market Outlook
    • Production and Consumption Statistics
    • Import and Export Statistics
  4. Global Market Analysis 2020 to 2024 and Forecast, 2025 to 2035
    • Historical Market Size Value (USD Million) & Volume (Units) Analysis, 2020 to 2024
    • Current and Future Market Size Value (USD Million) & Volume (Units) Projections, 2025 to 2035
      • Y-o-Y Growth Trend Analysis
      • Absolute $ Opportunity Analysis
  5. Global Market Analysis 2020 to 2024 and Forecast 2025 to 2035, By Source
    • Introduction / Key Findings
    • Historical Market Size Value (USD Million) & Volume (Units) Analysis By Source, 2020 to 2024
    • Current and Future Market Size Value (USD Million) & Volume (Units) Analysis and Forecast By Source, 2025 to 2035
      • Grape-derived
      • Knotweed-derived
      • Fermentation-derived
    • Y-o-Y Growth Trend Analysis By Source, 2020 to 2024
    • Absolute $ Opportunity Analysis By Source, 2025 to 2035
  6. Global Market Analysis 2020 to 2024 and Forecast 2025 to 2035, By Application
    • Introduction / Key Findings
    • Historical Market Size Value (USD Million) & Volume (Units) Analysis By Application, 2020 to 2024
    • Current and Future Market Size Value (USD Million) & Volume (Units) Analysis and Forecast By Application, 2025 to 2035
      • Anti-aging
      • Brightening
      • Firming
      • Antioxidant/repair
    • Y-o-Y Growth Trend Analysis By Application, 2020 to 2024
    • Absolute $ Opportunity Analysis By Application, 2025 to 2035
  7. Global Market Analysis 2020 to 2024 and Forecast 2025 to 2035, By Product Type
    • Introduction / Key Findings
    • Historical Market Size Value (USD Million) & Volume (Units) Analysis By Product Type, 2020 to 2024
    • Current and Future Market Size Value (USD Million) & Volume (Units) Analysis and Forecast By Product Type, 2025 to 2035
      • Serums
      • Creams/lotions
      • Capsules/nutricosmetics
      • Masks
    • Y-o-Y Growth Trend Analysis By Product Type, 2020 to 2024
    • Absolute $ Opportunity Analysis By Product Type, 2025 to 2035
  8. Global Market Analysis 2020 to 2024 and Forecast 2025 to 2035, By Channel
    • Introduction / Key Findings
    • Historical Market Size Value (USD Million) & Volume (Units) Analysis By Channel, 2020 to 2024
    • Current and Future Market Size Value (USD Million) & Volume (Units) Analysis and Forecast By Channel, 2025 to 2035
      • E-commerce
      • Specialty beauty retail
      • Pharmacies
      • D2C brand
    • Y-o-Y Growth Trend Analysis By Channel, 2020 to 2024
    • Absolute $ Opportunity Analysis By Channel, 2025 to 2035
  9. Global Market Analysis 2020 to 2024 and Forecast 2025 to 2035, By Tier
    • Introduction / Key Findings
    • Historical Market Size Value (USD Million) & Volume (Units) Analysis By Tier, 2020 to 2024
    • Current and Future Market Size Value (USD Million) & Volume (Units) Analysis and Forecast By Tier, 2025 to 2035
      • Mass
      • Masstige
      • Premium
    • Y-o-Y Growth Trend Analysis By Tier, 2020 to 2024
    • Absolute $ Opportunity Analysis By Tier, 2025 to 2035
  10. Global Market Analysis 2020 to 2024 and Forecast 2025 to 2035, By Region
    • Introduction
    • Historical Market Size Value (USD Million) & Volume (Units) Analysis By Region, 2020 to 2024
    • Current Market Size Value (USD Million) & Volume (Units) Analysis and Forecast By Region, 2025 to 2035
      • North America
      • Latin America
      • Europe
      • East Asia
      • South Asia & Pacific
      • Middle East and Africa
    • Market Attractiveness Analysis By Region
  11. North America Market Analysis 2020 to 2024 and Forecast 2025 to 2035, By Country
    • Historical Market Size Value (USD Million) & Volume (Units) Trend Analysis By Market Taxonomy, 2020 to 2024
    • Market Size Value (USD Million) & Volume (Units) Forecast By Market Taxonomy, 2025 to 2035
      • By Country
        • USA
        • Canada
      • By Source
      • By Application
      • By Product Type
      • By Channel
      • By Tier
    • Market Attractiveness Analysis
      • By Country
      • By Source
      • By Application
      • By Product Type
      • By Channel
      • By Tier
    • Key Takeaways
  12. Latin America Market Analysis 2020 to 2024 and Forecast 2025 to 2035, By Country
    • Historical Market Size Value (USD Million) & Volume (Units) Trend Analysis By Market Taxonomy, 2020 to 2024
    • Market Size Value (USD Million) & Volume (Units) Forecast By Market Taxonomy, 2025 to 2035
      • By Country
        • Brazil
        • Mexico
        • Colombia
        • Rest of Latin America
      • By Source
      • By Application
      • By Product Type
      • By Channel
      • By Tier
    • Market Attractiveness Analysis
      • By Country
      • By Source
      • By Application
      • By Product Type
      • By Channel
      • By Tier
    • Key Takeaways
  13. Europe Market Analysis 2020 to 2024 and Forecast 2025 to 2035, By Country
    • Historical Market Size Value (USD Million) & Volume (Units) Trend Analysis By Market Taxonomy, 2020 to 2024
    • Market Size Value (USD Million) & Volume (Units) Forecast By Market Taxonomy, 2025 to 2035
      • By Country
        • Germany
        • UK
        • France
        • Italy
        • Spain
        • Belgium
        • Netherlands
        • Nordic
        • Switzerland
        • Russia
        • Poland
        • Rest of Europe
      • By Source
      • By Application
      • By Product Type
      • By Channel
      • By Tier
    • Market Attractiveness Analysis
      • By Country
      • By Source
      • By Application
      • By Product Type
      • By Channel
      • By Tier
    • Key Takeaways
  14. East Asia Market Analysis 2020 to 2024 and Forecast 2025 to 2035, By Country
    • Historical Market Size Value (USD Million) & Volume (Units) Trend Analysis By Market Taxonomy, 2020 to 2024
    • Market Size Value (USD Million) & Volume (Units) Forecast By Market Taxonomy, 2025 to 2035
      • By Country
        • China
        • Japan
        • South Korea
      • By Source
      • By Application
      • By Product Type
      • By Channel
      • By Tier
    • Market Attractiveness Analysis
      • By Country
      • By Source
      • By Application
      • By Product Type
      • By Channel
      • By Tier
    • Key Takeaways
  15. South Asia & Pacific Market Analysis 2020 to 2024 and Forecast 2025 to 2035, By Country
    • Historical Market Size Value (USD Million) & Volume (Units) Trend Analysis By Market Taxonomy, 2020 to 2024
    • Market Size Value (USD Million) & Volume (Units) Forecast By Market Taxonomy, 2025 to 2035
      • By Country
        • India
        • Thailand
        • Malaysia
        • Indonesia
        • Singapore
        • Vietnam
        • Australia
        • New Zealand
        • Rest of South Asia
      • By Source
      • By Application
      • By Product Type
      • By Channel
      • By Tier
    • Market Attractiveness Analysis
      • By Country
      • By Source
      • By Application
      • By Product Type
      • By Channel
      • By Tier
    • Key Takeaways
  16. Middle East and Africa Market Analysis 2020 to 2024 and Forecast 2025 to 2035, By Country
    • Historical Market Size Value (USD Million) & Volume (Units) Trend Analysis By Market Taxonomy, 2020 to 2024
    • Market Size Value (USD Million) & Volume (Units) Forecast By Market Taxonomy, 2025 to 2035
      • By Country
        • Turkey
        • UAE
        • Saudi Arabia
        • Israel
        • Other GCC Countries
        • North Africa
        • South Africa
      • By Source
      • By Application
      • By Product Type
      • By Channel
      • By Tier
    • Market Attractiveness Analysis
      • By Country
      • By Source
      • By Application
      • By Product Type
      • By Channel
      • By Tier
    • Key Takeaways
  17. Key Countries Market Analysis
    • USA
      • Pricing Analysis
      • Market Share Analysis, 2024
        • By Source
        • By Application
        • By Product Type
        • By Channel
        • By Tier
    • Canada
      • Pricing Analysis
      • Market Share Analysis, 2024
        • By Source
        • By Application
        • By Product Type
        • By Channel
        • By Tier
    • Brazil
      • Pricing Analysis
      • Market Share Analysis, 2024
        • By Source
        • By Application
        • By Product Type
        • By Channel
        • By Tier
    • Mexico
      • Pricing Analysis
      • Market Share Analysis, 2024
        • By Source
        • By Application
        • By Product Type
        • By Channel
        • By Tier
    • Colombia
      • Pricing Analysis
      • Market Share Analysis, 2024
        • By Source
        • By Application
        • By Product Type
        • By Channel
        • By Tier
    • Germany
      • Pricing Analysis
      • Market Share Analysis, 2024
        • By Source
        • By Application
        • By Product Type
        • By Channel
        • By Tier
    • UK
      • Pricing Analysis
      • Market Share Analysis, 2024
        • By Source
        • By Application
        • By Product Type
        • By Channel
        • By Tier
    • France
      • Pricing Analysis
      • Market Share Analysis, 2024
        • By Source
        • By Application
        • By Product Type
        • By Channel
        • By Tier
    • Italy
      • Pricing Analysis
      • Market Share Analysis, 2024
        • By Source
        • By Application
        • By Product Type
        • By Channel
        • By Tier
    • Spain
      • Pricing Analysis
      • Market Share Analysis, 2024
        • By Source
        • By Application
        • By Product Type
        • By Channel
        • By Tier
    • Belgium
      • Pricing Analysis
      • Market Share Analysis, 2024
        • By Source
        • By Application
        • By Product Type
        • By Channel
        • By Tier
    • Netherlands
      • Pricing Analysis
      • Market Share Analysis, 2024
        • By Source
        • By Application
        • By Product Type
        • By Channel
        • By Tier
    • Nordic
      • Pricing Analysis
      • Market Share Analysis, 2024
        • By Source
        • By Application
        • By Product Type
        • By Channel
        • By Tier
    • Switzerland
      • Pricing Analysis
      • Market Share Analysis, 2024
        • By Source
        • By Application
        • By Product Type
        • By Channel
        • By Tier
    • Russia
      • Pricing Analysis
      • Market Share Analysis, 2024
        • By Source
        • By Application
        • By Product Type
        • By Channel
        • By Tier
    • Poland
      • Pricing Analysis
      • Market Share Analysis, 2024
        • By Source
        • By Application
        • By Product Type
        • By Channel
        • By Tier
    • China
      • Pricing Analysis
      • Market Share Analysis, 2024
        • By Source
        • By Application
        • By Product Type
        • By Channel
        • By Tier
    • Japan
      • Pricing Analysis
      • Market Share Analysis, 2024
        • By Source
        • By Application
        • By Product Type
        • By Channel
        • By Tier
    • South Korea
      • Pricing Analysis
      • Market Share Analysis, 2024
        • By Source
        • By Application
        • By Product Type
        • By Channel
        • By Tier
    • India
      • Pricing Analysis
      • Market Share Analysis, 2024
        • By Source
        • By Application
        • By Product Type
        • By Channel
        • By Tier
    • Thailand
      • Pricing Analysis
      • Market Share Analysis, 2024
        • By Source
        • By Application
        • By Product Type
        • By Channel
        • By Tier
    • Indonesia
      • Pricing Analysis
      • Market Share Analysis, 2024
        • By Source
        • By Application
        • By Product Type
        • By Channel
        • By Tier
    • Australia
      • Pricing Analysis
      • Market Share Analysis, 2024
        • By Source
        • By Application
        • By Product Type
        • By Channel
        • By Tier
    • New Zealand
      • Pricing Analysis
      • Market Share Analysis, 2024
        • By Source
        • By Application
        • By Product Type
        • By Channel
        • By Tier
    • Turkey
      • Pricing Analysis
      • Market Share Analysis, 2024
        • By Source
        • By Application
        • By Product Type
        • By Channel
        • By Tier
    • UAE
      • Pricing Analysis
      • Market Share Analysis, 2024
        • By Source
        • By Application
        • By Product Type
        • By Channel
        • By Tier
    • Saudi Arabia
      • Pricing Analysis
      • Market Share Analysis, 2024
        • By Source
        • By Application
        • By Product Type
        • By Channel
        • By Tier
    • Israel
      • Pricing Analysis
      • Market Share Analysis, 2024
        • By Source
        • By Application
        • By Product Type
        • By Channel
        • By Tier
    • North Africa
      • Pricing Analysis
      • Market Share Analysis, 2024
        • By Source
        • By Application
        • By Product Type
        • By Channel
        • By Tier
    • South Africa
      • Pricing Analysis
      • Market Share Analysis, 2024
        • By Source
        • By Application
        • By Product Type
        • By Channel
        • By Tier
  18. Market Structure Analysis
    • Competition Dashboard
    • Competition Benchmarking
    • Market Share Analysis of Top Players
      • By Regional
      • By Source
      • By Application
      • By Product Type
      • By Channel
      • By Tier
  19. Competition Analysis
    • Competition Deep Dive
      • Evolva
        • Overview
        • Product Portfolio
        • Profitability by Market Segments (Product/Age /Sales Channel/Region)
        • Sales Footprint
        • Strategy Overview
          • Marketing Strategy
          • Product Strategy
          • Channel Strategy
      • DSM-Firmenich
        • Overview
        • Product Portfolio
        • Profitability by Market Segments (Product/Age /Sales Channel/Region)
        • Sales Footprint
        • Strategy Overview
          • Marketing Strategy
          • Product Strategy
          • Channel Strategy
      • Ashland
        • Overview
        • Product Portfolio
        • Profitability by Market Segments (Product/Age /Sales Channel/Region)
        • Sales Footprint
        • Strategy Overview
          • Marketing Strategy
          • Product Strategy
          • Channel Strategy
      • BASF
        • Overview
        • Product Portfolio
        • Profitability by Market Segments (Product/Age /Sales Channel/Region)
        • Sales Footprint
        • Strategy Overview
          • Marketing Strategy
          • Product Strategy
          • Channel Strategy
      • Sabinsa
        • Overview
        • Product Portfolio
        • Profitability by Market Segments (Product/Age /Sales Channel/Region)
        • Sales Footprint
        • Strategy Overview
          • Marketing Strategy
          • Product Strategy
          • Channel Strategy
      • Lonza
        • Overview
        • Product Portfolio
        • Profitability by Market Segments (Product/Age /Sales Channel/Region)
        • Sales Footprint
        • Strategy Overview
          • Marketing Strategy
          • Product Strategy
          • Channel Strategy
      • Givaudan
        • Overview
        • Product Portfolio
        • Profitability by Market Segments (Product/Age /Sales Channel/Region)
        • Sales Footprint
        • Strategy Overview
          • Marketing Strategy
          • Product Strategy
          • Channel Strategy
      • Croda
        • Overview
        • Product Portfolio
        • Profitability by Market Segments (Product/Age /Sales Channel/Region)
        • Sales Footprint
        • Strategy Overview
          • Marketing Strategy
          • Product Strategy
          • Channel Strategy
      • Resvantage
        • Overview
        • Product Portfolio
        • Profitability by Market Segments (Product/Age /Sales Channel/Region)
        • Sales Footprint
        • Strategy Overview
          • Marketing Strategy
          • Product Strategy
          • Channel Strategy
      • Sabre Pharma
        • Overview
        • Product Portfolio
        • Profitability by Market Segments (Product/Age /Sales Channel/Region)
        • Sales Footprint
        • Strategy Overview
          • Marketing Strategy
          • Product Strategy
          • Channel Strategy
      • Others
        • Overview
        • Product Portfolio
        • Profitability by Market Segments (Product/Age /Sales Channel/Region)
        • Sales Footprint
        • Strategy Overview
          • Marketing Strategy
          • Product Strategy
          • Channel Strategy
  20. Assumptions & Acronyms Used
  21. Research Methodology

List of Tables

  • Table 1: Global Market Value (USD Million) Forecast by Region, 2020-2035
  • Table 2: Global Market Volume (Units) Forecast by Region, 2020-2035
  • Table 3: Global Market Value (USD Million) Forecast by Source, 2020-2035
  • Table 4: Global Market Volume (Units) Forecast by Source, 2020-2035
  • Table 5: Global Market Value (USD Million) Forecast by Application, 2020-2035
  • Table 6: Global Market Volume (Units) Forecast by Application, 2020-2035
  • Table 7: Global Market Value (USD Million) Forecast by Product Type, 2020-2035
  • Table 8: Global Market Volume (Units) Forecast by Product Type, 2020-2035
  • Table 9: Global Market Value (USD Million) Forecast by Channel, 2020-2035
  • Table 10: Global Market Volume (Units) Forecast by Channel, 2020-2035
  • Table 11: Global Market Value (USD Million) Forecast by Tier, 2020-2035
  • Table 12: Global Market Volume (Units) Forecast by Tier, 2020-2035
  • Table 13: North America Market Value (USD Million) Forecast by Country, 2020-2035
  • Table 14: North America Market Volume (Units) Forecast by Country, 2020-2035
  • Table 15: North America Market Value (USD Million) Forecast by Source, 2020-2035
  • Table 16: North America Market Volume (Units) Forecast by Source, 2020-2035
  • Table 17: North America Market Value (USD Million) Forecast by Application, 2020-2035
  • Table 18: North America Market Volume (Units) Forecast by Application, 2020-2035
  • Table 19: North America Market Value (USD Million) Forecast by Product Type, 2020-2035
  • Table 20: North America Market Volume (Units) Forecast by Product Type, 2020-2035
  • Table 21: North America Market Value (USD Million) Forecast by Channel, 2020-2035
  • Table 22: North America Market Volume (Units) Forecast by Channel, 2020-2035
  • Table 23: North America Market Value (USD Million) Forecast by Tier, 2020-2035
  • Table 24: North America Market Volume (Units) Forecast by Tier, 2020-2035
  • Table 25: Latin America Market Value (USD Million) Forecast by Country, 2020-2035
  • Table 26: Latin America Market Volume (Units) Forecast by Country, 2020-2035
  • Table 27: Latin America Market Value (USD Million) Forecast by Source, 2020-2035
  • Table 28: Latin America Market Volume (Units) Forecast by Source, 2020-2035
  • Table 29: Latin America Market Value (USD Million) Forecast by Application, 2020-2035
  • Table 30: Latin America Market Volume (Units) Forecast by Application, 2020-2035
  • Table 31: Latin America Market Value (USD Million) Forecast by Product Type, 2020-2035
  • Table 32: Latin America Market Volume (Units) Forecast by Product Type, 2020-2035
  • Table 33: Latin America Market Value (USD Million) Forecast by Channel, 2020-2035
  • Table 34: Latin America Market Volume (Units) Forecast by Channel, 2020-2035
  • Table 35: Latin America Market Value (USD Million) Forecast by Tier, 2020-2035
  • Table 36: Latin America Market Volume (Units) Forecast by Tier, 2020-2035
  • Table 37: Europe Market Value (USD Million) Forecast by Country, 2020-2035
  • Table 38: Europe Market Volume (Units) Forecast by Country, 2020-2035
  • Table 39: Europe Market Value (USD Million) Forecast by Source, 2020-2035
  • Table 40: Europe Market Volume (Units) Forecast by Source, 2020-2035
  • Table 41: Europe Market Value (USD Million) Forecast by Application, 2020-2035
  • Table 42: Europe Market Volume (Units) Forecast by Application, 2020-2035
  • Table 43: Europe Market Value (USD Million) Forecast by Product Type, 2020-2035
  • Table 44: Europe Market Volume (Units) Forecast by Product Type, 2020-2035
  • Table 45: Europe Market Value (USD Million) Forecast by Channel, 2020-2035
  • Table 46: Europe Market Volume (Units) Forecast by Channel, 2020-2035
  • Table 47: Europe Market Value (USD Million) Forecast by Tier, 2020-2035
  • Table 48: Europe Market Volume (Units) Forecast by Tier, 2020-2035
  • Table 49: East Asia Market Value (USD Million) Forecast by Country, 2020-2035
  • Table 50: East Asia Market Volume (Units) Forecast by Country, 2020-2035
  • Table 51: East Asia Market Value (USD Million) Forecast by Source, 2020-2035
  • Table 52: East Asia Market Volume (Units) Forecast by Source, 2020-2035
  • Table 53: East Asia Market Value (USD Million) Forecast by Application, 2020-2035
  • Table 54: East Asia Market Volume (Units) Forecast by Application, 2020-2035
  • Table 55: East Asia Market Value (USD Million) Forecast by Product Type, 2020-2035
  • Table 56: East Asia Market Volume (Units) Forecast by Product Type, 2020-2035
  • Table 57: East Asia Market Value (USD Million) Forecast by Channel, 2020-2035
  • Table 58: East Asia Market Volume (Units) Forecast by Channel, 2020-2035
  • Table 59: East Asia Market Value (USD Million) Forecast by Tier, 2020-2035
  • Table 60: East Asia Market Volume (Units) Forecast by Tier, 2020-2035
  • Table 61: South Asia & Pacific Market Value (USD Million) Forecast by Country, 2020-2035
  • Table 62: South Asia & Pacific Market Volume (Units) Forecast by Country, 2020-2035
  • Table 63: South Asia & Pacific Market Value (USD Million) Forecast by Source, 2020-2035
  • Table 64: South Asia & Pacific Market Volume (Units) Forecast by Source, 2020-2035
  • Table 65: South Asia & Pacific Market Value (USD Million) Forecast by Application, 2020-2035
  • Table 66: South Asia & Pacific Market Volume (Units) Forecast by Application, 2020-2035
  • Table 67: South Asia & Pacific Market Value (USD Million) Forecast by Product Type, 2020-2035
  • Table 68: South Asia & Pacific Market Volume (Units) Forecast by Product Type, 2020-2035
  • Table 69: South Asia & Pacific Market Value (USD Million) Forecast by Channel, 2020-2035
  • Table 70: South Asia & Pacific Market Volume (Units) Forecast by Channel, 2020-2035
  • Table 71: South Asia & Pacific Market Value (USD Million) Forecast by Tier, 2020-2035
  • Table 72: South Asia & Pacific Market Volume (Units) Forecast by Tier, 2020-2035
  • Table 73: Middle East and Africa Market Value (USD Million) Forecast by Country, 2020-2035
  • Table 74: Middle East and Africa Market Volume (Units) Forecast by Country, 2020-2035
  • Table 75: Middle East and Africa Market Value (USD Million) Forecast by Source, 2020-2035
  • Table 76: Middle East and Africa Market Volume (Units) Forecast by Source, 2020-2035
  • Table 77: Middle East and Africa Market Value (USD Million) Forecast by Application, 2020-2035
  • Table 78: Middle East and Africa Market Volume (Units) Forecast by Application, 2020-2035
  • Table 79: Middle East and Africa Market Value (USD Million) Forecast by Product Type, 2020-2035
  • Table 80: Middle East and Africa Market Volume (Units) Forecast by Product Type, 2020-2035
  • Table 81: Middle East and Africa Market Value (USD Million) Forecast by Channel, 2020-2035
  • Table 82: Middle East and Africa Market Volume (Units) Forecast by Channel, 2020-2035
  • Table 83: Middle East and Africa Market Value (USD Million) Forecast by Tier, 2020-2035
  • Table 84: Middle East and Africa Market Volume (Units) Forecast by Tier, 2020-2035

List of Figures

  • Figure 1: Global Market Value (USD Million) by Source, 2025-2035
  • Figure 2: Global Market Value (USD Million) by Application, 2025-2035
  • Figure 3: Global Market Value (USD Million) by Product Type, 2025-2035
  • Figure 4: Global Market Value (USD Million) by Channel, 2025-2035
  • Figure 5: Global Market Value (USD Million) by Tier, 2025-2035
  • Figure 6: Global Market Value (USD Million) by Region, 2025-2035
  • Figure 7: Global Market Value (USD Million) Analysis by Region, 2020-2035
  • Figure 8: Global Market Volume (Units) Analysis by Region, 2020-2035
  • Figure 9: Global Market Value Share (%) and BPS Analysis by Region, 2025-2035
  • Figure 10: Global Market Y-o-Y Growth (%) Projections by Region, 2025-2035
  • Figure 11: Global Market Value (USD Million) Analysis by Source, 2020-2035
  • Figure 12: Global Market Volume (Units) Analysis by Source, 2020-2035
  • Figure 13: Global Market Value Share (%) and BPS Analysis by Source, 2025-2035
  • Figure 14: Global Market Y-o-Y Growth (%) Projections by Source, 2025-2035
  • Figure 15: Global Market Value (USD Million) Analysis by Application, 2020-2035
  • Figure 16: Global Market Volume (Units) Analysis by Application, 2020-2035
  • Figure 17: Global Market Value Share (%) and BPS Analysis by Application, 2025-2035
  • Figure 18: Global Market Y-o-Y Growth (%) Projections by Application, 2025-2035
  • Figure 19: Global Market Value (USD Million) Analysis by Product Type, 2020-2035
  • Figure 20: Global Market Volume (Units) Analysis by Product Type, 2020-2035
  • Figure 21: Global Market Value Share (%) and BPS Analysis by Product Type, 2025-2035
  • Figure 22: Global Market Y-o-Y Growth (%) Projections by Product Type, 2025-2035
  • Figure 23: Global Market Value (USD Million) Analysis by Channel, 2020-2035
  • Figure 24: Global Market Volume (Units) Analysis by Channel, 2020-2035
  • Figure 25: Global Market Value Share (%) and BPS Analysis by Channel, 2025-2035
  • Figure 26: Global Market Y-o-Y Growth (%) Projections by Channel, 2025-2035
  • Figure 27: Global Market Value (USD Million) Analysis by Tier, 2020-2035
  • Figure 28: Global Market Volume (Units) Analysis by Tier, 2020-2035
  • Figure 29: Global Market Value Share (%) and BPS Analysis by Tier, 2025-2035
  • Figure 30: Global Market Y-o-Y Growth (%) Projections by Tier, 2025-2035
  • Figure 31: Global Market Attractiveness by Source, 2025-2035
  • Figure 32: Global Market Attractiveness by Application, 2025-2035
  • Figure 33: Global Market Attractiveness by Product Type, 2025-2035
  • Figure 34: Global Market Attractiveness by Channel, 2025-2035
  • Figure 35: Global Market Attractiveness by Tier, 2025-2035
  • Figure 36: Global Market Attractiveness by Region, 2025-2035
  • Figure 37: North America Market Value (USD Million) by Source, 2025-2035
  • Figure 38: North America Market Value (USD Million) by Application, 2025-2035
  • Figure 39: North America Market Value (USD Million) by Product Type, 2025-2035
  • Figure 40: North America Market Value (USD Million) by Channel, 2025-2035
  • Figure 41: North America Market Value (USD Million) by Tier, 2025-2035
  • Figure 42: North America Market Value (USD Million) by Country, 2025-2035
  • Figure 43: North America Market Value (USD Million) Analysis by Country, 2020-2035
  • Figure 44: North America Market Volume (Units) Analysis by Country, 2020-2035
  • Figure 45: North America Market Value Share (%) and BPS Analysis by Country, 2025-2035
  • Figure 46: North America Market Y-o-Y Growth (%) Projections by Country, 2025-2035
  • Figure 47: North America Market Value (USD Million) Analysis by Source, 2020-2035
  • Figure 48: North America Market Volume (Units) Analysis by Source, 2020-2035
  • Figure 49: North America Market Value Share (%) and BPS Analysis by Source, 2025-2035
  • Figure 50: North America Market Y-o-Y Growth (%) Projections by Source, 2025-2035
  • Figure 51: North America Market Value (USD Million) Analysis by Application, 2020-2035
  • Figure 52: North America Market Volume (Units) Analysis by Application, 2020-2035
  • Figure 53: North America Market Value Share (%) and BPS Analysis by Application, 2025-2035
  • Figure 54: North America Market Y-o-Y Growth (%) Projections by Application, 2025-2035
  • Figure 55: North America Market Value (USD Million) Analysis by Product Type, 2020-2035
  • Figure 56: North America Market Volume (Units) Analysis by Product Type, 2020-2035
  • Figure 57: North America Market Value Share (%) and BPS Analysis by Product Type, 2025-2035
  • Figure 58: North America Market Y-o-Y Growth (%) Projections by Product Type, 2025-2035
  • Figure 59: North America Market Value (USD Million) Analysis by Channel, 2020-2035
  • Figure 60: North America Market Volume (Units) Analysis by Channel, 2020-2035
  • Figure 61: North America Market Value Share (%) and BPS Analysis by Channel, 2025-2035
  • Figure 62: North America Market Y-o-Y Growth (%) Projections by Channel, 2025-2035
  • Figure 63: North America Market Value (USD Million) Analysis by Tier, 2020-2035
  • Figure 64: North America Market Volume (Units) Analysis by Tier, 2020-2035
  • Figure 65: North America Market Value Share (%) and BPS Analysis by Tier, 2025-2035
  • Figure 66: North America Market Y-o-Y Growth (%) Projections by Tier, 2025-2035
  • Figure 67: North America Market Attractiveness by Source, 2025-2035
  • Figure 68: North America Market Attractiveness by Application, 2025-2035
  • Figure 69: North America Market Attractiveness by Product Type, 2025-2035
  • Figure 70: North America Market Attractiveness by Channel, 2025-2035
  • Figure 71: North America Market Attractiveness by Tier, 2025-2035
  • Figure 72: North America Market Attractiveness by Country, 2025-2035
  • Figure 73: Latin America Market Value (USD Million) by Source, 2025-2035
  • Figure 74: Latin America Market Value (USD Million) by Application, 2025-2035
  • Figure 75: Latin America Market Value (USD Million) by Product Type, 2025-2035
  • Figure 76: Latin America Market Value (USD Million) by Channel, 2025-2035
  • Figure 77: Latin America Market Value (USD Million) by Tier, 2025-2035
  • Figure 78: Latin America Market Value (USD Million) by Country, 2025-2035
  • Figure 79: Latin America Market Value (USD Million) Analysis by Country, 2020-2035
  • Figure 80: Latin America Market Volume (Units) Analysis by Country, 2020-2035
  • Figure 81: Latin America Market Value Share (%) and BPS Analysis by Country, 2025-2035
  • Figure 82: Latin America Market Y-o-Y Growth (%) Projections by Country, 2025-2035
  • Figure 83: Latin America Market Value (USD Million) Analysis by Source, 2020-2035
  • Figure 84: Latin America Market Volume (Units) Analysis by Source, 2020-2035
  • Figure 85: Latin America Market Value Share (%) and BPS Analysis by Source, 2025-2035
  • Figure 86: Latin America Market Y-o-Y Growth (%) Projections by Source, 2025-2035
  • Figure 87: Latin America Market Value (USD Million) Analysis by Application, 2020-2035
  • Figure 88: Latin America Market Volume (Units) Analysis by Application, 2020-2035
  • Figure 89: Latin America Market Value Share (%) and BPS Analysis by Application, 2025-2035
  • Figure 90: Latin America Market Y-o-Y Growth (%) Projections by Application, 2025-2035
  • Figure 91: Latin America Market Value (USD Million) Analysis by Product Type, 2020-2035
  • Figure 92: Latin America Market Volume (Units) Analysis by Product Type, 2020-2035
  • Figure 93: Latin America Market Value Share (%) and BPS Analysis by Product Type, 2025-2035
  • Figure 94: Latin America Market Y-o-Y Growth (%) Projections by Product Type, 2025-2035
  • Figure 95: Latin America Market Value (USD Million) Analysis by Channel, 2020-2035
  • Figure 96: Latin America Market Volume (Units) Analysis by Channel, 2020-2035
  • Figure 97: Latin America Market Value Share (%) and BPS Analysis by Channel, 2025-2035
  • Figure 98: Latin America Market Y-o-Y Growth (%) Projections by Channel, 2025-2035
  • Figure 99: Latin America Market Value (USD Million) Analysis by Tier, 2020-2035
  • Figure 100: Latin America Market Volume (Units) Analysis by Tier, 2020-2035
  • Figure 101: Latin America Market Value Share (%) and BPS Analysis by Tier, 2025-2035
  • Figure 102: Latin America Market Y-o-Y Growth (%) Projections by Tier, 2025-2035
  • Figure 103: Latin America Market Attractiveness by Source, 2025-2035
  • Figure 104: Latin America Market Attractiveness by Application, 2025-2035
  • Figure 105: Latin America Market Attractiveness by Product Type, 2025-2035
  • Figure 106: Latin America Market Attractiveness by Channel, 2025-2035
  • Figure 107: Latin America Market Attractiveness by Tier, 2025-2035
  • Figure 108: Latin America Market Attractiveness by Country, 2025-2035
  • Figure 109: Europe Market Value (USD Million) by Source, 2025-2035
  • Figure 110: Europe Market Value (USD Million) by Application, 2025-2035
  • Figure 111: Europe Market Value (USD Million) by Product Type, 2025-2035
  • Figure 112: Europe Market Value (USD Million) by Channel, 2025-2035
  • Figure 113: Europe Market Value (USD Million) by Tier, 2025-2035
  • Figure 114: Europe Market Value (USD Million) by Country, 2025-2035
  • Figure 115: Europe Market Value (USD Million) Analysis by Country, 2020-2035
  • Figure 116: Europe Market Volume (Units) Analysis by Country, 2020-2035
  • Figure 117: Europe Market Value Share (%) and BPS Analysis by Country, 2025-2035
  • Figure 118: Europe Market Y-o-Y Growth (%) Projections by Country, 2025-2035
  • Figure 119: Europe Market Value (USD Million) Analysis by Source, 2020-2035
  • Figure 120: Europe Market Volume (Units) Analysis by Source, 2020-2035
  • Figure 121: Europe Market Value Share (%) and BPS Analysis by Source, 2025-2035
  • Figure 122: Europe Market Y-o-Y Growth (%) Projections by Source, 2025-2035
  • Figure 123: Europe Market Value (USD Million) Analysis by Application, 2020-2035
  • Figure 124: Europe Market Volume (Units) Analysis by Application, 2020-2035
  • Figure 125: Europe Market Value Share (%) and BPS Analysis by Application, 2025-2035
  • Figure 126: Europe Market Y-o-Y Growth (%) Projections by Application, 2025-2035
  • Figure 127: Europe Market Value (USD Million) Analysis by Product Type, 2020-2035
  • Figure 128: Europe Market Volume (Units) Analysis by Product Type, 2020-2035
  • Figure 129: Europe Market Value Share (%) and BPS Analysis by Product Type, 2025-2035
  • Figure 130: Europe Market Y-o-Y Growth (%) Projections by Product Type, 2025-2035
  • Figure 131: Europe Market Value (USD Million) Analysis by Channel, 2020-2035
  • Figure 132: Europe Market Volume (Units) Analysis by Channel, 2020-2035
  • Figure 133: Europe Market Value Share (%) and BPS Analysis by Channel, 2025-2035
  • Figure 134: Europe Market Y-o-Y Growth (%) Projections by Channel, 2025-2035
  • Figure 135: Europe Market Value (USD Million) Analysis by Tier, 2020-2035
  • Figure 136: Europe Market Volume (Units) Analysis by Tier, 2020-2035
  • Figure 137: Europe Market Value Share (%) and BPS Analysis by Tier, 2025-2035
  • Figure 138: Europe Market Y-o-Y Growth (%) Projections by Tier, 2025-2035
  • Figure 139: Europe Market Attractiveness by Source, 2025-2035
  • Figure 140: Europe Market Attractiveness by Application, 2025-2035
  • Figure 141: Europe Market Attractiveness by Product Type, 2025-2035
  • Figure 142: Europe Market Attractiveness by Channel, 2025-2035
  • Figure 143: Europe Market Attractiveness by Tier, 2025-2035
  • Figure 144: Europe Market Attractiveness by Country, 2025-2035
  • Figure 145: East Asia Market Value (USD Million) by Source, 2025-2035
  • Figure 146: East Asia Market Value (USD Million) by Application, 2025-2035
  • Figure 147: East Asia Market Value (USD Million) by Product Type, 2025-2035
  • Figure 148: East Asia Market Value (USD Million) by Channel, 2025-2035
  • Figure 149: East Asia Market Value (USD Million) by Tier, 2025-2035
  • Figure 150: East Asia Market Value (USD Million) by Country, 2025-2035
  • Figure 151: East Asia Market Value (USD Million) Analysis by Country, 2020-2035
  • Figure 152: East Asia Market Volume (Units) Analysis by Country, 2020-2035
  • Figure 153: East Asia Market Value Share (%) and BPS Analysis by Country, 2025-2035
  • Figure 154: East Asia Market Y-o-Y Growth (%) Projections by Country, 2025-2035
  • Figure 155: East Asia Market Value (USD Million) Analysis by Source, 2020-2035
  • Figure 156: East Asia Market Volume (Units) Analysis by Source, 2020-2035
  • Figure 157: East Asia Market Value Share (%) and BPS Analysis by Source, 2025-2035
  • Figure 158: East Asia Market Y-o-Y Growth (%) Projections by Source, 2025-2035
  • Figure 159: East Asia Market Value (USD Million) Analysis by Application, 2020-2035
  • Figure 160: East Asia Market Volume (Units) Analysis by Application, 2020-2035
  • Figure 161: East Asia Market Value Share (%) and BPS Analysis by Application, 2025-2035
  • Figure 162: East Asia Market Y-o-Y Growth (%) Projections by Application, 2025-2035
  • Figure 163: East Asia Market Value (USD Million) Analysis by Product Type, 2020-2035
  • Figure 164: East Asia Market Volume (Units) Analysis by Product Type, 2020-2035
  • Figure 165: East Asia Market Value Share (%) and BPS Analysis by Product Type, 2025-2035
  • Figure 166: East Asia Market Y-o-Y Growth (%) Projections by Product Type, 2025-2035
  • Figure 167: East Asia Market Value (USD Million) Analysis by Channel, 2020-2035
  • Figure 168: East Asia Market Volume (Units) Analysis by Channel, 2020-2035
  • Figure 169: East Asia Market Value Share (%) and BPS Analysis by Channel, 2025-2035
  • Figure 170: East Asia Market Y-o-Y Growth (%) Projections by Channel, 2025-2035
  • Figure 171: East Asia Market Value (USD Million) Analysis by Tier, 2020-2035
  • Figure 172: East Asia Market Volume (Units) Analysis by Tier, 2020-2035
  • Figure 173: East Asia Market Value Share (%) and BPS Analysis by Tier, 2025-2035
  • Figure 174: East Asia Market Y-o-Y Growth (%) Projections by Tier, 2025-2035
  • Figure 175: East Asia Market Attractiveness by Source, 2025-2035
  • Figure 176: East Asia Market Attractiveness by Application, 2025-2035
  • Figure 177: East Asia Market Attractiveness by Product Type, 2025-2035
  • Figure 178: East Asia Market Attractiveness by Channel, 2025-2035
  • Figure 179: East Asia Market Attractiveness by Tier, 2025-2035
  • Figure 180: East Asia Market Attractiveness by Country, 2025-2035
  • Figure 181: South Asia & Pacific Market Value (USD Million) by Source, 2025-2035
  • Figure 182: South Asia & Pacific Market Value (USD Million) by Application, 2025-2035
  • Figure 183: South Asia & Pacific Market Value (USD Million) by Product Type, 2025-2035
  • Figure 184: South Asia & Pacific Market Value (USD Million) by Channel, 2025-2035
  • Figure 185: South Asia & Pacific Market Value (USD Million) by Tier, 2025-2035
  • Figure 186: South Asia & Pacific Market Value (USD Million) by Country, 2025-2035
  • Figure 187: South Asia & Pacific Market Value (USD Million) Analysis by Country, 2020-2035
  • Figure 188: South Asia & Pacific Market Volume (Units) Analysis by Country, 2020-2035
  • Figure 189: South Asia & Pacific Market Value Share (%) and BPS Analysis by Country, 2025-2035
  • Figure 190: South Asia & Pacific Market Y-o-Y Growth (%) Projections by Country, 2025-2035
  • Figure 191: South Asia & Pacific Market Value (USD Million) Analysis by Source, 2020-2035
  • Figure 192: South Asia & Pacific Market Volume (Units) Analysis by Source, 2020-2035
  • Figure 193: South Asia & Pacific Market Value Share (%) and BPS Analysis by Source, 2025-2035
  • Figure 194: South Asia & Pacific Market Y-o-Y Growth (%) Projections by Source, 2025-2035
  • Figure 195: South Asia & Pacific Market Value (USD Million) Analysis by Application, 2020-2035
  • Figure 196: South Asia & Pacific Market Volume (Units) Analysis by Application, 2020-2035
  • Figure 197: South Asia & Pacific Market Value Share (%) and BPS Analysis by Application, 2025-2035
  • Figure 198: South Asia & Pacific Market Y-o-Y Growth (%) Projections by Application, 2025-2035
  • Figure 199: South Asia & Pacific Market Value (USD Million) Analysis by Product Type, 2020-2035
  • Figure 200: South Asia & Pacific Market Volume (Units) Analysis by Product Type, 2020-2035
  • Figure 201: South Asia & Pacific Market Value Share (%) and BPS Analysis by Product Type, 2025-2035
  • Figure 202: South Asia & Pacific Market Y-o-Y Growth (%) Projections by Product Type, 2025-2035
  • Figure 203: South Asia & Pacific Market Value (USD Million) Analysis by Channel, 2020-2035
  • Figure 204: South Asia & Pacific Market Volume (Units) Analysis by Channel, 2020-2035
  • Figure 205: South Asia & Pacific Market Value Share (%) and BPS Analysis by Channel, 2025-2035
  • Figure 206: South Asia & Pacific Market Y-o-Y Growth (%) Projections by Channel, 2025-2035
  • Figure 207: South Asia & Pacific Market Value (USD Million) Analysis by Tier, 2020-2035
  • Figure 208: South Asia & Pacific Market Volume (Units) Analysis by Tier, 2020-2035
  • Figure 209: South Asia & Pacific Market Value Share (%) and BPS Analysis by Tier, 2025-2035
  • Figure 210: South Asia & Pacific Market Y-o-Y Growth (%) Projections by Tier, 2025-2035
  • Figure 211: South Asia & Pacific Market Attractiveness by Source, 2025-2035
  • Figure 212: South Asia & Pacific Market Attractiveness by Application, 2025-2035
  • Figure 213: South Asia & Pacific Market Attractiveness by Product Type, 2025-2035
  • Figure 214: South Asia & Pacific Market Attractiveness by Channel, 2025-2035
  • Figure 215: South Asia & Pacific Market Attractiveness by Tier, 2025-2035
  • Figure 216: South Asia & Pacific Market Attractiveness by Country, 2025-2035
  • Figure 217: Middle East and Africa Market Value (USD Million) by Source, 2025-2035
  • Figure 218: Middle East and Africa Market Value (USD Million) by Application, 2025-2035
  • Figure 219: Middle East and Africa Market Value (USD Million) by Product Type, 2025-2035
  • Figure 220: Middle East and Africa Market Value (USD Million) by Channel, 2025-2035
  • Figure 221: Middle East and Africa Market Value (USD Million) by Tier, 2025-2035
  • Figure 222: Middle East and Africa Market Value (USD Million) by Country, 2025-2035
  • Figure 223: Middle East and Africa Market Value (USD Million) Analysis by Country, 2020-2035
  • Figure 224: Middle East and Africa Market Volume (Units) Analysis by Country, 2020-2035
  • Figure 225: Middle East and Africa Market Value Share (%) and BPS Analysis by Country, 2025-2035
  • Figure 226: Middle East and Africa Market Y-o-Y Growth (%) Projections by Country, 2025-2035
  • Figure 227: Middle East and Africa Market Value (USD Million) Analysis by Source, 2020-2035
  • Figure 228: Middle East and Africa Market Volume (Units) Analysis by Source, 2020-2035
  • Figure 229: Middle East and Africa Market Value Share (%) and BPS Analysis by Source, 2025-2035
  • Figure 230: Middle East and Africa Market Y-o-Y Growth (%) Projections by Source, 2025-2035
  • Figure 231: Middle East and Africa Market Value (USD Million) Analysis by Application, 2020-2035
  • Figure 232: Middle East and Africa Market Volume (Units) Analysis by Application, 2020-2035
  • Figure 233: Middle East and Africa Market Value Share (%) and BPS Analysis by Application, 2025-2035
  • Figure 234: Middle East and Africa Market Y-o-Y Growth (%) Projections by Application, 2025-2035
  • Figure 235: Middle East and Africa Market Value (USD Million) Analysis by Product Type, 2020-2035
  • Figure 236: Middle East and Africa Market Volume (Units) Analysis by Product Type, 2020-2035
  • Figure 237: Middle East and Africa Market Value Share (%) and BPS Analysis by Product Type, 2025-2035
  • Figure 238: Middle East and Africa Market Y-o-Y Growth (%) Projections by Product Type, 2025-2035
  • Figure 239: Middle East and Africa Market Value (USD Million) Analysis by Channel, 2020-2035
  • Figure 240: Middle East and Africa Market Volume (Units) Analysis by Channel, 2020-2035
  • Figure 241: Middle East and Africa Market Value Share (%) and BPS Analysis by Channel, 2025-2035
  • Figure 242: Middle East and Africa Market Y-o-Y Growth (%) Projections by Channel, 2025-2035
  • Figure 243: Middle East and Africa Market Value (USD Million) Analysis by Tier, 2020-2035
  • Figure 244: Middle East and Africa Market Volume (Units) Analysis by Tier, 2020-2035
  • Figure 245: Middle East and Africa Market Value Share (%) and BPS Analysis by Tier, 2025-2035
  • Figure 246: Middle East and Africa Market Y-o-Y Growth (%) Projections by Tier, 2025-2035
  • Figure 247: Middle East and Africa Market Attractiveness by Source, 2025-2035
  • Figure 248: Middle East and Africa Market Attractiveness by Application, 2025-2035
  • Figure 249: Middle East and Africa Market Attractiveness by Product Type, 2025-2035
  • Figure 250: Middle East and Africa Market Attractiveness by Channel, 2025-2035
  • Figure 251: Middle East and Africa Market Attractiveness by Tier, 2025-2035
  • Figure 252: Middle East and Africa Market Attractiveness by Country, 2025-2035

Frequently Asked Questions

How big is the Resveratrol Enriched Formulas Market in 2025?

The global Resveratrol Enriched Formulas Market is estimated to be valued at USD 1,120.3 Million in 2025, supported by growing demand for anti-aging, antioxidant, and nutricosmetic applications across global regions.

What will be the size of the Resveratrol Enriched Formulas Market in 2035?

The Resveratrol Enriched Formulas Market is projected to reach USD 3,403.2 Million by 2035, reflecting the rapid expansion of clinically validated formulations and premium positioning in global beauty and wellness portfolios.

How much will be the Resveratrol Enriched Formulas Market growth between 2025 and 2035?

The Resveratrol Enriched Formulas Market is expected to grow at a CAGR of 11.8% between 2025 and 2035, adding nearly USD 2.3 Billion in incremental value over the ten-year period.

What are the key product types in the Resveratrol Enriched Formulas Market?

The key product types in the Resveratrol Enriched Formulas Market are serums and other formats such as capsules, creams, and lotions, with serums leading adoption due to high potency and fast absorption benefits.

Which application segment is projected to contribute the largest share in the Resveratrol Enriched Formulas Market in 2025?

In terms of applications, the anti-aging segment is expected to command 54.5% share in 2025, highlighting consumer prioritization of wrinkle reduction, elasticity improvement, and skin repair benefits.

Explore Similar Insights

Future Market Insights

Resveratrol Enriched Formulas Market