The ring lights market is estimated to be valued at USD 11.9 billion in 2025 and is projected USD 48.1 billion by 2035, registering a compound annual growth rate (CAGR) of 15% over the forecast period. The market is expected to add an absolute dollar opportunity of USD 36.2 billion during this period. This reflects a 4.04 times growth at a strong CAGR of 15%.
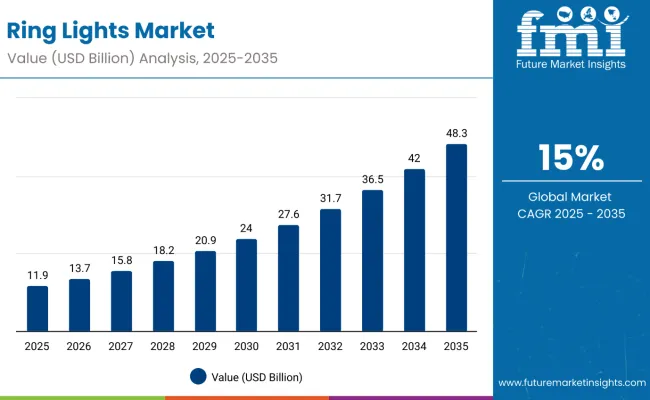
| Metric | Value |
|---|---|
| Market Value (2025) | USD 11.9 billion |
| Market Forecast Value (2035) | USD 48.1 billion |
| Market Forecast CAGR (2025 to 2035) | 15.0% |
The market evolution is expected to be shaped by rising demand from content creators, beauty influencers, professional photographers, and remote workers seeking advanced lighting solutions for digital platforms.
By 2030, the ring lights market is likely to reach USD 24.0 billion, accounting for USD 12.0 billion in incremental value over the first half of the decade. The remaining USD 12.4 billion is expected during the second half, suggesting a back-loaded growth pattern driven by rising demand from content creators, beauty influencers, and professional photography applications worldwide.
Companies such as Neewer, Koninklijke Philips N.V., Samsung Electronics Co. Ltd., UBeesize, and Godox Photo Equipment are consolidating their positions by strengthening product portfolios and advancing next-generation lighting technologies. Their focus includes smart connectivity features, adjustable color temperatures, and wireless control mechanisms that minimize setup complexity, enabling stronger market penetration across both developed consumer markets and emerging regions. By investing in innovation, energy efficiency, and cost-effective solutions, these players are enhancing accessibility for content creators while capturing growth opportunities in a rapidly expanding digital content creation segment.
The market holds a critical position in the consumer electronics and photography equipment sector, capturing demand primarily from smart/automatic ring lights, which account for over 65% of all product usage due to their convenience and advanced features. The 12 to 24 inches segment, representing more than 35% of product demand, remains central to professional and semi-professional applications for providing optimal lighting coverage and versatility. This sector contributes substantially to the broader consumer lighting landscape, driven by consistent content creation needs, advancements in LED technology, and increasing access to professional-grade equipment in emerging markets.
The market is evolving with smart connectivity, app-based controls, and energy-efficient LED technologies that enhance precision, reduce power consumption, and improve long-term user satisfaction. Companies are strengthening their portfolios with intelligent, portable lighting systems, aiming to minimize setup complexity and maximize creative possibilities for photography, videography, and live streaming applications. Strategic collaborations with influencers, content creation platforms, and e-commerce retailers are reshaping accessibility and positioning advanced ring light systems as essential solutions for professional photographers, social media influencers, and everyday content creators worldwide.
Ring lights’ unique ability to provide uniform illumination, adjustable brightness, and color-temperature control across multiple applications is driving their adoption. Their functional features make them indispensable for content creation, photography, videography, and beauty applications, where visual clarity, professional-quality lighting, and user convenience are critical.
The shift toward remote work and virtual meetings has further accelerated adoption, as professionals seek enhanced lighting for video conferencing. Additionally, technological advancements including smart connectivity, adjustable color temperatures, and energy-efficient LED technology have made ring lights more versatile and user-friendly.
The democratization of content creation tools has made professional photography and videography accessible to broader audiences. E-commerce growth and declining prices have improved affordability, while strategic partnerships with influencers and online platforms have expanded market reach. The beauty and cosmetics industry's emphasis on visual appeal continues driving demand across both professional and consumer segments.
The market is segmented by product type, product size, price range, technology, distribution channel, application, power source, and region. By product type, the market covers with stand, hanging, and portable. By product size, the market includes below 6 inches, 6 to 12 inches, 12 to 24 inches, and more than 24 inches. By price range, the market comprises below USD 25, USD 25 - USD 50, USD 50 - USD 75, and USD 75 and above. By technology, the market includes smart/automatic and conventional.
By distribution channel, the market is categorized into wholesalers/distributors, hypermarket/supermarkets, specialty stores, home centres, department stores, independent electronic stores, online retailers, and others (direct sales, catalog sales, television shopping, and mobile vendors). By application, the market includes commercial, studio, photography, video production, outside, households, macro photography, videography, and makeup application. By power source, the market comprises battery operated, solar power, and AC supply. Regionally, the market spans across North America, Latin America, Europe, Asia Pacific, and MEA.
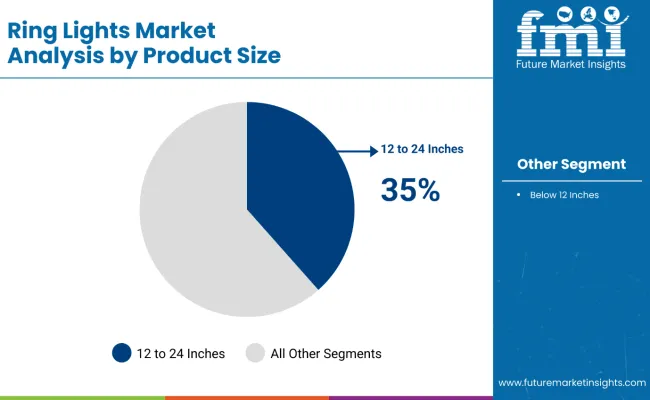
The 12 to 24 inches segment represents the most lucrative product size category in the ring lights market, commanding a leading 35% market share in 2025. This segment's dominance stems from its optimal balance between portability and professional lighting coverage, making it the preferred choice across diverse applications.
Ring lights in the 12-to-24-inch range offer exceptional versatility, capable of producing high-quality illumination covering approximately five feet of lighting distance, ideal for both close-up and medium-range photography. This size category perfectly serves professional photographers, videographers, and content creators who require superior lighting quality without sacrificing mobility. The segment's appeal lies in its daylight-balance lighting capabilities, which deliver natural-looking illumination essential for professional video production and photography applications.
This size category is particularly popular among professional photographers, videographers, and digital content creators who require superior lighting without sacrificing mobility. The appeal of the 12-to-24-inch range also lies in its daylight-balance lighting capabilities, delivering natural-looking illumination that is essential for video production, live streaming, and photography. These features support creative flexibility, enabling users to produce visually compelling content for a variety of platforms and applications.
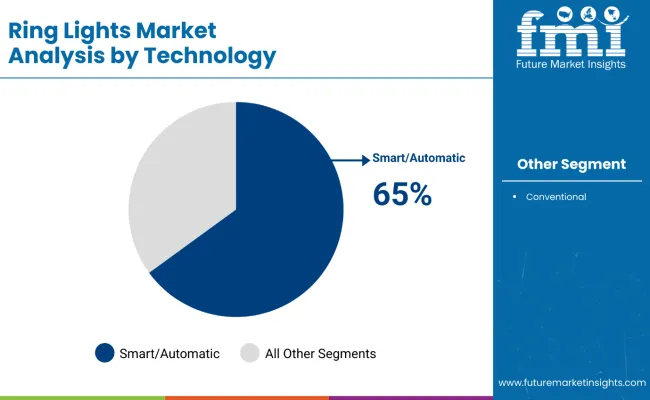
The smart/automatic segment represents the most lucrative technology category in the ring lights market, commanding a dominant 65% market share in 2025. This segment's supremacy stems from rapidly evolving consumer preferences toward intelligent lighting solutions that offer enhanced convenience and professional-grade functionality. Smart/automatic ring lights incorporate advanced features including Bluetooth connectivity, smartphone app integration, voice assistant compatibility (Alexa, Google Assistant), and remote-controlled brightness/color temperature adjustments.
These innovations have revolutionized traditional lighting workflows, enabling content creators to achieve precise lighting control without physical adjustments, significantly improving production efficiency. The segment's growth is accelerated by AI-driven lighting systems that automatically adjust settings based on ambient conditions and user preferences.
Growth in the smart/automatic segment is further accelerated by AI-driven lighting systems that automatically adapt settings based on ambient conditions and user preferences. This capability ensures optimal illumination across varying scenarios, supporting live streaming, photography, video conferencing, and content creation. As creators increasingly prioritize efficiency and dynamic control, the adoption of smart/automatic ring lights continues to expand, reinforcing the segment’s dominant market position and driving overall market growth.
In 2024, global ring lights demand grew by 11% year-on-year, with North America and Asia-Pacific accounting for 38% and 34% shares of total consumption, respectively. Applications include content creation, professional photography, live streaming, video conferencing, and beauty tutorials. Manufacturers are increasingly integrating smart/automatic features, adjustable color temperatures, and wireless controls to enhance user convenience and functionality. Rising social media influence, growing digital content consumption, and demand for high-quality lighting solutions continue to support market adoption.
Content Creation and Professional Applications Drive Ring Lights Adoption
Content creators, photographers, and beauty influencers are the largest consumers of ring lights, leveraging their ability to provide uniform, shadow-free, and adjustable illumination. With the surge in online content production, live streaming, and virtual presentations, ring lights have become indispensable tools. The 12-24-inch product size and smart/automatic technology segments are witnessing the highest adoption, offering optimal portability, coverage, and intelligent control features that enhance production quality. The growing popularity of influencer-led marketing and remote working setups further strengthens demand.
Technological Limitations and Competitive Alternatives Restrain Growth
Despite rising adoption, the market faces challenges such as the high cost of advanced smart/automatic ring lights, limited battery life for portable models, and competition from alternative lighting solutions like LED panels and softboxes. Product standardization and compatibility issues with various devices may also restrict growth in certain regions. Additionally, price-sensitive markets may prefer basic ring lights over technologically advanced models, prompting manufacturers to balance innovation with affordability while continuously enhancing product features to maintain competitive positioning.
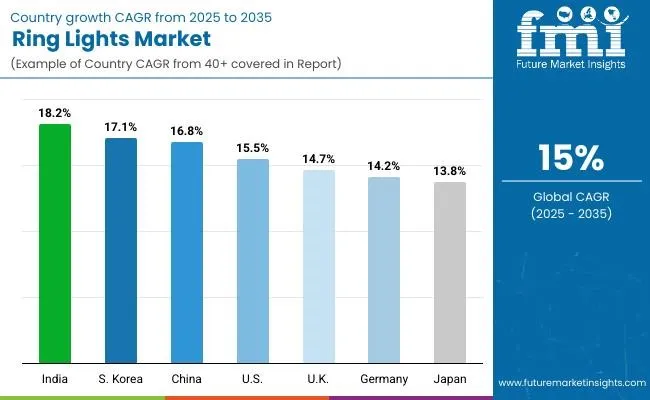
| Countries | CAGR (%) |
|---|---|
| India | 18.2 |
| South Korea | 17.1 |
| China | 16.8 |
| United States | 15.5 |
| United Kingdom | 14.7 |
| Germany | 14.2 |
| Japan | 13.8 |
The ring lights market is witnessing varied growth rates across seven key countries, reflecting diverse market dynamics and adoption drivers. India leads with the highest CAGR of 18.2%, fueled by expanding digital content creation, surging influencer presence, and rapid e-commerce growth penetrating deeper into tier-2 and tier-3 cities. South Korea follows closely with a CAGR of 17.1%, driven by advanced technological innovation, robust smartphone penetration, and a strong entertainment industry that fosters content creation demand. China’s market grows at a CAGR of 16.8%, backed by its global manufacturing dominance and an expanding middle-class consumer base eager for smart lighting solutions. The USA shows steady growth at 15.5%, supported by a mature content ecosystem and heightened remote work and streaming activities. The UK and Germany exhibit moderate yet stable growth rates of 14.7% and 14.2%, respectively, sustained by influencer marketing and professional media production gains. Japan reports the slowest CAGR of 13.8%, reflecting its mature electronics sector with consistent demand for quality lighting products.
The report covers an in-depth analysis of 40+ countries; seven top-performing OECD countries are highlighted below.
Revenue from ring lights in India is expected to grow at a CAGR of 18.2%from 2025 to 2035, driven by increased internet penetration and the popularity of social media platforms which are fostering a growing community of content creators and influencers. The rise in disposable income and expanding e-commerce channels further support market expansion at this impressive growth rate. Additionally, government initiatives aimed at digital infrastructure development are enhancing accessibility to smart ring lights. This confluence of factors fuels demand for professional lighting solutions among a young, tech-savvy population. The country's rapid urbanization and increasing smartphone adoption contribute significantly to this high CAGR growth trajectory. Major e-commerce platforms are expanding their reach to tier-2 and tier-3 cities, amplifying market penetration. The growing beauty and fashion industry further accelerates the adoption of professional lighting equipment across diverse consumer segments.
Sales for ring lights in China are projected to grow at a CAGR of 16.8% from 2025 to 2035, leveraging its position as a manufacturing powerhouse and a rapidly growing consumer base seeking quality lighting for photography, videography, and live streaming applications. The increasing middle class's preference for smart, energy-efficient lighting solutions, coupled with supportive government programs fostering technological innovation, strengthens market dynamics at this growth rate.
China's dominant e-commerce infrastructure enables easy access to products, driving wide adoption across urban and rural markets. The country's massive manufacturing capabilities ensure competitive pricing and product availability. Live streaming commerce and social media integration have become integral to Chinese consumer behavior, boosting demand. The government's support for innovation and technology adoption further reinforces the market's strong CAGR performance.
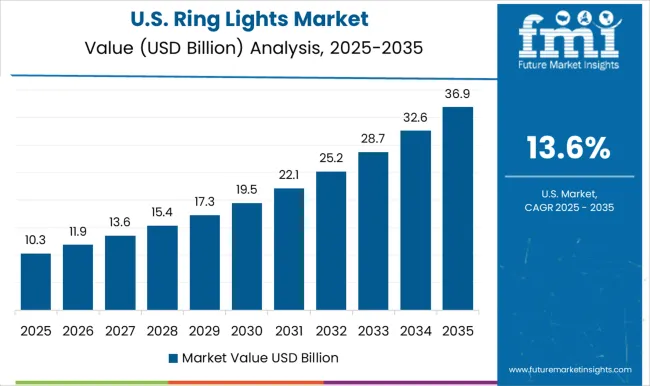
Revenue from ring lights in the USA is expected to expand at a CAGR of 15.5% from 2025 to 2035,due to mature digital content ecosystem that supports a large base of professional and amateur content creators, achieving a steady CAGR of 15.5% throughout the forecast period. High demand for smart lighting solutions arises from remote work trends and the surge in online video conferencing needs. Established retail and digital sales infrastructure enables broad product availability, while collaborations between industry players and influencers enhance market visibility. Consumers increasingly prioritize convenience, driving smart/automatic lighting adoption across various demographics. The pandemic accelerated the shift toward virtual communication, sustaining demand for professional lighting solutions. Strong purchasing power and technological adoption rates support premium product segments. The mature influencer marketing industry creates consistent demand for advanced lighting equipment.
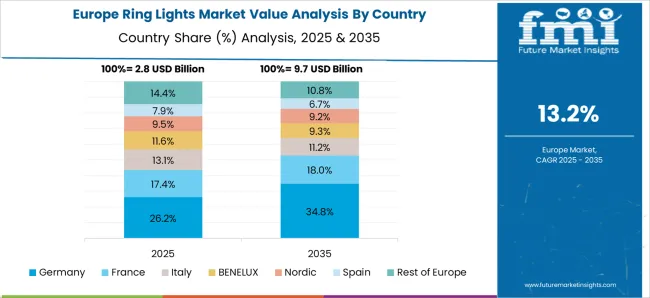
Demand for ring lights in Germany is expected to grow at a CAGR of 14.2% from 2025 to 2035, due to media and creative industries expanding their technological capabilities and professional equipment adoption. Rising investment in digital content production and increasing consumer awareness of lighting benefits support sustained demand growth. The country also experiences growing adoption among professional photographers and videographers seeking advanced lighting solutions. Germany's strong infrastructure for e-commerce and retail facilitates efficient product distribution and customer access. The presence of established photography and media production industries creates a stable demand base. Increasing disposable incomes enable consumers to invest in premium lighting equipment. The country's focus on energy efficiency aligns with LED ring light technology adoption trends.
Sales for ring lights in South Korea are projected to grow at a CAGR of 17.1% from 2025 to 2035, driven by technological advancements and extensive smartphone penetration across all demographic segments. Youthful demographics actively engage in social media content creation, amplifying demand for professional lighting solutions. The country's vibrant entertainment industry and rapid adoption of AI and IoT technologies further position smart ring lights as essential tools for creators seeking high-quality, connected lighting solutions. K-pop culture and entertainment industry influence drive consumer preferences toward professional-grade equipment. The government's support for digital innovation and smart technology adoption reinforces market growth. High internet connectivity and advanced mobile infrastructure support content creation activities. The country's tech-savvy population readily adopts innovative lighting solutions with smart features.
Demand for ring lights in Japan is expected to grow at a CAGR of 13.8% from 2025 to 2035 driven by technological sophistication and quality preferences. Increasing popularity of influencer marketing and demand for quality lighting solutions for video and selfie content support the sector's steady expansion. Technological sophistication and consumer preference for high-quality electronics uphold the market's consistent growth trajectory. The country's aging population increasingly adopts digital communication tools, creating new demand segments. Japan's reputation for electronics excellence drives consumer trust in advanced lighting products. The growing popularity of virtual meetings and online content creation sustains market demand. Strong manufacturing capabilities ensure product quality and innovation in lighting technology.
is expected to expand at a CAGR of 14.7% from 2025 to 2035, supported by increasing live streaming and online content consumption. Enhanced online retail infrastructure and marketing investments boost sales, making the UK a key market for smart and technologically advanced ring lighting solutions. The country's creative industries and media production sectors drive professional equipment demand. Brexit has encouraged local manufacturing and sourcing, potentially benefiting domestic lighting companies. The rise of remote work and virtual events sustains demand for professional lighting solutions. Strong consumer purchasing power supports premium segment growth. The mature e-commerce infrastructure enables efficient product distribution and customer reach.
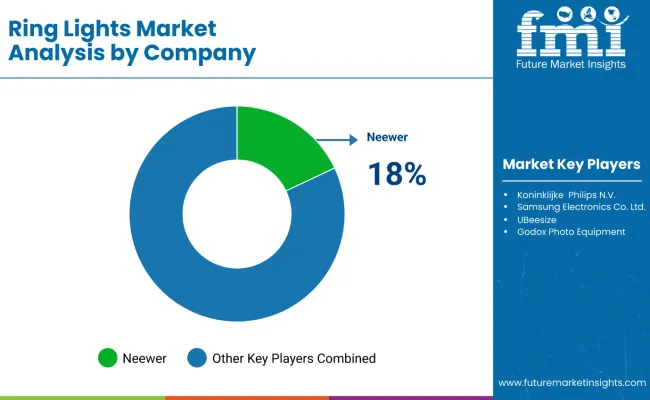
The market is characterized by intense competition among global and regional players focusing on innovation, product differentiation, and strategic partnerships to capitalize on the growing demand for professional lighting solutions. Leading companies such as Neewer, Koninklijke Philips N.V., Samsung Electronics Co. Ltd., UBeesize, and Godox Photo Equipment dominate the market by offering advanced lighting products with smart connectivity, adjustable color temperature, and energy-efficient LED technology. These companies continuously enhance their product portfolios through investment in research and development to introduce new features like Bluetooth control, smartphone app integration, and voice-activated adjustments, catering to both professional and consumer segments.
Competitive strategies also include expanding distribution networks through robust e-commerce platforms and retail partnerships to reach diverse geographical markets, particularly emerging economies such as India and China. Additionally, collaborations with social media influencers and content creators amplify brand visibility and drive product adoption among the target demographic.
| Report Attributes | Details |
|---|---|
| Quantitative Units (2025) | USD 11.9 billion |
| By Product Type | With Stand, Hanging, and Portable |
| By Product Size | Below 6 Inches, 6 to 12 Inches, 12 to 24 Inches, and More than 24 Inches |
| By Price Range | Below USD 25, USD 25 - USD 50, USD 50 - USD 75, and USD 75 and Above |
| By Technology | Smart/Automatic and Conventional |
| By Distribution Channel | Wholesalers/Distributors, Hypermarket/Supermarkets, Specialty Stores, Home Centres, Department Stores, Independent Electronic Stores, Online Retailers, and Others (direct sales, catalog sales, television shopping, mobile vendors) |
| By Application | Commercial, Studio, Photography, Video Production, Outside, Households, Macro Photography, Videography, and Makeup Application |
| By Power Source | Battery Operated, Solar Power, and AC Supply |
| Regions Covered | North America, Latin America, Europe, Asia Pacific, and Middle East & Africa |
| Countries Covered | United States, Canada, United Kingdom, Germany, France, China, India, Japan, South Korea, Australia, and 40+ countries |
| Key Players | Hensel Frontprojection System, Spectrum Aurora, Zhejiang Seming Electronic Co., Ltd., Lylight Electric Co., Limited, Bron Elektronik AG, Shamax Emporium, Shenzhen Jueying Technology Co., Ltd., Smart Vision Lights, Koninklijke Philips N.V., VOLT Lighting, Panasonic Corporation, OSRAM Sylvania Inc., Unique Lighting Systems, and Samsung Electronics Co. Ltd. |
| Additional Attributes | Market share by country and region, competitive landscape, dollar sales by value, emerging technology trends, sustainability initiatives, product innovations, strategic collaborations |
The global ring lights market is estimated to be valued at USD 11.9 billion in 2025.
The market size for the ring lights market is projected to reach USD 45.4 billion by 2035.
The ring lights market is expected to grow at a 14.3% CAGR between 2025 and 2035.
The key product types in ring lights market are with stand, hanging and portable.
In terms of product size, below 6 inches segment to command 42.7% share in the ring lights market in 2025.


Our Research Products

The "Full Research Suite" delivers actionable market intel, deep dives on markets or technologies, so clients act faster, cut risk, and unlock growth.

The Leaderboard benchmarks and ranks top vendors, classifying them as Established Leaders, Leading Challengers, or Disruptors & Challengers.

Locates where complements amplify value and substitutes erode it, forecasting net impact by horizon

We deliver granular, decision-grade intel: market sizing, 5-year forecasts, pricing, adoption, usage, revenue, and operational KPIs—plus competitor tracking, regulation, and value chains—across 60 countries broadly.

Spot the shifts before they hit your P&L. We track inflection points, adoption curves, pricing moves, and ecosystem plays to show where demand is heading, why it is changing, and what to do next across high-growth markets and disruptive tech

Real-time reads of user behavior. We track shifting priorities, perceptions of today’s and next-gen services, and provider experience, then pace how fast tech moves from trial to adoption, blending buyer, consumer, and channel inputs with social signals (#WhySwitch, #UX).

Partner with our analyst team to build a custom report designed around your business priorities. From analysing market trends to assessing competitors or crafting bespoke datasets, we tailor insights to your needs.
Supplier Intelligence
Discovery & Profiling
Capacity & Footprint
Performance & Risk
Compliance & Governance
Commercial Readiness
Who Supplies Whom
Scorecards & Shortlists
Playbooks & Docs
Category Intelligence
Definition & Scope
Demand & Use Cases
Cost Drivers
Market Structure
Supply Chain Map
Trade & Policy
Operating Norms
Deliverables
Buyer Intelligence
Account Basics
Spend & Scope
Procurement Model
Vendor Requirements
Terms & Policies
Entry Strategy
Pain Points & Triggers
Outputs
Pricing Analysis
Benchmarks
Trends
Should-Cost
Indexation
Landed Cost
Commercial Terms
Deliverables
Brand Analysis
Positioning & Value Prop
Share & Presence
Customer Evidence
Go-to-Market
Digital & Reputation
Compliance & Trust
KPIs & Gaps
Outputs
Full Research Suite comprises of:
Market outlook & trends analysis
Interviews & case studies
Strategic recommendations
Vendor profiles & capabilities analysis
5-year forecasts
8 regions and 60+ country-level data splits
Market segment data splits
12 months of continuous data updates
DELIVERED AS:
PDF EXCEL ONLINE
A Detailed Global Analysis of Brand Share for the Ring Lights Market
Ring Pull Cap Market Size and Share Forecast Outlook 2025 to 2035
Ring Main Unit Market Size and Share Forecast Outlook 2025 to 2035
Ring Panel Filters Market Size and Share Forecast Outlook 2025 to 2035
Ringworm Treatment Market - Growth & Drug Innovations 2025 to 2035
Ring Rolling Products Market Size, Growth, and Forecast 2025 to 2035
Market Share Distribution Among Ring Panel Filters Providers
Ring Laser Gyroscope Market
String Power Conversion System(PCS) Market Size and Share Forecast Outlook 2025 to 2035
Moringa Tea Market Size and Share Forecast Outlook 2025 to 2035
Curing Oven Market Analysis Size and Share Forecast Outlook 2025 to 2035
String PV Inverter Market Size and Share Forecast Outlook 2025 to 2035
Spring Applied Clutches Market Size and Share Forecast Outlook 2025 to 2035
String Inverter Market Size and Share Forecast Outlook 2025 to 2035
Moringa Oil Antioxidants Market Size and Share Forecast Outlook 2025 to 2035
Syringes and Injectable Drugs Packaging Market Size and Share Forecast Outlook 2025 to 2035
Syringe Scale Magnifiers Market Size and Share Forecast Outlook 2025 to 2035
Boring Bars Market Size and Share Forecast Outlook 2025 to 2035
Syringe Labels Market Size and Share Forecast Outlook 2025 to 2035
Stringer Pallets Market Size and Share Forecast Outlook 2025 to 2035

Thank you!
You will receive an email from our Business Development Manager. Please be sure to check your SPAM/JUNK folder too.
Chat With
MaRIA