Ring Rolling Products Market Forecast and Outlook 2025 to 2035

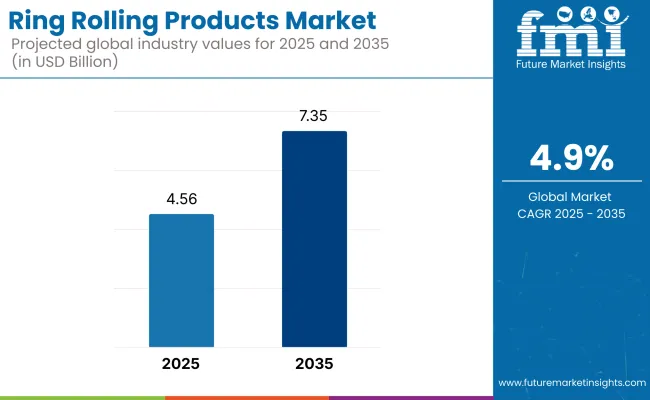
The global ring rolling products market is valued at USD 4.56 billion in 2025 and projected to reach USD 7.35 billion by 2035, growing at a 4.9% CAGR. This growth is powered by demand from aerospace, wind energy, and electric vehicle (EV) industries.
Ring Rolling Products Market

Countries like China, India, and the United States remain key manufacturing hubs, supported by reshoring trends and major infrastructure policies. Companies are prioritizing materials like high-strength steel and titanium, while segments such as slew bearings and turbine discs drive demand.

Rising demand for lightweight, corrosion-resistant parts in aerospace and EVs is accelerating the adoption of nickel-based alloys and composite-metal hybrids. Regulatory mandates in the U.S. (OSHA, EPA), EU (REACH, Energieeffizienzgesetz), and Asia (ISHA, METI, CPCB) are pushing manufacturers to adopt low-emission forging, automation, and quality-compliant processes. Radial axial rolling is the most used technology, especially for precision components in wind turbines and aerospace applications.

Looking ahead, investment in AI-enabled quality control, smart forging systems, and localized supply chains will define industry evolution. The fastest-growing sub-segment by size will be 1000 to 2000 mm rings, aligned with wind turbine deployment. Forgital Group, SMS Group, and Scot Forge are among the dominant players, accounting for over 60% of market share. Regional priorities will differ-USA focuses on automation, Western Europe on sustainability, and Japan/South Korea on compact, cost-effective forging solutions.

Ring Rolling Products Market Analysis by Top Investment Segments

By Product, Slew Bearings and Turbine Discs Anchor Growth Across Critical Infrastructure

The slew bearings and turbine discs segments form the backbone of high-load applications in wind power, aerospace, and construction equipment. Slew bearings are vital for rotational movement in large assemblies, such as wind turbine nacelles and cranes, while turbine discs find use in both energy generation and propulsion systems.

Global investments in renewable energy infrastructure-particularly offshore wind projects-have spurred an uptick in demand for large, high-precision ring-rolled components. Additionally, the aerospace sector’s ongoing fleet upgrades and the electrification of construction machinery are expanding applications for seamless rings and gear blanks.

The smooth ring subsegment is gaining popularity in oil & gas pipelines and chemical processing due to its structural uniformity and reliability under pressure. Similarly, pressure vessels, requiring high strength and crack resistance, are critical to energy storage and hydrogen production.

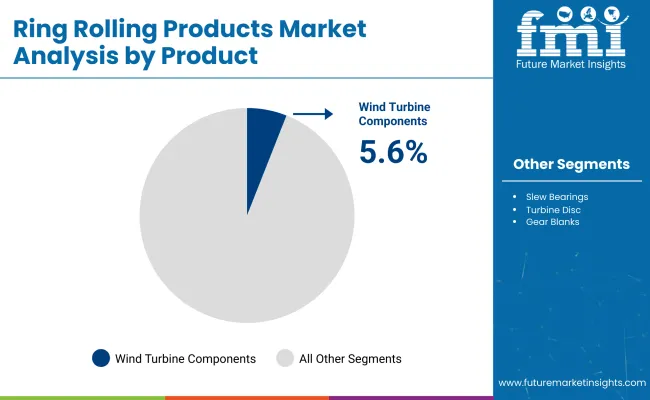
Product Segment CAGR (2025 to 2035)
Wind Turbine Components 5.6%

By Material Used, Nickel-Based Alloys Set to Outpace Steel in High-Performance Segments

Ring Rolling Products Market By Material

Material CAGR (2025 to 2035)
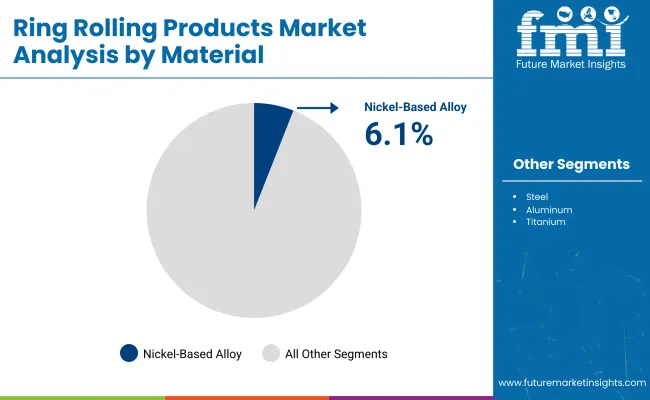
Nickel-Based Alloy 6.1%

Steel remains the primary material used in ring rolling due to its mechanical strength, affordability, and ease of machining. It dominates general-purpose applications across automotive, railways, and construction. However, a major shift is underway as nickel-based alloys gain momentum-particularly in aerospace engines, nuclear reactors, and deep-sea oil rigs-thanks to their resistance to extreme temperatures, fatigue, and corrosion.

The increased demand for jet engine parts and high-efficiency turbines is driving this material's uptake. In parallel, titanium and aluminum alloys are becoming go-to materials for lightweight EV platforms and aircraft frames, helping manufacturers reduce fuel consumption and emissions. Meanwhile, composite-metal hybrids (e.g., aluminum-steel blends) are attracting attention for niche use in marine and defense sectors where both weight savings and structural integrity are paramount.
By Production Technology, Vertical Ring Rolling Emerges as the Future of Large-Scale Forging

Ring Rolling Products Market By Product

Technology CAGR (2025 to 2035)
Vertical Ring Rolling 5.3%

The radial axial rolling process has traditionally dominated due to its ability to deliver excellent concentricity and structural integrity-critical in aerospace and wind applications. However, vertical ring rolling is now gaining rapid adoption, particularly in the manufacturing of large-diameter rings required for wind turbines, offshore platforms, and heavy machinery. Its ability to accommodate larger and thicker ring profiles, combined with improved material utilization and energy efficiency, is making it the preferred choice in greenfield projects.

Technological advancements-such as AI-integrated rolling systems and smart defect detection-are enhancing the appeal of vertical systems. Meanwhile, horizontal ring rolling continues to find relevance in automotive and rail sectors due to its efficiency and suitability for high-volume, medium-sized rings. Manufacturers are increasingly investing in hybrid rolling facilities that integrate multiple technologies for flexibility in batch size and ring geometry.

By End Use, Wind Power Sector Leads with Demand for Lightweight and Durable Rings

The wind power industry is the fastest-growing end-use sector for ring rolling products. As nations accelerate their shift to renewable energy, the deployment of offshore wind farms-which require large, durable bearing rings for turbines-has surged. These components must endure high mechanical stress, corrosion, and harsh marine conditions.

Governments across Europe, China, and the USA are backing this expansion with clean energy policies and subsidies, making wind the most lucrative application. In aerospace, ring-rolled parts are critical for jet engines, landing gear, and structural assemblies-and their importance is increasing as manufacturers adopt lighter, stronger alloys for next-gen aircraft.

Automotive demand is supported by EV production, where ring-rolled components support lighter, more efficient drivetrain and suspension systems. The rail and marine sectors continue to demand forged rings for axle, coupling, and propulsion systems, though growth is more stable than explosive.

End Use CAGR (2025 to 2035)
Wind Power 6.2%

FMI Survey and Interviews with Ring Rolling Products Industry Stakeholders

Key Priorities of Stakeholders

Global Trends

  • Safety & Quality Compliance: 82% of stakeholders viewed adherence to industry quality and safety guidelines as a “critical” priority.
  • Reliability & Durability: 76% emphasized the need to meet performance requirements using high-strength materials and precision engineering in aerospace and industrial applications.

Regional Variance

  • USA: 69% emphasized the integration of automated defect detection technology to improve quality control vs. 40% in Japan.
  • Western Europe: 80% found carbon footprint minimization in manufacturing to be a priority, aligning with tough environmental regulations vs. 55% in the USA.
  • Japan/South Korea: Japan/South Korea: 63% emphasized miniaturization and high-strength alloys for space-limited applications, compared to only 30% of USA manufacturers prioritizing the same.

The company is adopting new advanced manufacturing technologies

Major Trends

  • USA: 58% of manufacturers claimed the use of AI-optimized process optimization for improved yield rates.
  • Western Europe: 54% of producers adopted 3D printing and advanced metal matrix composites for custom ring rolling applications;
  • Japan: A mere 28% adopted smart manufacturing due to cost constraints and dependence on conventional forging methods.
  • South Korea: 42% invested in robotic automation, especially for high-precision aerospace applications.

Perception of ROI (Return on Investment)

  • 72% of USA stakeholders considered automation a “necessary investment” for their competitiveness.
  • 39% of Japan's producers continued employing traditional manual processes due to lower short-term operational expenses.

Material Choices

Consensus

High-Strength Steel Alloys: Due to their superior tensile strength and fatigue resistance, 67% of global stakeholders selected these.

Regional Material Choices

  • Western Europe: 57% selected titanium-based alloys for low-weight, corrosion-resistant applications, compared with the 40% global average.
  • Japan/South Korea: 46% preferred hybrid composites (steel-aluminum combinations) to balance cost and toughness.
  • USA: The Midwest saw a 25% increase in investment in next-generation materials, while 64% of respondents preferred nickel-based alloys.

Price Sensitivity and Industry Pressures

Shared Challenges

85% of surveyed participants indicated rising raw material and energy prices as a major concern.

Regional Price Sensitivities

  • USA & Western Europe: Consumers were 62% willing to pay a premium (10-20%) for stronger & sustainable attributes.
  • Japan & South Korea: cost-effective solutions requested by 70% of respondents ($3,000/ton or less) rather than 20% in Western Europe
  • In South Korea, 48% of distributors preferred leasing industrial ring rolling machines, compared to 22% in the USA.

Supply Chain & Value Chain Breakdowns

Manufacturers

  • USA: 55% dealt with supply chain delays for essential materials, primarily nickel and titanium.
  • Western Europe: 52% reported regulatory hurdles to sustainability certification (in this case, the EU Green Deal).
  • Japan: 60% cited weakness in internal demand due to an aging industrial base.

Distributors

  • USA: 65% experienced difficulties due to reliance on overseas raw material suppliers.
  • Western Europe: Half cited competitive pressure from lower-cost Asian producers.
  • Japan/South Korea: 58% had difficulties in delivering to outlying industrial areas.

Industrial Operators (End-Users)

  • USA: 42% cited high maintenance expenses as a main issue.
  • Western Europe: 44% fought to retro-fit existing equipment to enable advanced manufacturing processes.
  • Japan: 55% mentioned a lack of technical support for digitally integrated ring rolling systems.

Investment Priorities for the Future

Global Alignments

70% of world manufacturers intend to invest in automation, AI, and IoT-ready production lines.

Regional Differences

  • USA: 58% planned to upgrade modular production systems for tailored ring rolling components.
  • Western Europe: 56% highlighted low-emission and energy-efficient production, such as solar-powered induction furnaces.
  • Japan/South Korea: 48% focused on wireless and compact forging facilities for space-limited urban industries.

Regulatory Compliance: Shaping an Expanding Industry

  • USA: 63% noted OSHA and EPA regulations as a primary driver for investment in cleaner manufacturing.
  • Western Europe: 81% cited EU sustainability laws as an important consideration for selling a product priced at a premium.
  • Japan/South Korea: Only a third of stakeholders see regulatory frameworks as a significant purchasing influence due to weak enforcement policies.

Conclusion: Divergence of the Industry vs. Common Patterns

Key Takeaways

Strong Consensus: There persists a general importance of safety compliance, durability, and cost containment.

Key Variances

  • USA: IoT and automation focus vs. Japan/South Korea: cost-effective, traditional forging technologies
  • Western Europe: Leaders in sustainability and energy-efficient materials.
  • Asia: pragmatic; some mixed material uptake.

Strategic Insight

A single uniform solution is not feasible, as market demands vary by region. Firms must regionally customize their offerings:

  • USA: High-level automation and AI-based production
  • Western Europe: Materials that are sustainable and energy-efficient.
  • Japan & South Korea: Affordable, space-saving factory solutions

That knowledge will shape 2025 and beyond into product development, pricing, and geographical expansion efforts for the industries.

Government Regulations

Countries Regulatory Impact & Mandatory Certifications
United States
  • OSHA (Occupational Safety and Health Administration): Employee safety during metal forging and industrial processes
  • EPA (Environmental Protection Agency) Regulations: Imposes restrictions on emissions and waste disposal applicable to metal forging processes.
  • ASTM & ASME Standards: Required for metallic components in aerospace, automotive, and energy industries.
  • Buy America Act: Is more of a carrot than a stick in motivating domestic sourcing of critical minerals and affecting import dependence.
United Kingdom
  • The UKCA marking will replace the CE marking for industrial products after Brexit.
  • Health and Safety Executive (HSE): In the UK, regulates worker protection legislation in industrial forging.
  • BS EN Standards: Forged metal components used in aerospace, defence, and construction must adhere to these standards.
  • CRC (Carbon Reduction Commitment) Scheme: Encourages reductions in carbon emissions by manufacturers.
France
  • NF Mark Certification: Ensures that metal products are of high quality and safe.
  • ICPE (Installations classées pour la protection de l'environnement): Regulates the emission and disposal of waste for large industries.
  • Aerospace Standards (EN 9100): Required for aerospace and defence suppliers.
  • EPR (Extended Producer Responsibility) Law: Ensures sustainability measures in production
Germany
  • DIN standards (Deutsches Institut für Normung): Regulates the composition of the material and forging tolerance.
  • TÜV Certification: Required for compliance with safety requirements in industrial machinery and metal manufacturing.
  • REACH (Registration, Evaluation, Authorization, and Restriction of Chemicals): restrictions on the use of harmful chemicals in industrial production (EU)
  • Technische Gesetzgebung-Energieeffizienzgesetz (Energy Efficiency Law) Fokussierung der energieeinsparenden Maßnahmen in der Metallindustrie
Italy
  • UNI (Ente Nazionale Italiano di Unificazione) Standards: Provide standards for the quality and safety of products within the field of metal forging.
  • CE marking is essential for the sale of products in the EU industry.
  • Emission Trading System, ETS: Regulates carbon emissions from industry processes.
  • 03) RINA Certification: Required for marine and heavy industry components.
South Korea
  • KOSHA (Korea Occupational Safety & Health Agency): Controls operator safety in the production of metals.
  • Complying leads to KS (Korean Industrial Standards) precision forging and steel products.
  • Green New Deal policy: Incentives for eco-friendly businesses and carbon-neutrality targets.
  • ISHA (Industrial Safety & Health Act): This law requires workplace safety measures on metalworking.
Japan
  • JIS (Japanese Industrial Standards): This standard governs material composition, forging tolerances, and quality standards.
  • Japan: Carbon Neutrality Targets (2050) - Energy-saving & low-carbon production
  • METI (Ministry of Economy, Trade and Industry) Rules: Covers metal imports, energy consumption, and safety.
  • JIS Q 9100, applying to aerospace and defence supply chains
China
  • CCC (China Compulsory Certification): For strategic industries metal parts.
  • Green Manufacturing Plan of the Nation: Promotes environmentally friendly practices in metal processing and forging.
  • MIIT (Ministry of Industry & Information Technology) Policies: Refers to regulations concerning steel production and environmental policies.
  • GB: Specifically designed quality and test standards for forged metal components.
India
  • BIS (Bureau of Indian Standards) Certification: Ensures compliance with national standards for quality and safety.
  • CPCB (Central Pollution Control Board) Rules: Emissions and waste from metal industries
  • Factory Act Compliance: Mandates safe working conditions in industries, especially in forging and heavy.

Industry Evolution

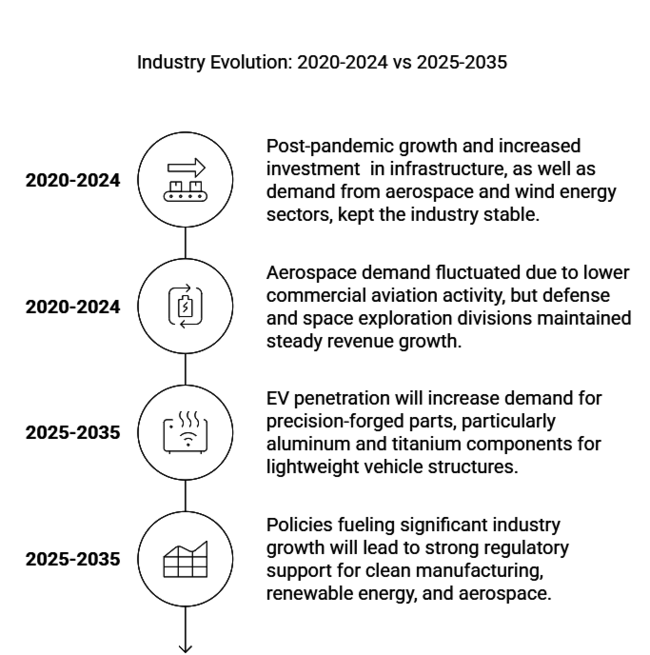
Ring Rolling Products Market Industry Evolution 2020-2024 Vs 2025-2035

2020 to 2024 2025 to 2035
Post-pandemic growth and increased investment in infrastructure, as well as demand from aerospace and wind energy sectors, kept the industry stable. As far as the scope of automation, advanced materials, and heavy funding in clean energy and electric mobility go, the industry is bound to evolve at a rapid pace.
Disruptions from COVID-19 have caused temporary shortages of components in the supply chain and labor shortages, varying prices of raw materials, and disrupted production cycles. Supply chains will become stable: manufacturers will localize production and adopt digital supply chain management to build resilience.
All over the world, stimulus packages implemented by governments alongside strengthening manufacturing, automotive, and energy sectors led to increased demand for ring rolling products. Policies fuelling significant industry growth will lead to strong regulatory support for clean manufacturing, renewable energy, and aerospace.
Aerospace demand fluctuated due to lower commercial aviation activity, but defense and space exploration divisions maintained steady revenue growth. Strong recovery and innovation of aerospace sector, notably lightweight and high-performance alloys for next-gen aircraft.
Automotive demand was erratic amid chip shortages and supply chain issues, but EV growth propped up the industry. EV penetration will increase demand for precision-forged parts, particularly aluminium and titanium components for lightweight vehicle structures.
Investment in wind energy continued, especially in Europe and China, leading to increased demand for large seamless rings. Wind power is another driving force, with offshore wind farms and the next generation of turbine designs exploiting a new class of high-performance rolling components.

Country-Wise Analysis

Ring Rolling Products Market Country Wise

United States

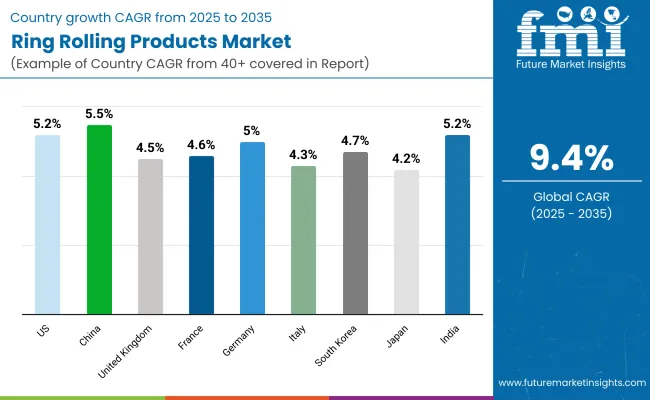
The ring rolling products industry is witnessing growth in the United States due to the presence of strong automotive, aerospace, and defence industries. The estimated incremental opportunity for the industry in the USA shall remain 5.2%. Demand for such components is driven by the Biden administration's infrastructure bill and greater investment in renewable energy projects.

Higher demand for strong metal rings is also being created by NASA and private space programs (e.g. SpaceX, Blue Origin). Strict quality and waste reduction regulations from OSHA, EPA, and ASTM are driving manufacturers toward high-end automation and AI-based defect detection. This growth in domestic production and reshoring efforts strengthens the USA industry as a key hub for ring rolling products.

United Kingdom

The UK ring rolling sector is expanding, with rising demand in the aerospace, defense, and offshore wind power sectors. Post-Brexit trade policies have also promoted local production, reducing dependence on EU imports. The UKCA marking has taken the place of the CE marking, requiring businesses to re-evaluate their compliance strategies.

This has led to a focus on sustainability, with the UK government’s net-zero ambition (looking toward 2050) driving demand for a low-carbon manufacturing offering. The aerospace sector, still a major user of high-precision forged parts, is dominated by players such as Rolls-Royce and BAE Systems. Still, instability in the economy and fluctuating steel prices can cause issues. FMI opines that the United Kingdom rolling ring products industry will grow at nearly 4.5% CAGR through 2025 to 2035.

France

France has a strong industry for ring rolling products, primarily supported by the aerospace, automotive, and defence industries. As home of Airbus, France has very strict aviation standards (EN 9100) demanding very high quality on forged parts. In addition, heavy industries are subject to strong emissions control obligations under ICPE in France, which drives manufacturers to greener production technologies.

There is also enforcement of recycling in metal forging through the Extended Producer Responsibility (EPR) Law. France’s strong industrial base ensures stable demand, but high energy costs and competition from low-cost manufacturers in Asia and Eastern Europe may slow growth. FMI opines that the France rolling ring products industry will grow at nearly 4.6% CAGR through 2025 to 2035.

Germany

Its strong automotive, aerospace, and industrial sectors make Germany an important industry in terms of high-performance ring rolling products. German carmakers like Volkswagen, BMW, and Mercedes-Benz are propelling higher demand for precision-forged parts, especially for electric vehicles. The TÜV certification ensures that the produced forged parts meet high safety and strength requirements.

Germany has been actively addressing these issues by promoting greener manufacturing through the Energieeffizienzgesetz (Energy Efficiency Law), which encourages manufacturers to invest in low-carbon and energy-efficient technologies. However, growing labor costs and raw material scarcity are hindering the industry growth. FMI opines that the Germany’s rolling ring products industry will grow at nearly 5.0% CAGR through 2025 to 2035.

Italy

The Italian automotive, machinery, and shipbuilding industry provides considerable support for the ring rolling products industry. The country complies with EU CE Marking and UNI Standards, ensuring its metal forging products maintain high standards. It provides RINA certification for the supply of forged rings to Italy's heavy marine and defence sectors.

Investment in green forging technologies and automated manufacturing may enable the Italian industry to remain competitive over the next 10 years. FMI opines that the Italy’s rolling ring products industry will grow at nearly 4.3% CAGR through 2025 to 2035.

South Korea

The South Korean ring rolling industry is mainly driven by the shipbuilding, automotive, and aerospace sectors in the country. Demand for high-strength, corrosion-resistant metal rings is driven by companies including Hyundai Heavy Industries and Samsung Heavy Industries. KS (Korean Industrial Standards) controls manufacturing quality, enabling high precision for industrial applications. Additionally, South Korea launched a Green New Deal, aiding manufacturers to transition to eco-friendly forging methods.

Robotic automation, Internet of Things (IoT)-based forging technologies, investments in HMLV (high, medium, and low volume) forging tools, and research partnerships for new materials will all make forging better in terms of quality, productivity, and yield. However, growth could be slowed down by a reliance on imported raw materials and trade risks. FMI opines that the South Korea’s rolling ring products industry will grow at nearly 4.7% CAGR through 2025 to 2035.

Japan

Precision engineering, quality control, and high safety standards dominate Japan's industry for ring rolling products (JIS and JIS Q 9100 for aerospace). However, the high cost of manufacturing and low rate of adoption of automation slow down the progress to an extent. Japan’s industrial sector, despite an aging infrastructure, has been upgrading its forging capabilities, focusing on compact and high-strength metal solutions.

Moreover, manufacturers are likely to take on low-emission forging processes soon under Japan's 2050 Carbon Neutrality Targets, providing an opportunity for sustainable innovation. FMI opines that the Japan’s rolling ring products industry will grow at nearly 4.2% CAGR through 2025 to 2035.

China

The rapidly increasing investments in various industrial sectors, including automotive and construction, as well as renewable energy, are some of the factors likely to increase the scope of ring rolling products. China holds the largest industry for ring rolling products, closely followed by North America and Europe.

China’s vast steel-making capacity offers competitive pricing, but increasing environmental regulations and trade tensions with Western economies may impact exports. Investment in next-generation automation, AI-based quality control, and high-performance materials will remain key in keeping China ahead of global production. FMI opines that the China rolling ring products industry will grow at nearly 5.5% CAGR through 2025 to 2035.

India

FMI opines that the India rolling ring products industry will grow at nearly 5.2% CAGR through 2025 to 2035. The ring rolling sector in India has been gaining steam as government infrastructure initiatives, automotive industry growth, and defence production take off. The Make in India campaign is encouraging local manufacture while reducing import dependence.

Supply chain congestion and inconsistent enforcement of rules can present hurdles, too. Increasing foreign direct investment (FDI) in the manufacturing sector is likely to lead to healthy demand for precision-forged components over the next 10 years.

Competitive Landscape

In the ring rolling products industry, players concentrate on pricing strategy, innovation, service, geographic presence, and strategic partnerships. Price-wise, it may be low, but firms still have to cope with high-class material without breaking the bank. Large players are heavily investing in technologies like new forging methods, AI-based quality inspection, and lightweight alloys for aerospace and EV firms.

Companies in this sector align with OEMs and energy players to solidify supply chains, while developments in emerging industries propel revenues. It not only contributes to global carbon reduction efforts but also learns about sustainability practices, from low-emission production to recycled content.

Key Players

  • ThyssenKrupp AG
  • Siemens AG
  • Mitsubishi Heavy Industries, Ltd.
  • Nippon Steel & Sumitomo Metal Corporation
  • Bharat Forge Limited
  • Zollern GmbH & Co. KG
  • SMS group GmbH
  • China First Heavy Industries
  • Kuhn Special Steel North America, Inc.
  • Precision Rings Inc.
  • Fountaintown Forge, Inc.
  • Seamless Rolled Rings & Open Die Forgings
  • Ringmasters LLC
  • All Metals & Forge Group, LLC
  • Wuxi Paike New Materials Technology Co., Ltd.
  • Farinia Group
  • Scot Forge

Ring Rolling Products Market Industry Analysis by Segmentation

By Product:

The industry is segmented into slew bearings, turbine disc, gear blanks, aerospace components, wind turbine components, seamless ring and pressure vessels

By Material Used:

It is fragmented into steel, aluminum, titanium, nickel based alloy and others

By Production Technology:

It is segmented into horizontal, vertical and radial axial

By End Use:

It is segmented among automotive, aerospace, railway industry, marine, oil & gas, wind power, construction and others

By Size:

It is segmented as Up to 500 mm, 500 to 1000 mm, 1000 to 2000 mm, 2000 to 3000 mm, 3000 to 4000 mm and 4000 to 5000 mm

By Region:

The sector is fragmented among North America, Latin America, East Asia, South Asia and Pacific, Western Europe, Eastern Europe, Central Asia, Russia and Belarus, Balkan and Baltics Countries, Middle East and Africa

Table of Content

  1. Executive Summary
  2. Market Overview
  3. Key Market Trends
  4. Key Success Factors
  5. Global Market Demand Analysis 2020 to 2024 and Forecast, 2025 to 2035
  6. Global Market - Pricing Analysis
  7. Global Market Demand (in Value or Size in USD Million) Analysis 2020 to 2024 and Forecast, 2025 to 2035
  8. Market Background
  9. Global Market Analysis 2020 to 2024 and Forecast 2025 to 2035, By Product
    • Slew Bearings
    • Turbine Disk
    • Gear Blanks
    • Aerospace Component
    • Wind Turbine Components
    • Seamless Ring
    • Pressure Vessels
  10. Global Market Analysis 2020 to 2024 and Forecast 2025 to 2035, By Size
    • Up to 500 mm
    • 500 to 1000 mm
    • 1000 to 2000 mm
    • 2000 to 3000 mm
    • 3000 to 4000 mm
    • 4000 to 5000 mm
  11. Global Market Analysis 2020 to 2024 and Forecast 2025 to 2035, By Material Used
    • Steel
    • Aluminum
    • Titanium
    • Nickel-based Alloy
    • Others
  12. Global Market Analysis 2020 to 2024 and Forecast 2025 to 2035, By Production Technology
    • Horizontal Ring Rolling
    • Vertical Ring Rolling
    • Radial-Axial Ring Rolling
  13. Global Market Analysis 2020 to 2024 and Forecast 2025 to 2035, By End Use
    • Automotive Industry
    • Aerospace Industry
    • Railway Industry
    • Marine
    • Oil and Gas
    • Wind Power
    • Construction
    • Others
  14. Global Market Analysis 2020 to 2024 and Forecast 2025 to 2035, By Region
    • North America
    • Latin America
    • Western Europe
    • Eastern Europe
    • Central Asia
    • Russia & Belarus
    • Balkan & Baltic Countries
    • Middle East and Africa
    • East Asia
    • South Asia and Pacific
  15. North America Market Analysis 2020 to 2024 and Forecast 2025 to 2035
  16. Latin America Market Analysis 2020 to 2024 and Forecast 2025 to 2035
  17. Western Europe Market Analysis 2020 to 2024 and Forecast 2025 to 2035
  18. Eastern Europe Market Analysis 2020 to 2024 and Forecast 2025 to 2035
  19. Central Asia Market Analysis 2020 to 2024 and Forecast 2025 to 2035
  20. Russia & Belarus Market Analysis 2020 to 2024 and Forecast 2025 to 2035
  21. Balkan & Baltic Countries Market Analysis 2020 to 2024 and Forecast 2025 to 2035
  22. South Asia & Pacific Market Analysis 2020 to 2024 and Forecast 2025 to 2035
  23. East Asia Market Analysis 2020 to 2024 and Forecast 2025 to 2035
  24. Middle East and Africa Market Analysis 2020 to 2024 and Forecast 2025 to 2035
  25. Country Wise Market Analysis
  26. Market Structure Analysis
  27. Competition Analysis
    • ThyssenKrupp AG
    • Siemens AG
    • Mitsubishi Heavy Industries, Ltd.
    • Nippon Steel & Sumitomo Metal Corporation
    • Bharat Forge Limited
    • Zollern GmbH & Co. KG
    • SMS Group GmbH
    • China First Heavy Industries
    • Kuhn Special Steel North America, Inc.
    • Precision Rings Inc.
    • Fountaintown Forge, Inc.
    • Seamless Rolled Rings & Open Die Forgings
    • Ringmasters LLC
    • All Metals & Forge Group, LLC
    • Wuxi Paike New Materials Technology Co., Ltd.
    • Jiangsu Zhuhong Forging Co., Ltd.
    • Jiangyin Hengrun Heavy Industries Co., Ltd.
    • Suzhou Seamay Metal Materials Co., Ltd.
    • Zhangjiagang Zhongzhong Import & Export Co., Ltd.
  28. Assumptions and Acronyms Used
  29. Research Methodology

List of Tables

  • Table 01: Global Market Value (USD Million) and Volume (Units) Historical Data 2020 to 2035 and Forecast 2025 to 2035 By Product
  • Table 02: Global Market Value (USD Million) & Volume (Units) Historical Data 2020 to 2035 and Forecast 2025 to 2035 by Size
  • Table 03: Global Value (USD Million) and Volume (Units) Historical Data 2020 to 2035 and Forecast 2025 to 2035 By Material Used
  • Table 04: Global Value (USD Million) and Volume (Units) Historical Data 2020 to 2035 and Forecast 2025 to 2035 By Production Technology
  • Table 05: Global Market Value (USD Million) & Volume (Units) Historical Data 2020 to 2035 and Forecast 2025 to 2035 by End Use
  • Table 06: Global Value (USD Million) and Volume (Units) Historical Data 2020 to 2035 and Forecast 2025 to 2035 By Region
  • Table 07: Global Value (USD Million) and Volume (Units) Historical Data 2020 to 2035 and Forecast 2025 to 2035 By Region
  • Table 08: North America Market Value (USD Million) and Volume (Units) Historical Data 2020 to 2035 and Forecast 2025 to 2035 By Country
  • Table 09: North America Market Value (USD Million) and Volume (Units) Historical Data 2020 to 2035 and Forecast 2025 to 2035 By Product
  • Table 10: North America Value (USD Million) and Volume (Units) Historical Data 2020 to 2035 and Forecast 2025 to 2035 By Material Used
  • Table 11: North America Value (USD Million) and Volume (Units) Historical Data 2020 to 2035 and Forecast 2025 to 2035 By Production Technology
  • Table 12: North America Market Value (USD Million) & Volume (Units) Historical Data 2020 to 2035 and Forecast 2025 to 2035 by
  • Table 13: North America Market Value (USD Million) & Volume (Units) Historical Data 2020 to 2035 and Forecast 2025 to 2035 by Size
  • Table 14: Latin America Size (USD Million) and Volume (Units) Analysis and Forecast By Country, 2018 to 2033
  • Table 15: Latin America Market Value (USD Million) and Volume (Units) Historical Data 2020 to 2035 and Forecast 2025 to 2035 By Product
  • Table 16: Latin America Value (USD Million) and Volume (Units) Historical Data 2020 to 2035 and Forecast 2025 to 2035 By Material Used
  • Table 17: Latin America Value (USD Million) and Volume (Units) Historical Data 2020 to 2035 and Forecast 2025 to 2035 By Production Technology
  • Table 18: Latin America Market Value (USD Million) & Volume (Units) Historical Data 2020 to 2035 and Forecast 2025 to 2035 by
  • Table 19: Latin America Market Value (USD Million) & Volume (Units) Historical Data 2020 to 2035 and Forecast 2025 to 2035 by Size
  • Table 20: Western Europe Market Size (USD Million) and Volume (Units) Analysis and Forecast By Country, 2018 to 2033
  • Table 21: Western Europe l Market Value (USD Million) and Volume (Units) Historical Data 2020 to 2035 and Forecast 2025 to 2035 By Product
  • Table 22: Western Europe Value (USD Million) and Volume (Units) Historical Data 2020 to 2035 and Forecast 2025 to 2035 By Material Used
  • Table 23: Western Europe Value (USD Million) and Volume (Units) Historical Data 2020 to 2035 and Forecast 2025 to 2035 By Production Technology
  • Table 24: Western Europe Market Value (USD Million) & Volume (Units) Historical Data 2020 to 2035 and Forecast 2025 to 2035 by
  • Table 25: Western Europe Market Value (USD Million) & Volume (Units) Historical Data 2020 to 2035 and Forecast 2025 to 2035 by Size
  • Table 26: Eastern Europe Size (USD Million) and Volume (Units) Analysis and Forecast By Country, 2018 to 2033
  • Table 27: Eastern Europe Market Value (USD Million) and Volume (Units) Historical Data 2020 to 2035 and Forecast 2025 to 2035 By Product
  • Table 28: Eastern Europe Value (USD Million) and Volume (Units) Historical Data 2020 to 2035 and Forecast 2025 to 2035 By Material Used
  • Table 29: Eastern Europe Value (USD Million) and Volume (Units) Historical Data 2020 to 2035 and Forecast 2025 to 2035 By Production Technology
  • Table 30: Eastern Europe Market Value (USD Million) & Volume (Units) Historical Data 2020 to 2035 and Forecast 2025 to 2035 by
  • Table 31: Eastern Europe Market Value (USD Million) & Volume (Units) Historical Data 2020 to 2035 and Forecast 2025 to 2035 by Size
  • Table 32: Central Asia l Market Value (USD Million) and Volume (Units) Historical Data 2020 to 2035 and Forecast 2025 to 2035 By Product
  • Table 33: Central Asia Value (USD Million) and Volume (Units) Historical Data 2020 to 2035 and Forecast 2025 to 2035 By Material Used
  • Table 34: Central Asia Value (USD Million) and Volume (Units) Historical Data 2020 to 2035 and Forecast 2025 to 2035 By Production Technology
  • Table 35: Central Asia Market Value (USD Million) & Volume (Units) Historical Data 2020 to 2035 and Forecast 2025 to 2035 by
  • Table 36: Central Asia Market Value (USD Million) & Volume (Units) Historical Data 2020 to 2035 and Forecast 2025 to 2035 by Size
  • Table 37: Russia & Belarus Market Value (USD Million) and Volume (Units) Historical Data 2020 to 2035 and Forecast 2025 to 2035 By Product
  • Table 38: Russia & Belarus Value (USD Million) and Volume (Units) Historical Data 2020 to 2035 and Forecast 2025 to 2035 By Material Used
  • Table 39: Russia & Belarus Value (USD Million) and Volume (Units) Historical Data 2020 to 2035 and Forecast 2025 to 2035 By Production Technology
  • Table 40: Russia & Belarus Market Value (USD Million) & Volume (Units) Historical Data 2020 to 2035 and Forecast 2025 to 2035 by
  • Table 41: Russia & Belarus Market Value (USD Million) & Volume (Units) Historical Data 2020 to 2035 and Forecast 2025 to 2035 by Size
  • Table 42: Balkan & Baltic Countries Market Value (USD Million) and Volume (Units) Historical Data 2020 to 2035 and Forecast 2025 to 2035 By Product
  • Table 43: Balkan & Baltic Countries Value (USD Million) and Volume (Units) Historical Data 2020 to 2035 and Forecast 2025 to 2035 By Material Used
  • Table 44: Balkan & Baltic Countries Value (USD Million) and Volume (Units) Historical Data 2020 to 2035 and Forecast 2025 to 2035 By Production Technology
  • Table 45: Balkan & Baltic Countries Market Value (USD Million) & Volume (Units) Historical Data 2020 to 2035 and Forecast 2025 to 2035 by
  • Table 46: Balkan & Baltic Market Value (USD Million) & Volume (Units) Historical Data 2020 to 2035 and Forecast 2025 to 2035 by Size
  • Table 47: South Asia Pacific Size (USD Million) and Volume (Units) Analysis and Forecast By Country, 2018 to 2033
  • Table 48: South Asia & Pacific Market Value (USD Million) and Volume (Units) Historical Data 2020 to 2035 and Forecast 2025 to 2035 By Product
  • Table 49: South Asia & Pacific Value (USD Million) and Volume (Units) Historical Data 2020 to 2035 and Forecast 2025 to 2035 By Material Used
  • Table 50: South Asia & Pacific Value (USD Million) and Volume (Units) Historical Data 2020 to 2035 and Forecast 2025 to 2035 By Production Technology
  • Table 51: South Asia & Pacific Market Value (USD Million) & Volume (Units) Historical Data 2020 to 2035 and Forecast 2025 to 2035 by
  • Table 52: South Asia & Pacific Market Value (USD Million) & Volume (Units) Historical Data 2020 to 2035 and Forecast 2025 to 2035 by Size
  • Table 53: East Asia Size (USD Million) and Volume (Units) Analysis and Forecast By Country, 2018 to 2033
  • Table 54: East Asia Market Value (USD Million) and Volume (Units) Historical Data 2020 to 2035 and Forecast 2025 to 2035 By Product
  • Table 55: East Asia Value (USD Million) and Volume (Units) Historical Data 2020 to 2035 and Forecast 2025 to 2035 By Material Used
  • Table 56: East Asia Value (USD Million) and Volume (Units) Historical Data 2020 to 2035 and Forecast 2025 to 2035 By Production Technology
  • Table 57: East Asia Market Value (USD Million) & Volume (Units) Historical Data 2020 to 2035 and Forecast 2025 to 2035 by
  • Table 58: East Asia Market Value (USD Million) & Volume (Units) Historical Data 2020 to 2035 and Forecast 2025 to 2035 by Size
  • Table 59: Middle East & Africa Size (USD Million) and Volume (Units) Analysis and Forecast By Country, 2018 to 2033
  • Table 60: Middle East and Africa Market Value (USD Million) and Volume (Units) Historical Data 2020 to 2035 and Forecast 2025 to 2035 By Product
  • Table 61: Middle East and Africa Value (USD Million) and Volume (Units) Historical Data 2020 to 2035 and Forecast 2025 to 2035 By Material Used
  • Table 62: Middle East and Africa Value (USD Million) and Volume (Units) Historical Data 2020 to 2035 and Forecast 2025 to 2035 By Production Technology
  • Table 63: Middle East and Africa Market Value (USD Million) & Volume (Units) Historical Data 2020 to 2035 and Forecast 2025 to 2035 by
  • Table 64: Middle East and Africa Market Value (USD Million) & Volume (Units) Historical Data 2020 to 2035 and Forecast 2025 to 2035 by Size

List of Figures

  • Figure 01: Global Market Historical Volume (Units),  2020 to 2035
  • Figure 02: Global Market Volume (Units) Forecast, 2025 to 2035
  • Figure 03: Global Pricing Analysis By Product (US$/Unit), 2025
  • Figure 04: Global Market Volume Share (2025A), Product
  • Figure 05: Global Market Historical Value (US$ Million),  2020 to 2035
  • Figure 06: Global Market Value (US$ Million) Forecast, 2025 to 2035
  • Figure 07: Global Market Absolute $ Opportunity, 2025 to 2035
  • Figure 08: Global Market Share and BPS Analysis by 2023 & 2033 Product - 2025 to 2035
  • Figure 09: Global Market Y-o-Y Growth Projections by Product, 2025 to 2035
  • Figure 10: Global Market Attractiveness by Product, 2025 to 2035
  • Figure 11: Global Incremental $ Opportunity by Product, 2025 to 2035
  • Figure 12: Global Market Share and BPS Analysis by 2023 & 2033 Product Type- 2025 to 2035
  • Figure 13: Global Market Y-o-Y Growth Projections by Product Type, 2025 to 2035
  • Figure 14: Global Market Attractiveness by Product Type, 2025 to 2035
  • Figure 15: Global Incremental $ Opportunity by Size, 2025 to 2035
  • Figure 16: Global Share and BPS Analysis by Material Use- 2025 to 2035
  • Figure 17: Global Y-o-Y Growth Projections by Market: Introduction By Material Use, 2025 to 2035
  • Figure 18: Global Attractiveness by Market: Introduction By Material Use, 2025 to 2035
  • Figure 19: Global Incremental $ Opportunity by Material, 2025 to 2035
  • Figure 20: Global Share and BPS Analysis by Production Technology - 2025 to 2035
  • Figure 21: Global Y-o-Y Growth Projections by Production Technology, 2025 to 2035
  • Figure 22: Global Attractiveness by Production Technology, 2025 to 2035
  • Figure 23: Global Market Incremental $ Opportunity By Production Technology, 2025 to 2035
  • Figure 24: Global Share and BPS Analysis by End Use - 2025 to 2035
  • Figure 25: Global Y-o-Y Growth Projections by End Use, 2025 to 2035
  • Figure 26: Global Attractiveness by End Use, 2025 to 2035
  • Figure 27: Global Incremental $ Opportunity by End Use, 2025 to 2035
  • Figure 28: Global Share and BPS Analysis By Region - 2025 to 2035
  • Figure 29: Global Y-o-Y Growth Projections By Region, 2025 to 2035
  • Figure 30: Global Attractiveness By Region, 2025 to 2035
  • Figure 31: Global Incremental $ Opportunity By Region, 2025 to 2035
  • Figure 32: North America Market Share and BPS Analysis by Country - 2025 to 2035
  • Figure 33: North America Market Y-o-Y Growth Projections by Country, 2025 to 2035
  • Figure 34: North America Market Attractiveness by Country, 2025 to 2035
  • Figure 35: North America Market Incremental $ Opportunity By Country, 2025 to 2035
  • Figure 36: North America Market Share and BPS Analysis by 2023 & 2033 Product Type- 2025 to 2035
  • Figure 37: North America Market Y-o-Y Growth Projections by Product Type, 2025 to 2035
  • Figure 38: North America Market Attractiveness by Product Type, 2025 to 2035
  • Figure 39: North America Share and BPS Analysis by Material Use- 2025 to 2035
  • Figure 40: North America Y-o-Y Growth Projections by Market: Introduction By Material Use, 2025 to 2035
  • Figure 41: North America Attractiveness by Market: Introduction By Material Use, 2025 to 2035
  • Figure 42: North America Share and BPS Analysis by Production Technology - 2025 to 2035
  • Figure 43: North America Y-o-Y Growth Projections by Production Technology, 2025 to 2035
  • Figure 44: North America Attractiveness by Production Technology, 2025 to 2035
  • Figure 45: North America Share and BPS Analysis by End Use - 2025 to 2035
  • Figure 46: North America Y-o-Y Growth Projections by End Use, 2025 to 2035
  • Figure 47: North America Attractiveness by End Use, 2025 to 2035
  • Figure 48: North America Market Share and BPS Analysis by 2023 & 2033 Product Type- 2025 to 2035
  • Figure 49: North America Market Y-o-Y Growth Projections by Product Type, 2025 to 2035
  • Figure 50: North America Market Attractiveness by Product Type, 2025 to 2035
  • Figure 51: Latin America Market Share and BPS Analysis by Country - 2025 to 2035
  • Figure 52: Latin America Market Y-o-Y Growth Projections by Country, 2025 to 2035
  • Figure 53: Latin America Market Attractiveness by Country, 2025 to 2035
  • Figure 54: Latin America Market Incremental $ Opportunity By Country, 2025 to 2035
  • Figure 55: Latin America Market Share and BPS Analysis by 2023 & 2033 Product Type - 2025 to 2035
  • Figure 56: Latin America Market Y-o-Y Growth Projections by Product Type, 2025 to 2035
  • Figure 57: Latin America Market Attractiveness by Product Type, 2025 to 2035
  • Figure 58: Latin America Share and BPS Analysis by Material Use - 2025 to 2035
  • Figure 59: Latin America Y-o-Y Growth Projections by Market: Introduction By Material Use, 2025 to 2035
  • Figure 60: Latin America Attractiveness by Market: Introduction By Material Use, 2025 to 2035
  • Figure 61: Latin America Share and BPS Analysis by Production Technology - 2025 to 2035
  • Figure 62: Latin America Y-o-Y Growth Projections by Production Technology, 2025 to 2035
  • Figure 63: Latin America Attractiveness by Production Technology, 2025 to 2035
  • Figure 64: Latin America Share and BPS Analysis by End Use - 2025 to 2035
  • Figure 65: Latin America Y-o-Y Growth Projections by End Use, 2025 to 2035
  • Figure 66: Latin America Attractiveness by End Use, 2025 to 2035
  • Figure 67: Latin America Market Share and BPS Analysis by 2023 & 2033 Product Type - 2025 to 2035
  • Figure 68: Latin America Market Y-o-Y Growth Projections by Product Type, 2025 to 2035
  • Figure 69: Latin America Market Attractiveness by Product Type, 2025 to 2035
  • Figure 70: Western Europe Share and BPS Analysis By Country, 2023 & 2033
  • Figure 71: Western Europe Y-o-Y Growth Projections By Country, 2025 to 2035
  • Figure 72: Western Europe Attractiveness Analysis By Country, 2025 to 2035
  • Figure 73: Western Europe Market Incremental $ Opportunity By Country, 2025 to 2035
  • Figure 74: Market Share and BPS Analysis by 2023 & 2033 Product Type - 2025 to 2035
  • Figure 75: Market Y-o-Y Growth Projections by Product Type, 2025 to 2035
  • Figure 76: Market Attractiveness by Product Type, 2025 to 2035
  • Figure 77: Western Europe Share and BPS Analysis by Material Use - 2025 to 2035
  • Figure 78: Western Europe Y-o-Y Growth Projections by Market: Introduction By Material Use, 2025 to 2035
  • Figure 79: Western Europe Attractiveness by Market: Introduction By Material Use, 2025 to 2035
  • Figure 80: Western Europe Share and BPS Analysis by Production Technology - 2025 to 2035
  • Figure 81: Western Europe Y-o-Y Growth Projections by Production Technology, 2025 to 2035
  • Figure 82: Western Europe Attractiveness by Production Technology, 2025 to 2035
  • Figure 83: Western Europe Share and BPS Analysis by End Use - 2025 to 2035
  • Figure 84: Western Europe Y-o-Y Growth Projections by End Use, 2025 to 2035
  • Figure 85: Western Europe Attractiveness by End Use, 2025 to 2035
  • Figure 86: Western Europe Market Share and BPS Analysis by 2023 & 2033 Product Type- 2025 to 2035
  • Figure 87: Western Europe Market Y-o-Y Growth Projections by Product Type, 2025 to 2035
  • Figure 88: Western Europe Market Attractiveness by Product Type, 2025 to 2035
  • Figure 89: Eastern Europe Share and BPS Analysis By Country, 2023 & 2033
  • Figure 90: Eastern Europe Y-o-Y Growth Projections By Country, 2025 to 2035
  • Figure 91: Eastern Europe Attractiveness Analysis By Country, 2025 to 2035
  • Figure 92: Eastern Europe Market by Incremental $ Opportunity By Country, 2025 to 2035
  • Figure 93: Eastern Europe Market Share and BPS Analysis by 2023 & 2033 Product Type- 2025 to 2035
  • Figure 94: Eastern Europe Market Y-o-Y Growth Projections by Product Type, 2025 to 2035
  • Figure 95: Eastern Europe Market Attractiveness by Product Type, 2025 to 2035
  • Figure 96: Eastern Europe Share and BPS Analysis by Material Use- 2025 to 2035
  • Figure 97: Eastern Europe Y-o-Y Growth Projections by Market: Introduction By Material Use, 2025 to 2035
  • Figure 98: Eastern Europe Attractiveness by Market: Introduction By Material Use, 2025 to 2035
  • Figure 99: Eastern Europe Share and BPS Analysis by Production Technology - 2025 to 2035
  • Figure 100: Eastern Europe Y-o-Y Growth Projections by Production Technology, 2025 to 2035
  • Figure 101: Eastern Europe Attractiveness by Production Technology, 2025 to 2035
  • Figure 102: Eastern Europe Share and BPS Analysis by End Use - 2025 to 2035
  • Figure 103: Eastern Europe Y-o-Y Growth Projections by End Use, 2025 to 2035
  • Figure 104: Eastern Europe Attractiveness by End Use, 2025 to 2035
  • Figure 105: Eastern Europe Market Share and BPS Analysis by 2023 & 2033 Product Type- 2025 to 2035
  • Figure 106: Eastern Europe Market Y-o-Y Growth Projections by Product Type, 2025 to 2035
  • Figure 107: Eastern Europe Market Attractiveness by Product Type, 2025 to 2035
  • Figure 108: Central Asia Market Share and BPS Analysis by 2023 & 2033 Product Type- 2025 to 2035
  • Figure 109: Central Asia Market Y-o-Y Growth Projections by Product Type, 2025 to 2035
  • Figure 110: Central Asia Market Attractiveness by Product Type, 2025 to 2035
  • Figure 111: Central Asia Share and BPS Analysis by Material Use - 2025 to 2035
  • Figure 112: Central Asia Y-o-Y Growth Projections by Market: Introduction By Material Use, 2025 to 2035
  • Figure 113: Central Asia Attractiveness by Market: Introduction By Material Use, 2025 to 2035
  • Figure 114: Central Asia Share and BPS Analysis by Production Technology - 2025 to 2035
  • Figure 115: Central Asia Y-o-Y Growth Projections by Production Technology, 2025 to 2035
  • Figure 116: Central Asia Attractiveness by Production Technology, 2025 to 2035
  • Figure 117: Central Asia Share and BPS Analysis by End Use - 2025 to 2035
  • Figure 118: Central Asia Y-o-Y Growth Projections by End Use, 2025 to 2035
  • Figure 119: Central Asia Attractiveness by End Use, 2025 to 2035
  • Figure 120: Central Asia Market Share and BPS Analysis by 2023 & 2033 Product Type - 2025 to 2035
  • Figure 121: Central Asia Market Y-o-Y Growth Projections by Product Type, 2025 to 2035
  • Figure 122: Central Asia Market Attractiveness by Product Type, 2025 to 2035
  • Figure 123: Russia & Belarus Market Share and BPS Analysis by 2023 & 2033 Product Type- 2025 to 2035
  • Figure 124: Russia & Belarus Market Y-o-Y Growth Projections by Product Type, 2025 to 2035
  • Figure 125: Russia & Belarus Market Attractiveness by Product Type, 2025 to 2035
  • Figure 126: Russia & Belarus Share and BPS Analysis by Material Use - 2025 to 2035
  • Figure 127: Russia & Belarus Y-o-Y Growth Projections by Market: Introduction By Material Use, 2025 to 2035
  • Figure 128: Russia & Belarus Attractiveness by Market: Introduction By Material Use, 2025 to 2035
  • Figure 129: Russia & Belarus Share and BPS Analysis by Production Technology - 2025 to 2035
  • Figure 130: Russia & Belarus Y-o-Y Growth Projections by Production Technology, 2025 to 2035
  • Figure 131: Russia & Belarus Attractiveness by Production Technology, 2025 to 2035
  • Figure 132: Russia & Belarus Share and BPS Analysis by End Use - 2025 to 2035
  • Figure 133: Russia & Belarus Y-o-Y Growth Projections by End Use, 2025 to 2035
  • Figure 134: Russia & Belarus Attractiveness by End Use, 2025 to 2035
  • Figure 135: Russia & Belarus Market Share and BPS Analysis by 2023 & 2033 Product Type - 2025 to 2035
  • Figure 136: Russia & Belarus Market Y-o-Y Growth Projections by Product Type, 2025 to 2035
  • Figure 137: Russia & Belarus Market Attractiveness by Product Type, 2025 to 2035
  • Figure 138: Balkan & Baltic Countries Market Share and BPS Analysis by 2023 & 2033 Product Type - 2025 to 2035
  • Figure 139: Balkan & Baltic Countries Market Y-o-Y Growth Projections by Product Type, 2025 to 2035
  • Figure 140: Balkan & Baltic Countries Market Attractiveness by Product Type, 2025 to 2035
  • Figure 141: Balkan & Baltic Countries Share and BPS Analysis by Material Use- 2025 to 2035
  • Figure 142: Balkan & Baltic Countries Y-o-Y Growth Projections by Market: Introduction By Material Use, 2025 to 2035
  • Figure 143: Balkan & Baltic Countries Attractiveness by Market: Introduction By Material Use, 2025 to 2035
  • Figure 144: Balkan & Baltic Countries Share and BPS Analysis by Production Technology - 2025 to 2035
  • Figure 145: Balkan & Baltic Countries Y-o-Y Growth Projections by Production Technology, 2025 to 2035
  • Figure 146: Balkan & Baltic Countries Attractiveness by Production Technology, 2025 to 2035
  • Figure 147: Balkan & Baltic Countries Share and BPS Analysis by End Use - 2025 to 2035
  • Figure 148: Balkan & Baltic Countries Y-o-Y Growth Projections by End Use, 2025 to 2035
  • Figure 149: Balkan & Baltic Countries Attractiveness by End Use, 2025 to 2035
  • Figure 150: Balkan & Baltic Countries Market Share and BPS Analysis by 2023 & 2033 Product Type- 2025 to 2035
  • Figure 151: Balkan & Baltic Countries Market Y-o-Y Growth Projections by Product Type, 2025 to 2035
  • Figure 152: Balkan & Baltic Countries Market Attractiveness by Product Type, 2025 to 2035
  • Figure 153: South Asia and Pacific Share and BPS Analysis By Country, 2023 & 2033
  • Figure 154: South Asia and Pacific Y-o-Y Growth Projections By Country, 2025 to 2035
  • Figure 155: South Asia and Pacific Attractiveness Analysis By Country, 2025 to 2035
  • Figure 156: South Asia and Pacific Incremental $ Opportunity By Country, 2025 to 2035
  • Figure 157: South Asia & Pacific Market Share and BPS Analysis by 2023 & 2033 Product Type- 2025 to 2035
  • Figure 158: South Asia & Pacific Market Y-o-Y Growth Projections by Product Type, 2025 to 2035
  • Figure 159: South Asia & Pacific Market Attractiveness by Product Type, 2025 to 2035
  • Figure 160: South Asia & Pacific Share and BPS Analysis by Material Use- 2025 to 2035
  • Figure 161: South Asia & Pacific Y-o-Y Growth Projections by Market: Introduction By Material Use, 2025 to 2035
  • Figure 162: South Asia & Pacific Attractiveness by Market: Introduction By Material Use, 2025 to 2035
  • Figure 163: South Asia & Pacific Share and BPS Analysis by Production Technology - 2025 to 2035
  • Figure 164: South Asia & Pacific Y-o-Y Growth Projections by Production Technology, 2025 to 2035
  • Figure 165: South Asia & Pacific Attractiveness by Production Technology, 2025 to 2035
  • Figure 166: South Asia & Pacific Share and BPS Analysis by End Use - 2025 to 2035
  • Figure 167: South Asia & Pacific Y-o-Y Growth Projections by End Use, 2025 to 2035
  • Figure 168: South Asia & Pacific Attractiveness by End Use, 2025 to 2035
  • Figure 169: South Asia & Pacific Market Share and BPS Analysis by 2023 & 2033 Product Type- 2025 to 2035
  • Figure 170: South Asia & Pacific Market Y-o-Y Growth Projections by Product Type, 2025 to 2035
  • Figure 171: South Asia & Pacific Market Attractiveness by Product Type, 2025 to 2035
  • Figure 172: East Asia Share and BPS Analysis By Country, 2023 & 2033
  • Figure 173: East Asia Y-o-Y Growth Projections By Country, 2025 to 2035
  • Figure 174: East Asia Attractiveness Analysis By Country, 2025 to 2035
  • Figure 175: East Asia Market Incremental $ Opportunity By Country, 2025 to 2035
  • Figure 176: East Asia Market Share and BPS Analysis by 2023 & 2033 Product Type - 2025 to 2035
  • Figure 177: East Asia Market Y-o-Y Growth Projections by Product Type, 2025 to 2035
  • Figure 178: East Asia Market Attractiveness by Product Type, 2025 to 2035
  • Figure 179: East Asia Share and BPS Analysis by Material Use- 2025 to 2035
  • Figure 180: East Asia Y-o-Y Growth Projections by Market: Introduction By Material Use, 2025 to 2035
  • Figure 181: East Asia Attractiveness by Market: Introduction By Material Use, 2025 to 2035
  • Figure 182: East Asia Share and BPS Analysis by Production Technology - 2025 to 2035
  • Figure 183: East Asia Y-o-Y Growth Projections by Production Technology, 2025 to 2035
  • Figure 184: East Asia Attractiveness by Production Technology, 2025 to 2035
  • Figure 185: East Asia Share and BPS Analysis by End Use - 2025 to 2035
  • Figure 186: East Asia Y-o-Y Growth Projections by End Use, 2025 to 2035
  • Figure 187: East Asia Attractiveness by End Use, 2025 to 2035
  • Figure 188: East Asia Market Share and BPS Analysis by 2023 & 2033 Product Type - 2025 to 2035
  • Figure 189: East Asia Market Y-o-Y Growth Projections by Product Type, 2025 to 2035
  • Figure 190: East Asia Market Attractiveness by Product Type, 2025 to 2035
  • Figure 191: Middle East and Africa Share and BPS Analysis By Country, 2023 & 2033
  • Figure 192: Middle East and Africa Y-o-Y Growth Projections By Country, 2025 to 2035
  • Figure 193: Middle East and Africa Attractiveness Analysis By Country, 2025 to 2035
  • Figure 194: Middle East and Africa Market Incremental $ Opportunity By Country, 2025 to 2035
  • Figure 195: Middle East and Africa Market Share and BPS Analysis by 2023 & 2033 Product Type- 2025 to 2035
  • Figure 196: Middle East and Africa Market Y-o-Y Growth Projections by Product Type, 2025 to 2035
  • Figure 197: Middle East and Africa Market Attractiveness by Product Type, 2025 to 2035
  • Figure 198: Middle East and Africa Share and BPS Analysis by Material Use- 2025 to 2035
  • Figure 199: Middle East and Africa Y-o-Y Growth Projections by Market: Introduction By Material Use, 2025 to 2035
  • Figure 200: Middle East and Africa Attractiveness by Market: Introduction By Material Use, 2025 to 2035
  • Figure 201: Middle East and Africa Share and BPS Analysis by Production Technology - 2025 to 2035
  • Figure 202: Middle East and Africa Y-o-Y Growth Projections by Production Technology, 2025 to 2035
  • Figure 203: Middle East and Africa Attractiveness by Production Technology, 2025 to 2035
  • Figure 204: Middle East and Africa Share and BPS Analysis by End Use - 2025 to 2035
  • Figure 205: Middle East and Africa Y-o-Y Growth Projections by End Use, 2025 to 2035
  • Figure 206: Middle East and Africa Attractiveness by End Use, 2025 to 2035
  • Figure 207: Middle East and Africa Market Share and BPS Analysis by 2023 & 2033 Product Type - 2025 to 2035
  • Figure 208: Middle East and Africa Market Y-o-Y Growth Projections by Product Type, 2025 to 2035
  • Figure 209: Middle East and Africa Market Attractiveness by Product Type, 2025 to 2035

Frequently Asked Questions

What industries make the most use of ring rolling products?

The aerospace, wind turbine, automotive, oil & gas, and rail industries constitute the largest share, as they need high-strength, precision-forged components.

What are firms doing to improve productivity in their manufacturing?

In manufacturing, we’re already seeing AI-driven automation, predictive maintenance, and smart forging.

What are the ways that drive sustainability here?

The strict environmental protection policies are forcing companies to choose low-emission forging and recyclable products and energy-efficient production.

Which are the fastest-growing regions?

Europe and China lead in offshore wind expansion, while India and Southeast Asia are emerging as cost-competitive manufacturing hubs.

How is technology transforming product development?

3D simulation, digital twins, and intelligent alloys have made parts lighter, stronger, and more durable.

Explore Similar Insights

Future Market Insights

Ring Rolling Products Market