Ring Pull Cap Market Size and Share Forecast Outlook 2025 to 2035

The Ring Pull Cap Market is estimated to be valued at USD 389.5 million in 2025 and is projected to reach USD 560.4 million by 2035, registering a compound annual growth rate (CAGR) of 3.7% over the forecast period.

The Ring Pull Cap market is witnessing steady growth, driven by increasing demand for convenient and tamper-evident packaging solutions across the beverage industry. Rising consumer preference for ready-to-drink products and easy-to-open packaging formats is contributing to the adoption of ring pull caps in both developed and emerging markets. Advancements in material engineering, such as lightweight aluminum and corrosion-resistant coatings, are enhancing durability and usability, while simultaneously supporting sustainability initiatives by facilitating recycling.

Manufacturers are investing in precision tooling and quality assurance processes to ensure consistent performance and leak-proof sealing. The market is further supported by growing beverage production, particularly in beer, carbonated drinks, and ready-to-drink segments, where packaging efficiency and consumer convenience are critical.

As regulatory standards and quality certifications continue to evolve, adherence to safety, hygiene, and environmental compliance is becoming a key driver With the combination of consumer convenience, material innovation, and operational efficiency, the Ring Pull Cap market is expected to maintain robust growth in the coming years.
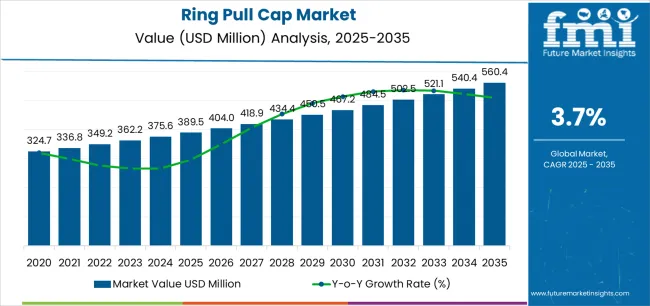
Quick Stats for Ring Pull Cap Market

  • Ring Pull Cap Market Industry Value (2025): USD 389.5 million
  • Ring Pull Cap Market Forecast Value (2035): USD 560.4 million
  • Ring Pull Cap Market Forecast CAGR: 3.7%
  • Leading Segment in Ring Pull Cap Market in 2025: Aluminum Ring Pull Caps (55.6%)
  • Key Growth Region in Ring Pull Cap Market: North America, Asia-Pacific, Europe
  • Top Key Players in Ring Pull Cap Market: Crown Holdings Inc., Guala Closures Group, Pelliconi & C. SpA, Finn-Korkki Oy, Amcor plc, Nippon Closures Co. Ltd., Sonoco Products Company, World Bottling Cap, LLC, Fuzhou SKT Co., Ltd., Jiangsu Changjiang Lids Co., Ltd., Taiwan Hon Chuan Enterprise Co., Ltd., The TNN Development Limited
Metric Value
Ring Pull Cap Market Estimated Value in (2025 E) USD 389.5 million
Ring Pull Cap Market Forecast Value in (2035 F) USD 560.4 million
Forecast CAGR (2025 to 2035) 3.7%

Segmental Analysis

The market is segmented by Material, Cap Diameter, and End-Use and region. By Material, the market is divided into Aluminum Ring Pull Caps and Steel Ring Pull Caps. In terms of Cap Diameter, the market is classified into 26 Mm Ring Pull Caps and Other Sizes. Based on End-Use, the market is segmented into Beer, Soft Drinks, and Others. Regionally, the market is classified into North America, Latin America, Western Europe, Eastern Europe, Balkan & Baltic Countries, Russia & Belarus, Central Asia, East Asia, South Asia & Pacific, and the Middle East & Africa.
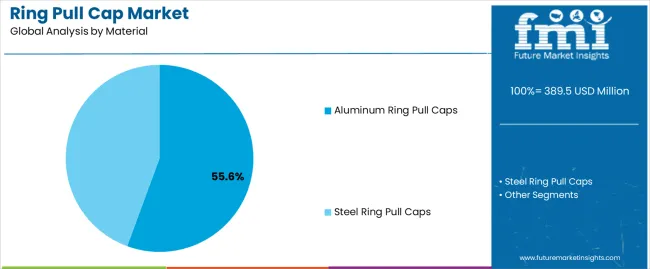
Insights into the Aluminum Ring Pull Caps Material Segment

The aluminum ring pull caps material segment is projected to hold 55.6% of the market revenue in 2025, establishing it as the leading material category. Growth in this segment is being driven by aluminum’s lightweight nature, corrosion resistance, and excellent formability, which make it ideal for high-volume beverage packaging.

Its ability to provide tamper-evident sealing while maintaining product freshness and safety has strengthened its adoption across breweries and beverage manufacturers. The material’s recyclability and low environmental impact further support its preference, particularly among companies targeting sustainable packaging solutions.

Advances in manufacturing techniques, including precision stamping and coating, ensure consistent quality and ease of use for consumers As demand for ready-to-drink and convenience-oriented beverages continues to rise globally, aluminum ring pull caps are expected to maintain their leadership position, supported by the combination of performance, cost-efficiency, and sustainability attributes that align with industry and consumer requirements.
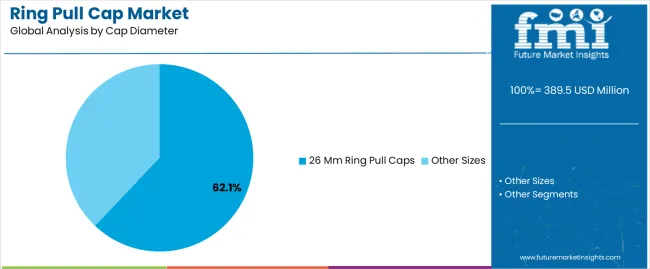
Insights into the 26 Mm Ring Pull Caps Cap Diameter Segment

The 26 mm ring pull caps segment is anticipated to account for 62.1% of the market revenue in 2025, making it the leading cap diameter category. Its dominance is being driven by its suitability for standard beverage bottle neck sizes, ensuring secure sealing and maintaining carbonation or product freshness.

The 26 mm size offers optimal balance between structural integrity and ease of opening, providing convenience for end users while supporting efficient manufacturing and packaging processes. Its widespread adoption in the beer and soft drink industries has reinforced market growth.

Compatibility with automated capping systems, uniform sealing performance, and consistent consumer usability further strengthen the preference for this diameter As beverage producers continue to prioritize operational efficiency, safety, and consumer experience, the 26 mm ring pull caps segment is expected to remain the dominant category, supported by its proven reliability and alignment with industry standards and global packaging trends.
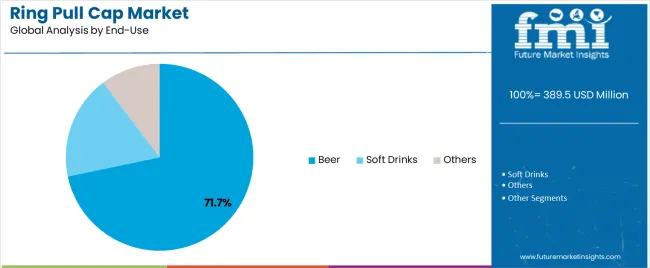
Insights into the Beer End-Use Segment

The beer end-use segment is projected to hold 71.7% of the market revenue in 2025, establishing it as the largest end-use category. Its growth is being driven by the increasing global consumption of packaged beer and the rising preference for ready-to-drink formats. Beer manufacturers favor ring pull caps for their tamper-evident properties, ease of use, and ability to preserve carbonation and flavor over extended shelf life.

The convenience offered by ring pull closures enhances the consumer experience, which is particularly valued in retail and on-the-go consumption scenarios. Investments in automated filling and capping systems have enabled high-volume production while ensuring consistent quality.

The segment’s leadership is further supported by product innovations in craft beer and premium packaging that leverage aluminum ring pull caps for branding and sustainability purposes As beer production and consumption continue to grow worldwide, the segment is expected to maintain dominance, driven by operational efficiency, consumer convenience, and material advantages.

Market Trends and Opportunities that Enhance the Prospects of Ring Pull Cap Manufacturers

  • Beverage companies are using ring pull caps to customize colors, logos, and other branding elements, making it a valuable marketing tool. Players are thus using branded caps to raise their brand recognition and develop a memorable experience for consumers.
  • Beer is expected to hold its dominance as an end use in the forecast period. Increasing consumers of beers, as beer companies introduce new flavors and varieties in the market, is set to impact future trends.
  • Players are putting extra effort into enhancing the overall design of ring pull caps to capture more end-consumers. The result of these initiatives is chrome-plated caps that are rigidly tethered to the tip of the cap and metal caps with plastic rings that reduce the cap’s overall weight. Another novelty introduced in the market is oxygen scavengers, also called oxygen absorbers, which help preserve alcoholic beverages for extended periods.
  • Manufacturers are also enhancing the aesthetics of ring pull caps using sophisticated metal printing techniques like flexo-offset hybrid printing to draw more customers.
  • Market participants are further opting for these caps as they are typically made of aluminum, which is a sustainable material. By choosing aluminum-based ring pull caps, players in the beverage industry limit their GHG emissions.

Overview of Markets Adjacent to the Global Ring Pull Cap Industry

The section below covers the leading markets that provide cap solutions, namely the cap and closure market and plastic cap and closure market, apart from the main market. Players in these markets are expected to encounter relevant opportunities as mentioned below. They can further diversify their offerings to future-proof their businesses.

Ring Pull Cap Market:

Attributes Ring Pull Cap Market
CAGR (2025 to 2035) 3.90%
Growth Factor Increasing demand from the beverage sector, especially for beers and juices
Opportunity Opportunities for manufacturers to innovate with increasing popularity of ready-to-drink beverages and convenience foods
Key Trend Adoption of ring pull cap designs with tamper-evident features for product safety

Cap and Closure Market:

Attributes Cap and Closure Market
CAGR (2025 to 2035) 5.30%
Growth Factor
  • Rising demand for caps and closures from the pharmaceutical sector
Opportunity
  • Surging demand for eco-friendly cap and closure alternatives
  • Opportunities exist for players to establish themselves in pharmaceuticals, cosmetics, food and beverage, and household products
Key Trend Growing focus on sustainable and innovative solutions

Plastic Cap and Closure Market:

Attributes Plastic Cap and Closure Market
CAGR (2025 to 2035) 5.30%
Growth Factor Manufacturers of processed food and beverages are scaling their businesses, pushing the sales of plastic caps and closures
Opportunity Opportunities for manufacturers to offer customization and branding options to meet client requirements
Key Trend Shift toward lightweight and eco-friendly caps and closures to reduce environmental impact

Category-wise Ring Pull Cap Industry Analysis

Aluminum Holds a Coveted Value Share in Ring Pull Cap Market

Leading Material Aluminum
Value Share (2025) 69.60%

The market is LED by aluminum-based caps. Latest research projections indicate that this segment is set to seize a 69.60% market share in 2025. Their demand is increasing due to their infinite recyclability.

Beverage players seeking to lower their carbon index are thus utilizing aluminum caps. Moreover, aluminum has high oxidation resistance, which is especially useful in overwrapping machines, leading to its heightened demand.

Beer Sector Uses a Large Portion of Produced Ring Pull Caps

Leading End Use Beer
Value Share (2025) 71.70%

FMI has analyzed that the beer sector is the dominant user of ring pull caps. The segment presently has over 71.70% market share as of 2025. Incessant consumers of beer are translating to rising sales, which play a crucial role in preserving the beer’s quality.

Another reason to use these caps is that they endure pressure from the beer and restrict oxidants from interfering with the product.

These caps are composed of organoleptically neutral materials, which help preserve the taste, flavor, and aroma of the original product. Beer producers also use ring pull caps to reduce the weight of the packaging, thanks to its lightweight design. This helps them reduce shipping and storage costs.

Global Ring Pull Cap Market Dynamics by Country

Countries Forecast CAGR (2025 to 2035)
The United States 1.60%
Spain 2.50%
India 5.50%
China 4.40%
Thailand 3.90%

Demand Continues in the United States, Thanks to the Propelling Beverage Industry

The ring pull cap market in the United States is the leading market in North America. The product sales in the country are expanding at a consistent 1.60% CAGR over the forecast period. A key driver for this industry is the rapidly expanding beverage industry, which creates significant employment opportunities and directly impacts the United States economy.

Tethered caps superseded a large section of the conventional caps in the beverage industry a long time ago. This was a consequence of public outcry for shrapnel-like aluminum pull tabs from soda and beer cans posing ecological as well as health risks.

Increasing Alcohol Consumers in Spain to Contribute to the Ring Pull Cap Market Growth

The market in Spain is predicted to expand at a greater pace than other European countries taken for study. FMI has estimated the growth of Spain to steadily increase at a 2.50% CAGR over the assessment period.

The wide application of ring pull caps in the packaging for numerous beverages is projected to push the sales of ring pull caps. Furthermore, rising alcohol consumption in Spain is another key determinant for the ring pull cap industry growth.

Ergonomically Designed Ring Pull Caps Enjoy Consumer Preference in China Due to its User-friendliness

Demand and production of ring pull caps in China are anticipated to increase at a 4.40% CAGR in the next 10 years. Manufacturers are working toward easy-to-open ring pull caps for beer bottles that offer user-friendliness and convenience. These ergonomically shaped rings are tugged into the bottle and deliver an elevated drinking experience.

Players in China offer wholesale prices for ring pull crown caps due to economies of scale, which is inducing growth in the country. These rings pull crown caps are sold alongside options for plastic jars that are in trend, durable, and lightweight. Increasing appeal for these jars is also fueling growth for the main product.

Manufacturers in India Zero in on the Development of High-quality and Efficient Ring Pull Caps

As per the latest FMI estimates, the India ring pull cap market is assessed to proliferate at 5.50% CAGR over the forecast time frame. The steadily increasing beverage sector is promoting the expansion of the ring pull cap industry in India.

Consistent sales of different beverages can be traced back to the improving purchasing power of people and innovative drink releases, especially in the juice and beer category.

Manufacturers in India are emphasizing high quality and efficiency in the processing of ring pull caps. Additionally, they are selling their high-quality and competitively-priced ring pull cap domestically and internationally to their regular as well as new customers.

Beverage Players in Thailand Prefer Ring Pull Caps to Ensure “Drinkability” of a Beverage

The sales of ring pull caps in Thailand are predicted to surge at a CAGR of 3.90% in the next decade. Benefits like easy-to-open, ideal for shelf visual impact, tamper-evident, fit for many applications, and high-pressure performance, are pulling consumers to beverages with ring pull caps.

Demand for ring pull caps is also increasing as they enhance the “drinkability” of a beverage. This is achieved by the convenient wide bottle cap finish, which makes it ideal for direct consumption from the bottle. It find extensive applications in cider, beer, energy drinks, and spirit-based RTDs.
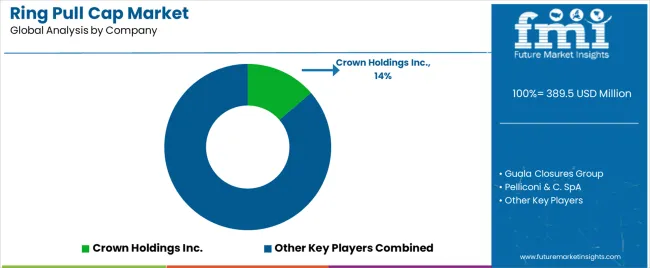
Competitive Landscape

Key players in the market are developing different, innovative versions of ring pull caps to suit the needs of their customers. Customers can also request offset color printing to decorate the metal surface both externally and internally, making it suitable for promotions and competition.

Players are also highlighting the compatibility of ring pull caps with hot-filling processes and standard pasteurization in the field of beverages.

Participants are targeting emerging as well as established companies in the end-use industries, like soft drinks, beers, energy drinks, etc. with their new releases. Further, market contenders are pumping up investments to increase their manufacturing capacity and demonstrate their presence in global markets.

Players are offering worldwide shipping for ring pull caps and at competitive prices to entice customers with a better deal. Additionally, players are investing in the latest technologies and machines to bring efficiencies in the manufacturing process.

Latest Developments that Contribute to the Ring Pull Cap Market’s Growth

  • Finn-Korkki Oy declared in May 2024 that it is going to ramp up production and stock for 29 mm crown caps to meet the increased demand from craft breweries. Popularity of craft breweries continues to surge, especially among young adults who are seeking unconventional alcohol experiences.
  • In a blog post published in July 2024 on ALPLA’s website, the company stated its role in helping Vöslauer, a leading mineral water market in Austria, to comply with EU requirements before the targeted time. The EU’s Single-use Plastics Directive has stipulated that drink caps will be tethered to the bottle post-opening to limit environmental pollution. Vöslauer is the first company to introduce such as cap for its 1-liter bottles in the Australian mineral water market. It is also the first ALPLA customer worldwide to do so.

Key Coverage in the Global Ring Pull Cap Market Research Report

  • Adjacent Study of Beverage Closures Market, Ring-pull Bottle Closures Market, and Easy-open Caps Market
  • Opportunity Assessment of Pull-ring Closures Market and Pull-tab Closures Industry
  • Future Outlook for Ring-pull Bottle Closures

Top Companies in the Ring Pull Cap Market

  • Finn-Korkki Oy
  • Pelliconi & C. SpA
  • World Bottling Cap, LLC
  • Nippon Closures Co. Ltd.
  • Crown Holdings Inc.
  • Fuzhou SKT Co., Ltd.
  • Jiangsu Changjiang Lids Co., Ltd.
  • Sonoco Products Company
  • The TNN Development Limited
  • Guala Closures Group
  • Amcor plc
  • Taiwan Hon Chuan Enterprise Co., Ltd.
  • Others

Ring Pull Cap Market by Categories

Market Bifurcation Based on Material:

  • Aluminum Ring Pull Caps
  • Steel Ring Pull Caps

Segregation Based on Cap Diameter:

  • 26 mm Ring Pull Caps
  • Other Sizes

Different End-uses of Ring Pull Caps:

  • Beer
  • Soft Drinks
  • Others

Different Regional Markets for Ring Pull Caps are:

  • North America
  • Europe
  • Asia Pacific
  • Middle East and Africa
  • Latin America

Frequently Asked Questions

How big is the ring pull cap market in 2025?

The global ring pull cap market is estimated to be valued at USD 389.5 million in 2025.

What will be the size of ring pull cap market in 2035?

The market size for the ring pull cap market is projected to reach USD 560.4 million by 2035.

How much will be the ring pull cap market growth between 2025 and 2035?

The ring pull cap market is expected to grow at a 3.7% CAGR between 2025 and 2035.

What are the key product types in the ring pull cap market?

The key product types in ring pull cap market are aluminum ring pull caps and steel ring pull caps.

Which cap diameter segment to contribute significant share in the ring pull cap market in 2025?

In terms of cap diameter, 26 mm ring pull caps segment to command 62.1% share in the ring pull cap market in 2025.

Table of Content

  1. Executive Summary
    • Global Market Outlook
    • Demand-side Trends
    • Supply-side Trends
    • Technology Roadmap Analysis
    • Analysis and Recommendations
  2. Market Overview
    • Market Coverage / Taxonomy
    • Market Definition / Scope / Limitations
  3. Market Background
    • Market Dynamics
      • Drivers
      • Restraints
      • Opportunity
      • Trends
    • Scenario Forecast
      • Demand in Optimistic Scenario
      • Demand in Likely Scenario
      • Demand in Conservative Scenario
    • Opportunity Map Analysis
    • Product Life Cycle Analysis
    • Supply Chain Analysis
    • Investment Feasibility Matrix
    • Value Chain Analysis
    • PESTLE and Porter’s Analysis
    • Regulatory Landscape
    • Regional Parent Market Outlook
    • Production and Consumption Statistics
    • Import and Export Statistics
  4. Global Market Analysis 2020 to 2024 and Forecast, 2025 to 2035
    • Historical Market Size Value (USD Million) Analysis, 2020 to 2024
    • Current and Future Market Size Value (USD Million) Projections, 2025 to 2035
      • Y-o-Y Growth Trend Analysis
      • Absolute $ Opportunity Analysis
  5. Global Market Pricing Analysis 2020 to 2024 and Forecast 2025 to 2035
  6. Global Market Analysis 2020 to 2024 and Forecast 2025 to 2035, By Material
    • Introduction / Key Findings
    • Historical Market Size Value (USD Million) Analysis By Material , 2020 to 2024
    • Current and Future Market Size Value (USD Million) Analysis and Forecast By Material , 2025 to 2035
      • Aluminum s
      • Steel s
    • Y-o-Y Growth Trend Analysis By Material , 2020 to 2024
    • Absolute $ Opportunity Analysis By Material , 2025 to 2035
  7. Global Market Analysis 2020 to 2024 and Forecast 2025 to 2035, By Cap Diameter
    • Introduction / Key Findings
    • Historical Market Size Value (USD Million) Analysis By Cap Diameter, 2020 to 2024
    • Current and Future Market Size Value (USD Million) Analysis and Forecast By Cap Diameter, 2025 to 2035
      • 26 Mm s
      • Other Sizes
    • Y-o-Y Growth Trend Analysis By Cap Diameter, 2020 to 2024
    • Absolute $ Opportunity Analysis By Cap Diameter, 2025 to 2035
  8. Global Market Analysis 2020 to 2024 and Forecast 2025 to 2035, By End-Use
    • Introduction / Key Findings
    • Historical Market Size Value (USD Million) Analysis By End-Use, 2020 to 2024
    • Current and Future Market Size Value (USD Million) Analysis and Forecast By End-Use, 2025 to 2035
      • Beer
      • Soft Drinks
      • Others
    • Y-o-Y Growth Trend Analysis By End-Use, 2020 to 2024
    • Absolute $ Opportunity Analysis By End-Use, 2025 to 2035
  9. Global Market Analysis 2020 to 2024 and Forecast 2025 to 2035, By Region
    • Introduction
    • Historical Market Size Value (USD Million) Analysis By Region, 2020 to 2024
    • Current Market Size Value (USD Million) Analysis and Forecast By Region, 2025 to 2035
      • North America
      • Latin America
      • Western Europe
      • Eastern Europe
      • East Asia
      • South Asia and Pacific
      • Middle East & Africa
    • Market Attractiveness Analysis By Region
  10. North America Market Analysis 2020 to 2024 and Forecast 2025 to 2035, By Country
    • Historical Market Size Value (USD Million) Trend Analysis By Market Taxonomy, 2020 to 2024
    • Market Size Value (USD Million) Forecast By Market Taxonomy, 2025 to 2035
      • By Country
        • USA
        • Canada
        • Mexico
      • By Material
      • By Cap Diameter
      • By End-Use
    • Market Attractiveness Analysis
      • By Country
      • By Material
      • By Cap Diameter
      • By End-Use
    • Key Takeaways
  11. Latin America Market Analysis 2020 to 2024 and Forecast 2025 to 2035, By Country
    • Historical Market Size Value (USD Million) Trend Analysis By Market Taxonomy, 2020 to 2024
    • Market Size Value (USD Million) Forecast By Market Taxonomy, 2025 to 2035
      • By Country
        • Brazil
        • Chile
        • Rest of Latin America
      • By Material
      • By Cap Diameter
      • By End-Use
    • Market Attractiveness Analysis
      • By Country
      • By Material
      • By Cap Diameter
      • By End-Use
    • Key Takeaways
  12. Western Europe Market Analysis 2020 to 2024 and Forecast 2025 to 2035, By Country
    • Historical Market Size Value (USD Million) Trend Analysis By Market Taxonomy, 2020 to 2024
    • Market Size Value (USD Million) Forecast By Market Taxonomy, 2025 to 2035
      • By Country
        • Germany
        • UK
        • Italy
        • Spain
        • France
        • Nordic
        • BENELUX
        • Rest of Western Europe
      • By Material
      • By Cap Diameter
      • By End-Use
    • Market Attractiveness Analysis
      • By Country
      • By Material
      • By Cap Diameter
      • By End-Use
    • Key Takeaways
  13. Eastern Europe Market Analysis 2020 to 2024 and Forecast 2025 to 2035, By Country
    • Historical Market Size Value (USD Million) Trend Analysis By Market Taxonomy, 2020 to 2024
    • Market Size Value (USD Million) Forecast By Market Taxonomy, 2025 to 2035
      • By Country
        • Russia
        • Poland
        • Hungary
        • Balkan & Baltic
        • Rest of Eastern Europe
      • By Material
      • By Cap Diameter
      • By End-Use
    • Market Attractiveness Analysis
      • By Country
      • By Material
      • By Cap Diameter
      • By End-Use
    • Key Takeaways
  14. East Asia Market Analysis 2020 to 2024 and Forecast 2025 to 2035, By Country
    • Historical Market Size Value (USD Million) Trend Analysis By Market Taxonomy, 2020 to 2024
    • Market Size Value (USD Million) Forecast By Market Taxonomy, 2025 to 2035
      • By Country
        • China
        • Japan
        • South Korea
      • By Material
      • By Cap Diameter
      • By End-Use
    • Market Attractiveness Analysis
      • By Country
      • By Material
      • By Cap Diameter
      • By End-Use
    • Key Takeaways
  15. South Asia and Pacific Market Analysis 2020 to 2024 and Forecast 2025 to 2035, By Country
    • Historical Market Size Value (USD Million) Trend Analysis By Market Taxonomy, 2020 to 2024
    • Market Size Value (USD Million) Forecast By Market Taxonomy, 2025 to 2035
      • By Country
        • India
        • ASEAN
        • Australia & New Zealand
        • Rest of South Asia and Pacific
      • By Material
      • By Cap Diameter
      • By End-Use
    • Market Attractiveness Analysis
      • By Country
      • By Material
      • By Cap Diameter
      • By End-Use
    • Key Takeaways
  16. Middle East & Africa Market Analysis 2020 to 2024 and Forecast 2025 to 2035, By Country
    • Historical Market Size Value (USD Million) Trend Analysis By Market Taxonomy, 2020 to 2024
    • Market Size Value (USD Million) Forecast By Market Taxonomy, 2025 to 2035
      • By Country
        • Kingdom of Saudi Arabia
        • Other GCC Countries
        • Turkiye
        • South Africa
        • Other African Union
        • Rest of Middle East & Africa
      • By Material
      • By Cap Diameter
      • By End-Use
    • Market Attractiveness Analysis
      • By Country
      • By Material
      • By Cap Diameter
      • By End-Use
    • Key Takeaways
  17. Key Countries Market Analysis
    • USA
      • Pricing Analysis
      • Market Share Analysis, 2024
        • By Material
        • By Cap Diameter
        • By End-Use
    • Canada
      • Pricing Analysis
      • Market Share Analysis, 2024
        • By Material
        • By Cap Diameter
        • By End-Use
    • Mexico
      • Pricing Analysis
      • Market Share Analysis, 2024
        • By Material
        • By Cap Diameter
        • By End-Use
    • Brazil
      • Pricing Analysis
      • Market Share Analysis, 2024
        • By Material
        • By Cap Diameter
        • By End-Use
    • Chile
      • Pricing Analysis
      • Market Share Analysis, 2024
        • By Material
        • By Cap Diameter
        • By End-Use
    • Germany
      • Pricing Analysis
      • Market Share Analysis, 2024
        • By Material
        • By Cap Diameter
        • By End-Use
    • UK
      • Pricing Analysis
      • Market Share Analysis, 2024
        • By Material
        • By Cap Diameter
        • By End-Use
    • Italy
      • Pricing Analysis
      • Market Share Analysis, 2024
        • By Material
        • By Cap Diameter
        • By End-Use
    • Spain
      • Pricing Analysis
      • Market Share Analysis, 2024
        • By Material
        • By Cap Diameter
        • By End-Use
    • France
      • Pricing Analysis
      • Market Share Analysis, 2024
        • By Material
        • By Cap Diameter
        • By End-Use
    • India
      • Pricing Analysis
      • Market Share Analysis, 2024
        • By Material
        • By Cap Diameter
        • By End-Use
    • ASEAN
      • Pricing Analysis
      • Market Share Analysis, 2024
        • By Material
        • By Cap Diameter
        • By End-Use
    • Australia & New Zealand
      • Pricing Analysis
      • Market Share Analysis, 2024
        • By Material
        • By Cap Diameter
        • By End-Use
    • China
      • Pricing Analysis
      • Market Share Analysis, 2024
        • By Material
        • By Cap Diameter
        • By End-Use
    • Japan
      • Pricing Analysis
      • Market Share Analysis, 2024
        • By Material
        • By Cap Diameter
        • By End-Use
    • South Korea
      • Pricing Analysis
      • Market Share Analysis, 2024
        • By Material
        • By Cap Diameter
        • By End-Use
    • Russia
      • Pricing Analysis
      • Market Share Analysis, 2024
        • By Material
        • By Cap Diameter
        • By End-Use
    • Poland
      • Pricing Analysis
      • Market Share Analysis, 2024
        • By Material
        • By Cap Diameter
        • By End-Use
    • Hungary
      • Pricing Analysis
      • Market Share Analysis, 2024
        • By Material
        • By Cap Diameter
        • By End-Use
    • Kingdom of Saudi Arabia
      • Pricing Analysis
      • Market Share Analysis, 2024
        • By Material
        • By Cap Diameter
        • By End-Use
    • Turkiye
      • Pricing Analysis
      • Market Share Analysis, 2024
        • By Material
        • By Cap Diameter
        • By End-Use
    • South Africa
      • Pricing Analysis
      • Market Share Analysis, 2024
        • By Material
        • By Cap Diameter
        • By End-Use
  18. Market Structure Analysis
    • Competition Dashboard
    • Competition Benchmarking
    • Market Share Analysis of Top Players
      • By Regional
      • By Material
      • By Cap Diameter
      • By End-Use
  19. Competition Analysis
    • Competition Deep Dive
      • Crown Holdings Inc.
        • Overview
        • Product Portfolio
        • Profitability by Market Segments (Product/Age /Sales Channel/Region)
        • Sales Footprint
        • Strategy Overview
          • Marketing Strategy
          • Product Strategy
          • Channel Strategy
      • Guala Closures Group
      • Pelliconi & C. SpA
      • Finn-Korkki Oy
      • Amcor plc
      • Nippon Closures Co. Ltd.
      • Sonoco Products Company
      • World Bottling Cap, LLC
      • Fuzhou SKT Co., Ltd.
      • Jiangsu Changjiang Lids Co., Ltd.
      • Taiwan Hon Chuan Enterprise Co., Ltd.
      • The TNN Development Limited
  20. Assumptions & Acronyms Used
  21. Research Methodology

List of Tables

  • Table 1: Global Market Value (USD Million) Forecast by Region, 2020 to 2035
  • Table 2: Global Market Value (USD Million) Forecast by Material , 2020 to 2035
  • Table 3: Global Market Value (USD Million) Forecast by Cap Diameter, 2020 to 2035
  • Table 4: Global Market Value (USD Million) Forecast by End-Use, 2020 to 2035
  • Table 5: North America Market Value (USD Million) Forecast by Country, 2020 to 2035
  • Table 6: North America Market Value (USD Million) Forecast by Material , 2020 to 2035
  • Table 7: North America Market Value (USD Million) Forecast by Cap Diameter, 2020 to 2035
  • Table 8: North America Market Value (USD Million) Forecast by End-Use, 2020 to 2035
  • Table 9: Latin America Market Value (USD Million) Forecast by Country, 2020 to 2035
  • Table 10: Latin America Market Value (USD Million) Forecast by Material , 2020 to 2035
  • Table 11: Latin America Market Value (USD Million) Forecast by Cap Diameter, 2020 to 2035
  • Table 12: Latin America Market Value (USD Million) Forecast by End-Use, 2020 to 2035
  • Table 13: Western Europe Market Value (USD Million) Forecast by Country, 2020 to 2035
  • Table 14: Western Europe Market Value (USD Million) Forecast by Material , 2020 to 2035
  • Table 15: Western Europe Market Value (USD Million) Forecast by Cap Diameter, 2020 to 2035
  • Table 16: Western Europe Market Value (USD Million) Forecast by End-Use, 2020 to 2035
  • Table 17: Eastern Europe Market Value (USD Million) Forecast by Country, 2020 to 2035
  • Table 18: Eastern Europe Market Value (USD Million) Forecast by Material , 2020 to 2035
  • Table 19: Eastern Europe Market Value (USD Million) Forecast by Cap Diameter, 2020 to 2035
  • Table 20: Eastern Europe Market Value (USD Million) Forecast by End-Use, 2020 to 2035
  • Table 21: East Asia Market Value (USD Million) Forecast by Country, 2020 to 2035
  • Table 22: East Asia Market Value (USD Million) Forecast by Material , 2020 to 2035
  • Table 23: East Asia Market Value (USD Million) Forecast by Cap Diameter, 2020 to 2035
  • Table 24: East Asia Market Value (USD Million) Forecast by End-Use, 2020 to 2035
  • Table 25: South Asia and Pacific Market Value (USD Million) Forecast by Country, 2020 to 2035
  • Table 26: South Asia and Pacific Market Value (USD Million) Forecast by Material , 2020 to 2035
  • Table 27: South Asia and Pacific Market Value (USD Million) Forecast by Cap Diameter, 2020 to 2035
  • Table 28: South Asia and Pacific Market Value (USD Million) Forecast by End-Use, 2020 to 2035
  • Table 29: Middle East & Africa Market Value (USD Million) Forecast by Country, 2020 to 2035
  • Table 30: Middle East & Africa Market Value (USD Million) Forecast by Material , 2020 to 2035
  • Table 31: Middle East & Africa Market Value (USD Million) Forecast by Cap Diameter, 2020 to 2035
  • Table 32: Middle East & Africa Market Value (USD Million) Forecast by End-Use, 2020 to 2035

List of Figures

  • Figure 1: Global Market Pricing Analysis
  • Figure 2: Global Market Value (USD Million) Forecast 2020-2035
  • Figure 3: Global Market Value Share and BPS Analysis by Material , 2025 and 2035
  • Figure 4: Global Market Y-o-Y Growth Comparison by Material , 2025-2035
  • Figure 5: Global Market Attractiveness Analysis by Material
  • Figure 6: Global Market Value Share and BPS Analysis by Cap Diameter, 2025 and 2035
  • Figure 7: Global Market Y-o-Y Growth Comparison by Cap Diameter, 2025-2035
  • Figure 8: Global Market Attractiveness Analysis by Cap Diameter
  • Figure 9: Global Market Value Share and BPS Analysis by End-Use, 2025 and 2035
  • Figure 10: Global Market Y-o-Y Growth Comparison by End-Use, 2025-2035
  • Figure 11: Global Market Attractiveness Analysis by End-Use
  • Figure 12: Global Market Value (USD Million) Share and BPS Analysis by Region, 2025 and 2035
  • Figure 13: Global Market Y-o-Y Growth Comparison by Region, 2025-2035
  • Figure 14: Global Market Attractiveness Analysis by Region
  • Figure 15: North America Market Incremental Dollar Opportunity, 2025-2035
  • Figure 16: Latin America Market Incremental Dollar Opportunity, 2025-2035
  • Figure 17: Western Europe Market Incremental Dollar Opportunity, 2025-2035
  • Figure 18: Eastern Europe Market Incremental Dollar Opportunity, 2025-2035
  • Figure 19: East Asia Market Incremental Dollar Opportunity, 2025-2035
  • Figure 20: South Asia and Pacific Market Incremental Dollar Opportunity, 2025-2035
  • Figure 21: Middle East & Africa Market Incremental Dollar Opportunity, 2025-2035
  • Figure 22: North America Market Value Share and BPS Analysis by Country, 2025 and 2035
  • Figure 23: North America Market Value Share and BPS Analysis by Material , 2025 and 2035
  • Figure 24: North America Market Y-o-Y Growth Comparison by Material , 2025-2035
  • Figure 25: North America Market Attractiveness Analysis by Material
  • Figure 26: North America Market Value Share and BPS Analysis by Cap Diameter, 2025 and 2035
  • Figure 27: North America Market Y-o-Y Growth Comparison by Cap Diameter, 2025-2035
  • Figure 28: North America Market Attractiveness Analysis by Cap Diameter
  • Figure 29: North America Market Value Share and BPS Analysis by End-Use, 2025 and 2035
  • Figure 30: North America Market Y-o-Y Growth Comparison by End-Use, 2025-2035
  • Figure 31: North America Market Attractiveness Analysis by End-Use
  • Figure 32: Latin America Market Value Share and BPS Analysis by Country, 2025 and 2035
  • Figure 33: Latin America Market Value Share and BPS Analysis by Material , 2025 and 2035
  • Figure 34: Latin America Market Y-o-Y Growth Comparison by Material , 2025-2035
  • Figure 35: Latin America Market Attractiveness Analysis by Material
  • Figure 36: Latin America Market Value Share and BPS Analysis by Cap Diameter, 2025 and 2035
  • Figure 37: Latin America Market Y-o-Y Growth Comparison by Cap Diameter, 2025-2035
  • Figure 38: Latin America Market Attractiveness Analysis by Cap Diameter
  • Figure 39: Latin America Market Value Share and BPS Analysis by End-Use, 2025 and 2035
  • Figure 40: Latin America Market Y-o-Y Growth Comparison by End-Use, 2025-2035
  • Figure 41: Latin America Market Attractiveness Analysis by End-Use
  • Figure 42: Western Europe Market Value Share and BPS Analysis by Country, 2025 and 2035
  • Figure 43: Western Europe Market Value Share and BPS Analysis by Material , 2025 and 2035
  • Figure 44: Western Europe Market Y-o-Y Growth Comparison by Material , 2025-2035
  • Figure 45: Western Europe Market Attractiveness Analysis by Material
  • Figure 46: Western Europe Market Value Share and BPS Analysis by Cap Diameter, 2025 and 2035
  • Figure 47: Western Europe Market Y-o-Y Growth Comparison by Cap Diameter, 2025-2035
  • Figure 48: Western Europe Market Attractiveness Analysis by Cap Diameter
  • Figure 49: Western Europe Market Value Share and BPS Analysis by End-Use, 2025 and 2035
  • Figure 50: Western Europe Market Y-o-Y Growth Comparison by End-Use, 2025-2035
  • Figure 51: Western Europe Market Attractiveness Analysis by End-Use
  • Figure 52: Eastern Europe Market Value Share and BPS Analysis by Country, 2025 and 2035
  • Figure 53: Eastern Europe Market Value Share and BPS Analysis by Material , 2025 and 2035
  • Figure 54: Eastern Europe Market Y-o-Y Growth Comparison by Material , 2025-2035
  • Figure 55: Eastern Europe Market Attractiveness Analysis by Material
  • Figure 56: Eastern Europe Market Value Share and BPS Analysis by Cap Diameter, 2025 and 2035
  • Figure 57: Eastern Europe Market Y-o-Y Growth Comparison by Cap Diameter, 2025-2035
  • Figure 58: Eastern Europe Market Attractiveness Analysis by Cap Diameter
  • Figure 59: Eastern Europe Market Value Share and BPS Analysis by End-Use, 2025 and 2035
  • Figure 60: Eastern Europe Market Y-o-Y Growth Comparison by End-Use, 2025-2035
  • Figure 61: Eastern Europe Market Attractiveness Analysis by End-Use
  • Figure 62: East Asia Market Value Share and BPS Analysis by Country, 2025 and 2035
  • Figure 63: East Asia Market Value Share and BPS Analysis by Material , 2025 and 2035
  • Figure 64: East Asia Market Y-o-Y Growth Comparison by Material , 2025-2035
  • Figure 65: East Asia Market Attractiveness Analysis by Material
  • Figure 66: East Asia Market Value Share and BPS Analysis by Cap Diameter, 2025 and 2035
  • Figure 67: East Asia Market Y-o-Y Growth Comparison by Cap Diameter, 2025-2035
  • Figure 68: East Asia Market Attractiveness Analysis by Cap Diameter
  • Figure 69: East Asia Market Value Share and BPS Analysis by End-Use, 2025 and 2035
  • Figure 70: East Asia Market Y-o-Y Growth Comparison by End-Use, 2025-2035
  • Figure 71: East Asia Market Attractiveness Analysis by End-Use
  • Figure 72: South Asia and Pacific Market Value Share and BPS Analysis by Country, 2025 and 2035
  • Figure 73: South Asia and Pacific Market Value Share and BPS Analysis by Material , 2025 and 2035
  • Figure 74: South Asia and Pacific Market Y-o-Y Growth Comparison by Material , 2025-2035
  • Figure 75: South Asia and Pacific Market Attractiveness Analysis by Material
  • Figure 76: South Asia and Pacific Market Value Share and BPS Analysis by Cap Diameter, 2025 and 2035
  • Figure 77: South Asia and Pacific Market Y-o-Y Growth Comparison by Cap Diameter, 2025-2035
  • Figure 78: South Asia and Pacific Market Attractiveness Analysis by Cap Diameter
  • Figure 79: South Asia and Pacific Market Value Share and BPS Analysis by End-Use, 2025 and 2035
  • Figure 80: South Asia and Pacific Market Y-o-Y Growth Comparison by End-Use, 2025-2035
  • Figure 81: South Asia and Pacific Market Attractiveness Analysis by End-Use
  • Figure 82: Middle East & Africa Market Value Share and BPS Analysis by Country, 2025 and 2035
  • Figure 83: Middle East & Africa Market Value Share and BPS Analysis by Material , 2025 and 2035
  • Figure 84: Middle East & Africa Market Y-o-Y Growth Comparison by Material , 2025-2035
  • Figure 85: Middle East & Africa Market Attractiveness Analysis by Material
  • Figure 86: Middle East & Africa Market Value Share and BPS Analysis by Cap Diameter, 2025 and 2035
  • Figure 87: Middle East & Africa Market Y-o-Y Growth Comparison by Cap Diameter, 2025-2035
  • Figure 88: Middle East & Africa Market Attractiveness Analysis by Cap Diameter
  • Figure 89: Middle East & Africa Market Value Share and BPS Analysis by End-Use, 2025 and 2035
  • Figure 90: Middle East & Africa Market Y-o-Y Growth Comparison by End-Use, 2025-2035
  • Figure 91: Middle East & Africa Market Attractiveness Analysis by End-Use
  • Figure 92: Global Market - Tier Structure Analysis
  • Figure 93: Global Market - Company Share Analysis
Dashboard
Dashboard
Dashboard
Dashboard
Dashboard
Dashboard

Full Research Suite comprises of:

Market outlook & trends analysis

Market outlook & trends analysis

Interviews & case studies

Interviews & case studies

Strategic recommendations

Strategic recommendations

Vendor profiles & capabilities analysis

Vendor profiles & capabilities analysis

5-year forecasts

5-year forecasts

8 regions and 60+ country-level data splits

8 regions and 60+ country-level data splits

Market segment data splits

Market segment data splits

12 months of continuous data updates

12 months of continuous data updates

DELIVERED AS:

PDF EXCEL ONLINE

Full Research Suite


$5000

$7500

$10000

Buy Report Now
Similar Industry Reports

Similar Industry Reports

Steel Ring Pull Caps Market

Steel Ring Pull Caps Market

Ring Lights Market
Ring Lights Market

Ring Lights Market Size and Share Forecast Outlook 2025 to 2035

Ring Main Unit Market

Ring Main Unit Market Size and Share Forecast Outlook 2025 to 2035

Ring Panel Filters Market

Ring Panel Filters Market Size and Share Forecast Outlook 2025 to 2035

Ringworm Treatment Market

Ringworm Treatment Market - Growth & Drug Innovations 2025 to 2035

Ring Rolling Products Market

Ring Rolling Products Market Size, Growth, and Forecast 2025 to 2035

Ring Lights Market Share Analysis

A Detailed Global Analysis of Brand Share for the Ring Lights Market

Ring Panel Filters Market Share Analysis

Market Share Distribution Among Ring Panel Filters Providers

Ring Laser Gyroscope Market

Ring Laser Gyroscope Market

Moringa Tea Market
Moringa Tea Market

Moringa Tea Market Size and Share Forecast Outlook 2025 to 2035

Curing Oven Market
Curing Oven Market

Curing Oven Market Analysis Size and Share Forecast Outlook 2025 to 2035

String PV Inverter Market

String PV Inverter Market Size and Share Forecast Outlook 2025 to 2035

Spring Applied Clutches Market

Spring Applied Clutches Market Size and Share Forecast Outlook 2025 to 2035

String Inverter Market

String Inverter Market Size and Share Forecast Outlook 2025 to 2035

Moringa Oil Antioxidants Market

Moringa Oil Antioxidants Market Size and Share Forecast Outlook 2025 to 2035

Syringes and Injectable Drugs Packaging Market

Syringes and Injectable Drugs Packaging Market Size and Share Forecast Outlook 2025 to 2035

Syringe Scale Magnifiers Market

Syringe Scale Magnifiers Market Size and Share Forecast Outlook 2025 to 2035

Boring Bars Market
Boring Bars Market

Boring Bars Market Size and Share Forecast Outlook 2025 to 2035

Syringe Labels Market

Syringe Labels Market Size and Share Forecast Outlook 2025 to 2035

Stringer Pallets Market

Stringer Pallets Market Size and Share Forecast Outlook 2025 to 2035

Future Market Insights

Ring Pull Cap Market

Chat With MaRIA

Chat With

MaRIA

Hi There, I am MaRIA, Your Market Research Intelligence Assistant. How may I help you?