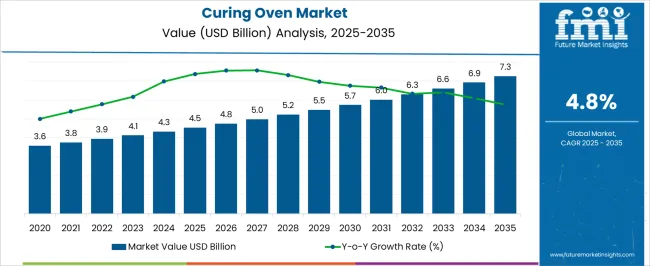
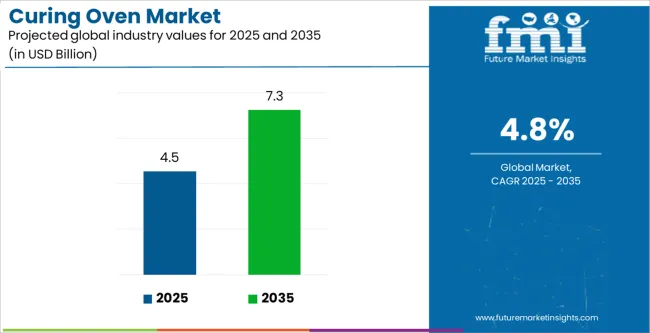
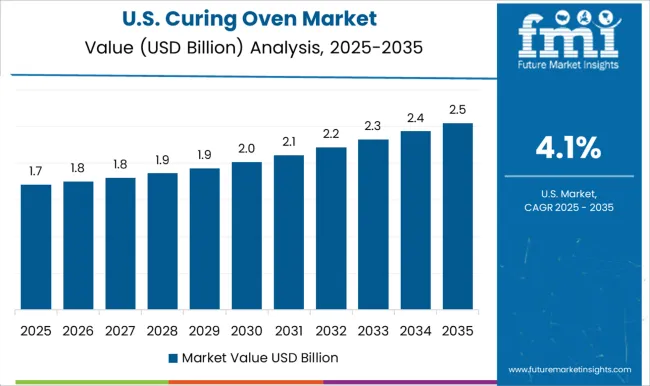
After extensive research, the curing oven market suggests an upward trajectory from 2024 to 2034, inferring a moderate CAGR of 4.80%. With preliminary valuations of USD 4332.10 million in 2024, the sales revenue of curing ovens is assuring a surge to USD 6871.90 million by 2034.
The amplifying demand for productive curing processes associated with the strengthening adoption of advanced production techniques infers considerable growth in the curing and drying oven market. The research conducted on the market reflects that the global curing oven market has the potential to experience a steady growth rate ushered by the evolution of industries like aerospace, automotive, healthcare, and electronics.
The stressing emphasis on product personalization, strict quality ethics, and energy-saving solutions bolsters the growth. The market analyst comments that vendors should keep up with the market trends to cash on the opportunities exhibited by the thriving industry.
Attributes | Details |
---|---|
Market Value for 2024 | USD 4332.10 million |
Market Value for 2034 | USD 6871.90 million |
Market CAGR from 2024 to 2034 | 4.80% |
The initial investment needed for positioning a curing and drying manufacturing unit is significant. This constrains the entry of new and smaller producers and the expansion of their operations.
The accelerated advancement in technology portrays traditional curing and drying oven models as obsolete. The producers are obligated to steadily invest in research and development to outshine technological trends and present modern approaches to customers.
Attributes | Details |
---|---|
Market Value for 2019 | USD 3259.00 million |
Market Value for 2023 | USD 4068.10 million |
Market CAGR from 2019 to 2023 | 4.50% |
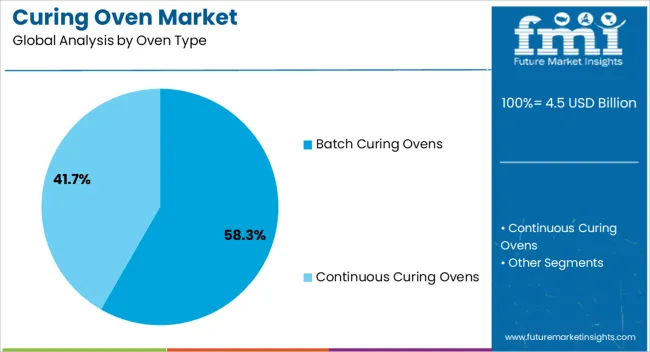
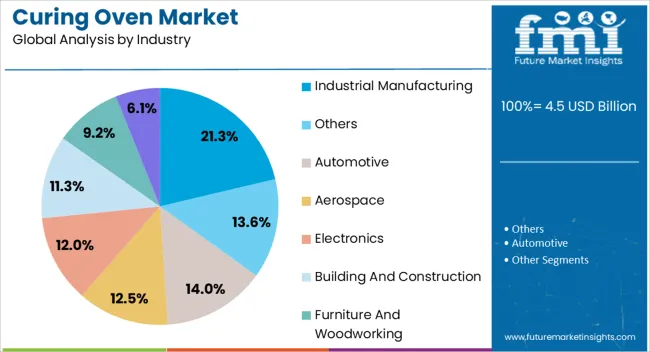
The segmented curing oven market analysis is included in the following subsection. Based on comprehensive studies, the batch oven sector is controlling the oven type category. Followed by, the industrial manufacturing sector takes precedence in the industry category.
Segment | Batch Curing Oven |
---|---|
Share (2024) | 58.30% |
Flexibility in production process cataloguing enhances operational efficiency by curbing idle time and permitting effective resource adoption. Their affordability makes them attractive to producers with an assortment of production needs and proffers an economical alternative for lower amounts.
Batch curing and drying ovens are flexible, permitting a wider degree of production flexibility by obliging an assortment of product sizes and shapes in a single cycle. Batch-curing and drying ovens enable providers to amplify their product portfolio and respond to the demand by facilitating personalization and experimentation.
Segment | Industrial Manufacturing |
---|---|
Share (2024) | 21.30% |
Curing ovens provide economical solutions that cut production costs and surge profit margins for industrial firms. The adoption of curing ovens improves operational flexibility by satisfying a variety of industrial demands, including those for adhesives and coatings.
The reputation and competition of industrial manufacturers are improved by the amplified durability and reliability of goods that are obtained through accurate curing and drying procedures. In industrial manufacturing, curing and drying ovens provide reliable performance and quality assurance that make adherence to rigid industry standards and regulations less complicated.
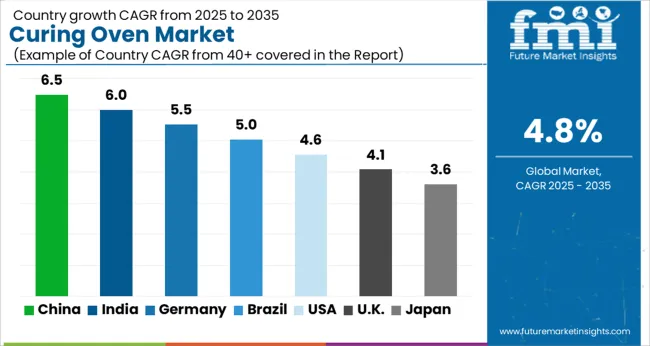
The curing oven market can be observed in the subsequent tables, which focus on the leading regions in North America, Europe, and Asia Pacific. A comprehensive evaluation demonstrates that Asia Pacific has enormous curing and drying oven market opportunities.
Demand Analysis of Curing Oven in North America
Countries | CAGR (2024 to 2034) |
---|---|
United States | 3.70% |
Canada | 4.30% |
The stronger focus on fuel efficiency is surging the adoption of curing oven technologies. Strict bylaws regarding the control of carbon emissions inspire the merger of sustainable solutions to curing and drying ovens. The evolving investments in research and development sustain innovation in curing and drying oven designs customized to particular industrial requirements.
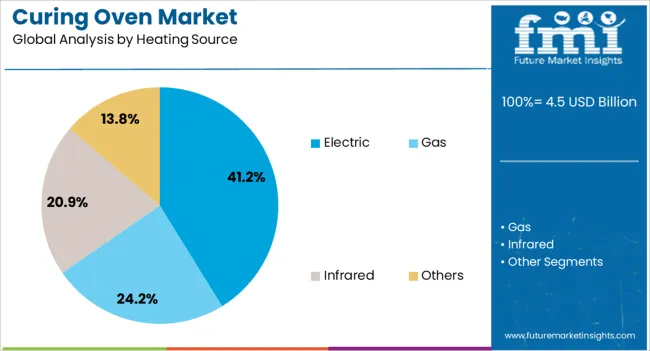
The ascending demand for high-performing curing ovens in the aerospace and automotive industries augments the market growth. Technological innovations like infrared curing are gaining popularity, offering better curing times and diminished energy usage
Perspectives for Curing Oven in Europe
Countries | CAGR (2024 to 2034) |
---|---|
France | 4.70% |
Spain | 4.50% |
Italy | 4.30% |
United Kingdom | 4.10% |
Germany | 3.90% |
The evolving pharmaceutical industries in France amplify the demand for reliable ovens to warrant the effectiveness of healthcare products. The expanding market for quality cured products in the food sector strengthens the adoption of curing oven technologies in France. With a concentration on sustainability, French producers are progressively putting money into curing ovens fitted with earth-conscious attributes to curb ecological impact.
Government schemes encouraging imperishable energy adoption are facilitating the incorporation of solar-powered ovens in Spain. Spain's promising aerospace industry thrives on the demand for specialized ovens proficient in satisfying strict performance and safety benchmarks for integrated materials. The trend towards modification and personalization in consumer products soars the adoption of small-scale curing and drying ovens by artisans and craftsmen of Spain.
Potential of the Asia Pacific Curing Oven Industry
Countries | CAGR (2024 to 2034) |
---|---|
India | 5.10% |
Australia | 4.30% |
South Korea | 4.10% |
Japan | 3.90% |
China | 3.30% |
As the Indian government focuses more on renewable energy, projects are escalating the growth of the curing and drying oven market in India, specifically in solar panel production. The expanding pharmaceutical sector, with strict rules, intensifies the adoption of curing and drying ovens for productive drug production.
The concentration on infrastructure evolution in India strengthens the adoption of curing ovens in the construction and fabricating industries. Ascending awareness concerning food safety and hygiene principles reinforces the demand for curing ovens in the agri-food industry in India. The curing and drying oven industry in India is upbeat in the proliferating electronics and automotive sectors, boosting demand for these solutions.
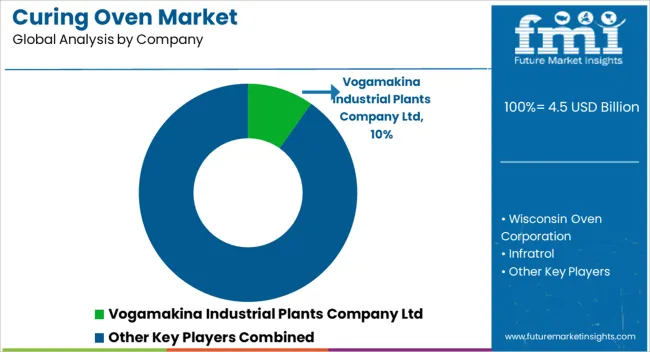
Several prominent curing oven manufacturers stand out in the market's competitive environment, each fostering innovation and growth within the sector. The main curing and drying oven producers spur competition through their dedication to quality, innovations in technology, and a wide array of products.
Among the major curing and drying oven vendors recognized for their innovations and dependability are Sailham, JPW Design and Manufacturing, and Catalytic Industrial Systems. The market's competitive dynamics are augmented by the distinctive strengths and skills that JLS Redditch Ltd, KE Hui Feiyan Shebei, and Thermal Product Solutions (TPS) bring to the table.
While Steelman Industries, Armature Coil Equipment, and Reputation Sincere DianZi offer distinctive solutions and services that meet the needs, LEWCO, WISCONSIN OVEN, and DIMA Group are preferred for being integral to the evolution of the curing and drying oven industry.
With International Thermal Systems, Changlu Group, Heller Industries, Despatch Industries, ONCE, Genlab Limited, Spooner Industries, and HENGXINDA Painting that are involved, the competitive atmosphere is strengthened, stimulating breakthroughs and soaring the market forward.
Noteworthy Observations
Company | Genlab |
---|---|
Headquarter | United Kingdom |
Portfolio |
|
Company | Thermal Product Solutions (TPS) |
---|---|
Headquarter | United States |
Portfolio |
|
Company | Despatch Industries |
---|---|
Headquarter | United States |
Portfolio |
|
Latest Developments
Company | Heller Industries |
---|---|
Headquarter | United States |
Breakthroughs |
|
Company | The Middleby Corporation |
---|---|
Headquarter | United States |
Breakthroughs |
|
Company | LEWCO |
---|---|
Headquarter | United States |
Breakthroughs |
|
Table 1: Global Market Value (US$ Million) Forecast by Region, 2019 to 2034
Table 2: Global Market Unit Forecast by Region, 2019 to 2034
Table 3: Global Market Value (US$ Million) Forecast by Oven Type, 2019 to 2034
Table 4: Global Market Unit Forecast by Oven Type, 2019 to 2034
Table 5: Global Market Value (US$ Million) Forecast by Heating Source, 2019 to 2034
Table 6: Global Market Unit Forecast by Heating Source, 2019 to 2034
Table 7: Global Market Value (US$ Million) Forecast by End-Use Industry, 2019 to 2034
Table 8: Global Market Unit Forecast by End-Use Industry, 2019 to 2034
Table 9: North America Market Value (US$ Million) Forecast by Country, 2019 to 2034
Table 10: North America Market Unit Forecast by Country, 2019 to 2034
Table 11: North America Market Value (US$ Million) Forecast by Oven Type, 2019 to 2034
Table 12: North America Market Unit Forecast by Oven Type, 2019 to 2034
Table 13: North America Market Value (US$ Million) Forecast by Heating Source, 2019 to 2034
Table 14: North America Market Unit Forecast by Heating Source, 2019 to 2034
Table 15: North America Market Value (US$ Million) Forecast by End-Use Industry, 2019 to 2034
Table 16: North America Market Unit Forecast by End-Use Industry, 2019 to 2034
Table 17: Latin America Market Value (US$ Million) Forecast by Country, 2019 to 2034
Table 18: Latin America Market Unit Forecast by Country, 2019 to 2034
Table 19: Latin America Market Value (US$ Million) Forecast by Oven Type, 2019 to 2034
Table 20: Latin America Market Unit Forecast by Oven Type, 2019 to 2034
Table 21: Latin America Market Value (US$ Million) Forecast by Heating Source, 2019 to 2034
Table 22: Latin America Market Unit Forecast by Heating Source, 2019 to 2034
Table 23: Latin America Market Value (US$ Million) Forecast by End-Use Industry, 2019 to 2034
Table 24: Latin America Market Unit Forecast by End-Use Industry, 2019 to 2034
Table 25: Western Europe Market Value (US$ Million) Forecast by Country, 2019 to 2034
Table 26: Western Europe Market Unit Forecast by Country, 2019 to 2034
Table 27: Western Europe Market Value (US$ Million) Forecast by Oven Type, 2019 to 2034
Table 28: Western Europe Market Unit Forecast by Oven Type, 2019 to 2034
Table 29: Western Europe Market Value (US$ Million) Forecast by Heating Source, 2019 to 2034
Table 30: Western Europe Market Unit Forecast by Heating Source, 2019 to 2034
Table 31: Western Europe Market Value (US$ Million) Forecast by End-Use Industry, 2019 to 2034
Table 32: Western Europe Market Unit Forecast by End-Use Industry, 2019 to 2034
Table 33: Eastern Europe Market Value (US$ Million) Forecast by Country, 2019 to 2034
Table 34: Eastern Europe Market Unit Forecast by Country, 2019 to 2034
Table 35: Eastern Europe Market Value (US$ Million) Forecast by Oven Type, 2019 to 2034
Table 36: Eastern Europe Market Unit Forecast by Oven Type, 2019 to 2034
Table 37: Eastern Europe Market Value (US$ Million) Forecast by Heating Source, 2019 to 2034
Table 38: Eastern Europe Market Unit Forecast by Heating Source, 2019 to 2034
Table 39: Eastern Europe Market Value (US$ Million) Forecast by End-Use Industry, 2019 to 2034
Table 40: Eastern Europe Market Unit Forecast by End-Use Industry, 2019 to 2034
Table 41: East Asia Market Value (US$ Million) Forecast by Country, 2019 to 2034
Table 42: East Asia Market Unit Forecast by Country, 2019 to 2034
Table 43: East Asia Market Value (US$ Million) Forecast by Oven Type, 2019 to 2034
Table 44: East Asia Market Unit Forecast by Oven Type, 2019 to 2034
Table 45: East Asia Market Value (US$ Million) Forecast by Heating Source, 2019 to 2034
Table 46: East Asia Market Unit Forecast by Heating Source, 2019 to 2034
Table 47: East Asia Market Value (US$ Million) Forecast by End-Use Industry, 2019 to 2034
Table 48: East Asia Market Unit Forecast by End-Use Industry, 2019 to 2034
Table 49: South Asia Pacific Market Value (US$ Million) Forecast by Country, 2019 to 2034
Table 50: South Asia Pacific Market Unit Forecast by Country, 2019 to 2034
Table 51: South Asia Pacific Market Value (US$ Million) Forecast by Oven Type, 2019 to 2034
Table 52: South Asia Pacific Market Unit Forecast by Oven Type, 2019 to 2034
Table 53: South Asia Pacific Market Value (US$ Million) Forecast by Heating Source, 2019 to 2034
Table 54: South Asia Pacific Market Unit Forecast by Heating Source, 2019 to 2034
Table 55: South Asia Pacific Market Value (US$ Million) Forecast by End-Use Industry, 2019 to 2034
Table 56: South Asia Pacific Market Unit Forecast by End-Use Industry, 2019 to 2034
Table 57: Middle East & Africa Market Value (US$ Million) Forecast by Country, 2019 to 2034
Table 58: Middle East & Africa Market Unit Forecast by Country, 2019 to 2034
Table 59: Middle East & Africa Market Value (US$ Million) Forecast by Oven Type, 2019 to 2034
Table 60: Middle East & Africa Market Unit Forecast by Oven Type, 2019 to 2034
Table 61: Middle East & Africa Market Value (US$ Million) Forecast by Heating Source, 2019 to 2034
Table 62: Middle East & Africa Market Unit Forecast by Heating Source, 2019 to 2034
Table 63: Middle East & Africa Market Value (US$ Million) Forecast by End-Use Industry, 2019 to 2034
Table 64: Middle East & Africa Market Unit Forecast by End-Use Industry, 2019 to 2034
Figure 1: Global Market Value (US$ Million) by Oven Type, 2024 to 2034
Figure 2: Global Market Value (US$ Million) by Heating Source, 2024 to 2034
Figure 3: Global Market Value (US$ Million) by End-Use Industry, 2024 to 2034
Figure 4: Global Market Value (US$ Million) by Region, 2024 to 2034
Figure 5: Global Market Value (US$ Million) Analysis by Region, 2019 to 2034
Figure 6: Global Market Unit Analysis by Region, 2019 to 2034
Figure 7: Global Market Value Share (%) and BPS Analysis by Region, 2024 to 2034
Figure 8: Global Market Y-o-Y Growth (%) Projections by Region, 2024 to 2034
Figure 9: Global Market Value (US$ Million) Analysis by Oven Type, 2019 to 2034
Figure 10: Global Market Unit Analysis by Oven Type, 2019 to 2034
Figure 11: Global Market Value Share (%) and BPS Analysis by Oven Type, 2024 to 2034
Figure 12: Global Market Y-o-Y Growth (%) Projections by Oven Type, 2024 to 2034
Figure 13: Global Market Value (US$ Million) Analysis by Heating Source, 2019 to 2034
Figure 14: Global Market Unit Analysis by Heating Source, 2019 to 2034
Figure 15: Global Market Value Share (%) and BPS Analysis by Heating Source, 2024 to 2034
Figure 16: Global Market Y-o-Y Growth (%) Projections by Heating Source, 2024 to 2034
Figure 17: Global Market Value (US$ Million) Analysis by End-Use Industry, 2019 to 2034
Figure 18: Global Market Unit Analysis by End-Use Industry, 2019 to 2034
Figure 19: Global Market Value Share (%) and BPS Analysis by End-Use Industry, 2024 to 2034
Figure 20: Global Market Y-o-Y Growth (%) Projections by End-Use Industry, 2024 to 2034
Figure 21: Global Market Attractiveness by Oven Type, 2024 to 2034
Figure 22: Global Market Attractiveness by Heating Source, 2024 to 2034
Figure 23: Global Market Attractiveness by End-Use Industry, 2024 to 2034
Figure 24: Global Market Attractiveness by Region, 2024 to 2034
Figure 25: North America Market Value (US$ Million) by Oven Type, 2024 to 2034
Figure 26: North America Market Value (US$ Million) by Heating Source, 2024 to 2034
Figure 27: North America Market Value (US$ Million) by End-Use Industry, 2024 to 2034
Figure 28: North America Market Value (US$ Million) by Country, 2024 to 2034
Figure 29: North America Market Value (US$ Million) Analysis by Country, 2019 to 2034
Figure 30: North America Market Unit Analysis by Country, 2019 to 2034
Figure 31: North America Market Value Share (%) and BPS Analysis by Country, 2024 to 2034
Figure 32: North America Market Y-o-Y Growth (%) Projections by Country, 2024 to 2034
Figure 33: North America Market Value (US$ Million) Analysis by Oven Type, 2019 to 2034
Figure 34: North America Market Unit Analysis by Oven Type, 2019 to 2034
Figure 35: North America Market Value Share (%) and BPS Analysis by Oven Type, 2024 to 2034
Figure 36: North America Market Y-o-Y Growth (%) Projections by Oven Type, 2024 to 2034
Figure 37: North America Market Value (US$ Million) Analysis by Heating Source, 2019 to 2034
Figure 38: North America Market Unit Analysis by Heating Source, 2019 to 2034
Figure 39: North America Market Value Share (%) and BPS Analysis by Heating Source, 2024 to 2034
Figure 40: North America Market Y-o-Y Growth (%) Projections by Heating Source, 2024 to 2034
Figure 41: North America Market Value (US$ Million) Analysis by End-Use Industry, 2019 to 2034
Figure 42: North America Market Unit Analysis by End-Use Industry, 2019 to 2034
Figure 43: North America Market Value Share (%) and BPS Analysis by End-Use Industry, 2024 to 2034
Figure 44: North America Market Y-o-Y Growth (%) Projections by End-Use Industry, 2024 to 2034
Figure 45: North America Market Attractiveness by Oven Type, 2024 to 2034
Figure 46: North America Market Attractiveness by Heating Source, 2024 to 2034
Figure 47: North America Market Attractiveness by End-Use Industry, 2024 to 2034
Figure 48: North America Market Attractiveness by Country, 2024 to 2034
Figure 49: Latin America Market Value (US$ Million) by Oven Type, 2024 to 2034
Figure 50: Latin America Market Value (US$ Million) by Heating Source, 2024 to 2034
Figure 51: Latin America Market Value (US$ Million) by End-Use Industry, 2024 to 2034
Figure 52: Latin America Market Value (US$ Million) by Country, 2024 to 2034
Figure 53: Latin America Market Value (US$ Million) Analysis by Country, 2019 to 2034
Figure 54: Latin America Market Unit Analysis by Country, 2019 to 2034
Figure 55: Latin America Market Value Share (%) and BPS Analysis by Country, 2024 to 2034
Figure 56: Latin America Market Y-o-Y Growth (%) Projections by Country, 2024 to 2034
Figure 57: Latin America Market Value (US$ Million) Analysis by Oven Type, 2019 to 2034
Figure 58: Latin America Market Unit Analysis by Oven Type, 2019 to 2034
Figure 59: Latin America Market Value Share (%) and BPS Analysis by Oven Type, 2024 to 2034
Figure 60: Latin America Market Y-o-Y Growth (%) Projections by Oven Type, 2024 to 2034
Figure 61: Latin America Market Value (US$ Million) Analysis by Heating Source, 2019 to 2034
Figure 62: Latin America Market Unit Analysis by Heating Source, 2019 to 2034
Figure 63: Latin America Market Value Share (%) and BPS Analysis by Heating Source, 2024 to 2034
Figure 64: Latin America Market Y-o-Y Growth (%) Projections by Heating Source, 2024 to 2034
Figure 65: Latin America Market Value (US$ Million) Analysis by End-Use Industry, 2019 to 2034
Figure 66: Latin America Market Unit Analysis by End-Use Industry, 2019 to 2034
Figure 67: Latin America Market Value Share (%) and BPS Analysis by End-Use Industry, 2024 to 2034
Figure 68: Latin America Market Y-o-Y Growth (%) Projections by End-Use Industry, 2024 to 2034
Figure 69: Latin America Market Attractiveness by Oven Type, 2024 to 2034
Figure 70: Latin America Market Attractiveness by Heating Source, 2024 to 2034
Figure 71: Latin America Market Attractiveness by End-Use Industry, 2024 to 2034
Figure 72: Latin America Market Attractiveness by Country, 2024 to 2034
Figure 73: Western Europe Market Value (US$ Million) by Oven Type, 2024 to 2034
Figure 74: Western Europe Market Value (US$ Million) by Heating Source, 2024 to 2034
Figure 75: Western Europe Market Value (US$ Million) by End-Use Industry, 2024 to 2034
Figure 76: Western Europe Market Value (US$ Million) by Country, 2024 to 2034
Figure 77: Western Europe Market Value (US$ Million) Analysis by Country, 2019 to 2034
Figure 78: Western Europe Market Unit Analysis by Country, 2019 to 2034
Figure 79: Western Europe Market Value Share (%) and BPS Analysis by Country, 2024 to 2034
Figure 80: Western Europe Market Y-o-Y Growth (%) Projections by Country, 2024 to 2034
Figure 81: Western Europe Market Value (US$ Million) Analysis by Oven Type, 2019 to 2034
Figure 82: Western Europe Market Unit Analysis by Oven Type, 2019 to 2034
Figure 83: Western Europe Market Value Share (%) and BPS Analysis by Oven Type, 2024 to 2034
Figure 84: Western Europe Market Y-o-Y Growth (%) Projections by Oven Type, 2024 to 2034
Figure 85: Western Europe Market Value (US$ Million) Analysis by Heating Source, 2019 to 2034
Figure 86: Western Europe Market Unit Analysis by Heating Source, 2019 to 2034
Figure 87: Western Europe Market Value Share (%) and BPS Analysis by Heating Source, 2024 to 2034
Figure 88: Western Europe Market Y-o-Y Growth (%) Projections by Heating Source, 2024 to 2034
Figure 89: Western Europe Market Value (US$ Million) Analysis by End-Use Industry, 2019 to 2034
Figure 90: Western Europe Market Unit Analysis by End-Use Industry, 2019 to 2034
Figure 91: Western Europe Market Value Share (%) and BPS Analysis by End-Use Industry, 2024 to 2034
Figure 92: Western Europe Market Y-o-Y Growth (%) Projections by End-Use Industry, 2024 to 2034
Figure 93: Western Europe Market Attractiveness by Oven Type, 2024 to 2034
Figure 94: Western Europe Market Attractiveness by Heating Source, 2024 to 2034
Figure 95: Western Europe Market Attractiveness by End-Use Industry, 2024 to 2034
Figure 96: Western Europe Market Attractiveness by Country, 2024 to 2034
Figure 97: Eastern Europe Market Value (US$ Million) by Oven Type, 2024 to 2034
Figure 98: Eastern Europe Market Value (US$ Million) by Heating Source, 2024 to 2034
Figure 99: Eastern Europe Market Value (US$ Million) by End-Use Industry, 2024 to 2034
Figure 100: Eastern Europe Market Value (US$ Million) by Country, 2024 to 2034
Figure 101: Eastern Europe Market Value (US$ Million) Analysis by Country, 2019 to 2034
Figure 102: Eastern Europe Market Unit Analysis by Country, 2019 to 2034
Figure 103: Eastern Europe Market Value Share (%) and BPS Analysis by Country, 2024 to 2034
Figure 104: Eastern Europe Market Y-o-Y Growth (%) Projections by Country, 2024 to 2034
Figure 105: Eastern Europe Market Value (US$ Million) Analysis by Oven Type, 2019 to 2034
Figure 106: Eastern Europe Market Unit Analysis by Oven Type, 2019 to 2034
Figure 107: Eastern Europe Market Value Share (%) and BPS Analysis by Oven Type, 2024 to 2034
Figure 108: Eastern Europe Market Y-o-Y Growth (%) Projections by Oven Type, 2024 to 2034
Figure 109: Eastern Europe Market Value (US$ Million) Analysis by Heating Source, 2019 to 2034
Figure 110: Eastern Europe Market Unit Analysis by Heating Source, 2019 to 2034
Figure 111: Eastern Europe Market Value Share (%) and BPS Analysis by Heating Source, 2024 to 2034
Figure 112: Eastern Europe Market Y-o-Y Growth (%) Projections by Heating Source, 2024 to 2034
Figure 113: Eastern Europe Market Value (US$ Million) Analysis by End-Use Industry, 2019 to 2034
Figure 114: Eastern Europe Market Unit Analysis by End-Use Industry, 2019 to 2034
Figure 115: Eastern Europe Market Value Share (%) and BPS Analysis by End-Use Industry, 2024 to 2034
Figure 116: Eastern Europe Market Y-o-Y Growth (%) Projections by End-Use Industry, 2024 to 2034
Figure 117: Eastern Europe Market Attractiveness by Oven Type, 2024 to 2034
Figure 118: Eastern Europe Market Attractiveness by Heating Source, 2024 to 2034
Figure 119: Eastern Europe Market Attractiveness by End-Use Industry, 2024 to 2034
Figure 120: Eastern Europe Market Attractiveness by Country, 2024 to 2034
Figure 121: East Asia Market Value (US$ Million) by Oven Type, 2024 to 2034
Figure 122: East Asia Market Value (US$ Million) by Heating Source, 2024 to 2034
Figure 123: East Asia Market Value (US$ Million) by End-Use Industry, 2024 to 2034
Figure 124: East Asia Market Value (US$ Million) by Country, 2024 to 2034
Figure 125: East Asia Market Value (US$ Million) Analysis by Country, 2019 to 2034
Figure 126: East Asia Market Unit Analysis by Country, 2019 to 2034
Figure 127: East Asia Market Value Share (%) and BPS Analysis by Country, 2024 to 2034
Figure 128: East Asia Market Y-o-Y Growth (%) Projections by Country, 2024 to 2034
Figure 129: East Asia Market Value (US$ Million) Analysis by Oven Type, 2019 to 2034
Figure 130: East Asia Market Unit Analysis by Oven Type, 2019 to 2034
Figure 131: East Asia Market Value Share (%) and BPS Analysis by Oven Type, 2024 to 2034
Figure 132: East Asia Market Y-o-Y Growth (%) Projections by Oven Type, 2024 to 2034
Figure 133: East Asia Market Value (US$ Million) Analysis by Heating Source, 2019 to 2034
Figure 134: East Asia Market Unit Analysis by Heating Source, 2019 to 2034
Figure 135: East Asia Market Value Share (%) and BPS Analysis by Heating Source, 2024 to 2034
Figure 136: East Asia Market Y-o-Y Growth (%) Projections by Heating Source, 2024 to 2034
Figure 137: East Asia Market Value (US$ Million) Analysis by End-Use Industry, 2019 to 2034
Figure 138: East Asia Market Unit Analysis by End-Use Industry, 2019 to 2034
Figure 139: East Asia Market Value Share (%) and BPS Analysis by End-Use Industry, 2024 to 2034
Figure 140: East Asia Market Y-o-Y Growth (%) Projections by End-Use Industry, 2024 to 2034
Figure 141: East Asia Market Attractiveness by Oven Type, 2024 to 2034
Figure 142: East Asia Market Attractiveness by Heating Source, 2024 to 2034
Figure 143: East Asia Market Attractiveness by End-Use Industry, 2024 to 2034
Figure 144: East Asia Market Attractiveness by Country, 2024 to 2034
Figure 145: South Asia Pacific Market Value (US$ Million) by Oven Type, 2024 to 2034
Figure 146: South Asia Pacific Market Value (US$ Million) by Heating Source, 2024 to 2034
Figure 147: South Asia Pacific Market Value (US$ Million) by End-Use Industry, 2024 to 2034
Figure 148: South Asia Pacific Market Value (US$ Million) by Country, 2024 to 2034
Figure 149: South Asia Pacific Market Value (US$ Million) Analysis by Country, 2019 to 2034
Figure 150: South Asia Pacific Market Unit Analysis by Country, 2019 to 2034
Figure 151: South Asia Pacific Market Value Share (%) and BPS Analysis by Country, 2024 to 2034
Figure 152: South Asia Pacific Market Y-o-Y Growth (%) Projections by Country, 2024 to 2034
Figure 153: South Asia Pacific Market Value (US$ Million) Analysis by Oven Type, 2019 to 2034
Figure 154: South Asia Pacific Market Unit Analysis by Oven Type, 2019 to 2034
Figure 155: South Asia Pacific Market Value Share (%) and BPS Analysis by Oven Type, 2024 to 2034
Figure 156: South Asia Pacific Market Y-o-Y Growth (%) Projections by Oven Type, 2024 to 2034
Figure 157: South Asia Pacific Market Value (US$ Million) Analysis by Heating Source, 2019 to 2034
Figure 158: South Asia Pacific Market Unit Analysis by Heating Source, 2019 to 2034
Figure 159: South Asia Pacific Market Value Share (%) and BPS Analysis by Heating Source, 2024 to 2034
Figure 160: South Asia Pacific Market Y-o-Y Growth (%) Projections by Heating Source, 2024 to 2034
Figure 161: South Asia Pacific Market Value (US$ Million) Analysis by End-Use Industry, 2019 to 2034
Figure 162: South Asia Pacific Market Unit Analysis by End-Use Industry, 2019 to 2034
Figure 163: South Asia Pacific Market Value Share (%) and BPS Analysis by End-Use Industry, 2024 to 2034
Figure 164: South Asia Pacific Market Y-o-Y Growth (%) Projections by End-Use Industry, 2024 to 2034
Figure 165: South Asia Pacific Market Attractiveness by Oven Type, 2024 to 2034
Figure 166: South Asia Pacific Market Attractiveness by Heating Source, 2024 to 2034
Figure 167: South Asia Pacific Market Attractiveness by End-Use Industry, 2024 to 2034
Figure 168: South Asia Pacific Market Attractiveness by Country, 2024 to 2034
Figure 169: Middle East & Africa Market Value (US$ Million) by Oven Type, 2024 to 2034
Figure 170: Middle East & Africa Market Value (US$ Million) by Heating Source, 2024 to 2034
Figure 171: Middle East & Africa Market Value (US$ Million) by End-Use Industry, 2024 to 2034
Figure 172: Middle East & Africa Market Value (US$ Million) by Country, 2024 to 2034
Figure 173: Middle East & Africa Market Value (US$ Million) Analysis by Country, 2019 to 2034
Figure 174: Middle East & Africa Market Unit Analysis by Country, 2019 to 2034
Figure 175: Middle East & Africa Market Value Share (%) and BPS Analysis by Country, 2024 to 2034
Figure 176: Middle East & Africa Market Y-o-Y Growth (%) Projections by Country, 2024 to 2034
Figure 177: Middle East & Africa Market Value (US$ Million) Analysis by Oven Type, 2019 to 2034
Figure 178: Middle East & Africa Market Unit Analysis by Oven Type, 2019 to 2034
Figure 179: Middle East & Africa Market Value Share (%) and BPS Analysis by Oven Type, 2024 to 2034
Figure 180: Middle East & Africa Market Y-o-Y Growth (%) Projections by Oven Type, 2024 to 2034
Figure 181: Middle East & Africa Market Value (US$ Million) Analysis by Heating Source, 2019 to 2034
Figure 182: Middle East & Africa Market Unit Analysis by Heating Source, 2019 to 2034
Figure 183: Middle East & Africa Market Value Share (%) and BPS Analysis by Heating Source, 2024 to 2034
Figure 184: Middle East & Africa Market Y-o-Y Growth (%) Projections by Heating Source, 2024 to 2034
Figure 185: Middle East & Africa Market Value (US$ Million) Analysis by End-Use Industry, 2019 to 2034
Figure 186: Middle East & Africa Market Unit Analysis by End-Use Industry, 2019 to 2034
Figure 187: Middle East & Africa Market Value Share (%) and BPS Analysis by End-Use Industry, 2024 to 2034
Figure 188: Middle East & Africa Market Y-o-Y Growth (%) Projections by End-Use Industry, 2024 to 2034
Figure 189: Middle East & Africa Market Attractiveness by Oven Type, 2024 to 2034
Figure 190: Middle East & Africa Market Attractiveness by Heating Source, 2024 to 2034
Figure 191: Middle East & Africa Market Attractiveness by End-Use Industry, 2024 to 2034
Figure 192: Middle East & Africa Market Attractiveness by Country, 2024 to 2034
The curing and drying oven market to grab a valuation of USD 4332.10 million in 2024.
The curing and drying oven industry is slated to garner a worth of USD 6871.90 million by 2034.
The curing and drying oven market infers a moderate CAGR of 4.80% from 2024 to 2034.
Between 2019 and 2023, the curing and drying oven industry progressed at a HCAGR of 4.50%.
The batch curing oven sector is slated to gain a share of 58.30% in 2024.
The industrial manufacturing sector to command a share of 21.30% in 2024.
Explore Similar Insights
Thank you!
You will receive an email from our Business Development Manager. Please be sure to check your SPAM/JUNK folder too.