Non-woven Foldable Container Market Size and Share Forecast Outlook 2025 to 2035

The non-woven foldable container market is projected to rise from USD 3.7 billion in 2025 to USD 8.9 billion by 2035, delivering a CAGR of 8.9%. Year-on-year growth scales consistently, from USD 0.33 billion in 2026 to over USD 0.72 billion in 2035.
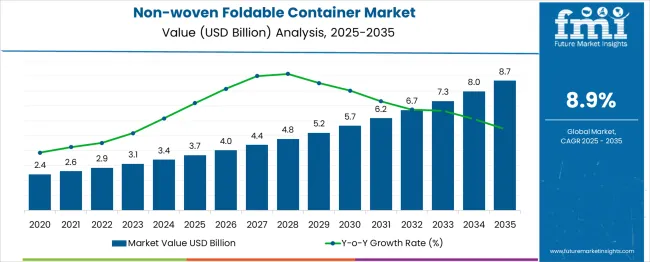
Quick Stats for Non-woven Foldable Container Market

  • Non-woven Foldable Container Market Size (2025): USD 3.7 billion
  • Projected Non-woven Foldable Container Market Size (2035): USD 8.9 billion
  • Forecast CAGR of Non-woven Foldable Container Market (2025 to 2035): 8.9%
  • Leading Segment of Non-woven Foldable Container Market (2025): Polypropylene (41.2%)
  • Key Growth Regions of Non-woven Foldable Container Market: South Asia
  • Top Key Players of Non-woven Foldable Container Market:Pack One Srl, Shenzhen Enviropack Co., Smurfit Kappa Group, Supreme Industries Ltd., Sonoco Products Company.

Non Woven Foldable Container Market Market Value Analysis

Metric Value
Industry Size (2025E) USD 3.7 billion
Industry Value (2035F) USD 8.9 billion
CAGR (2025 to 2035) 8.9%

This steady expansion is attributed to increased demand for collapsible packaging in logistics, warehousing, and last-mile distribution. Lightweight design, durability, and cost efficiency make non-woven containers preferable for e-commerce and food delivery segments. Manufacturers benefit from rising automation in packaging and an emphasis on reusable solutions.

By 2030, adoption accelerates as circular economy policies and import-export compliance favor foldable formats. Asian and Latin American industries are expected to lead volume growth due to trade-driven containerization.

On April 30, 2025, Tony Smurfit, CEO of Smurfit WestRock, stated, “Smurfit Kappa Group has delivered a very strong first quarter. These results reflect the continuing benefits of our multi-year capital plans and the dedication and commitment of our people, providing the most sustainable and innovative packaging solutions for our customers… our combination with WestRock creates a global leader in innovative and sustainable packaging with a very exciting future for all stakeholders.”

Non-woven foldable container market holds a relatively small yet growing share across its parent markets. Within the foldable and collapsible container segment, they represent approximately 10-15%, as plastic and metal variants continue to dominate.

In the reusable storage and organization market, which includes fabric bins and storage cubes, non-woven foldables account for about 10-12% based on material usage. They contribute nearly 15% to the reusable shopping and carry bag segment, driven by eco-conscious retail practices. In the industrial and logistics storage category, non-woven variants hold around 8-10%, with adoption rising in lightweight packaging. For the home and consumer organization market, their share is more significant, reaching 15-20% due to increasing demand for compact, collapsible storage solutions in residential spaces.

Analyzing Non-woven Foldable Container Market by Top Investment Segments

The industry has been segmented by material type, structure, distribution channel, end-use industry, and region. Material types include polypropylene (PP), polyethylene terephthalate (PET), and high-density polyethylene (HDPE). Structures are categorized into rigid, foldable, and semi-flexible formats.

Distribution is dominated by direct sales (B2B) and supported by third-party channels. Key end-use industries include food and beverage, pharmaceuticals, electronics, agriculture, and textiles. Regional analysis spans North America, Europe, Asia Pacific, Latin America, and the Middle East & Africa, where demand is shaped by industrial automation levels, regulatory packaging norms, and investment in returnable logistics infrastructure.
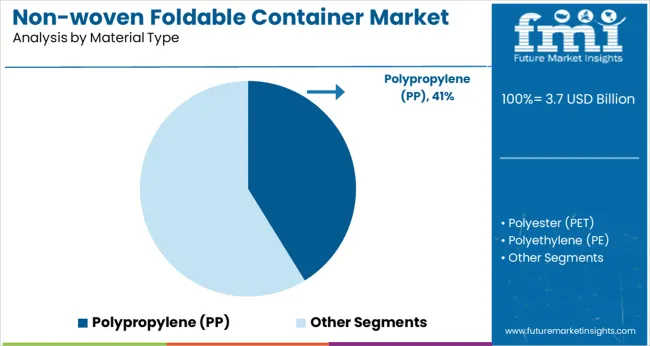
Material Preference Shifts Toward Polypropylene

Non Woven Foldable Container Market Analysis By Material Type

Polypropylene (PP) accounted for 41.2% share of the industry in 2025 due to its lightweight profile, durability, and cost-efficiency in high-volume logistics. Between 2025 and 2027, large-scale deployment of PP containers was noted across food packaging units and warehouse storage systems.

From 2028 to 2030, demand accelerated in India and China due to reusable transit packaging mandates in the FMCG sectors. By 2035, recyclability incentives in Europe and export packaging regulations in the Middle East will further solidify PP’s lead. PP remains preferred for returnable packaging across automotive and retail logistics due to ease of folding, rigidity retention, and water resistance.
  • Preferred in Asia-Pacific logistics for low-cost durability
  • Adopted by EU food chains to meet circular packaging goals
  • Widely used in automotive spare part transportation systems

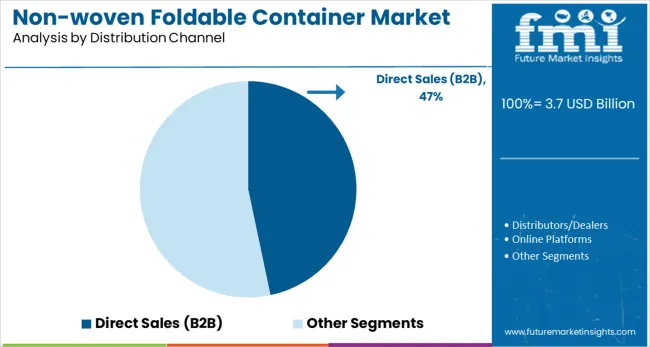
Direct Sales (B2B) Dominates Distribution Segment

Non Woven Foldable Container Market Analysis By Distribution Channel

Direct sales (B2B) represented 46.7% of the distribution channel in 2025, with manufacturers and enterprises favoring bulk procurement. From 2025 to 2027, contract-based supply chains across automotive and electronics hubs in South Korea and Germany relied heavily on direct engagement with container producers.

Between 2028 and 2032, USA food processing firms adopted direct sourcing to standardize pallet sizes and reduce downtime. In India, organized retailers formed consortia to negotiate container supply directly from vendors. This channel remains essential for large-scale industries seeking volume pricing, customization, and long-term supplier partnerships.
  • Bulk orders placed by electronics manufacturers in East Asia
  • USA processors used B2B models to reduce transit damage
  • Indian retail chains shifted to direct supplier agreements

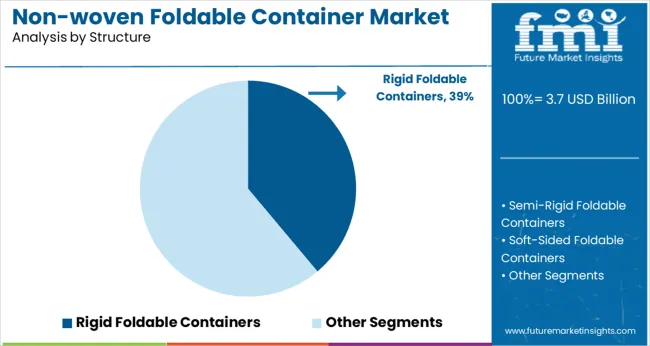
Rigid Foldable Containers Lead Structural Demand

Non Woven Foldable Container Market Analysis By Structure

Rigid foldable containers held a 38.9% share in 2025, valued for balancing durability with space-saving capability. From 2025 to 2027, German automotive OEMs and Japanese appliance exporters standardized rigid units for return logistics. Between 2028 and 2031, adoption increased across Latin American cold chains for perishables.

Use cases expanded into e-commerce warehouse automation systems by 2032, particularly in South Korea and the UK These containers continue to outperform soft-sided variants in terms of load-bearing strength and compatibility with automated storage and retrieval systems (ASRS).
  • Used by auto OEMs in Europe and Japan for component returns
  • Deployed in cold chains for meat and dairy transport
  • Integrated with ASRS systems in advanced warehousing hubs

Food & Beverage Emerges as Key End-use Sector

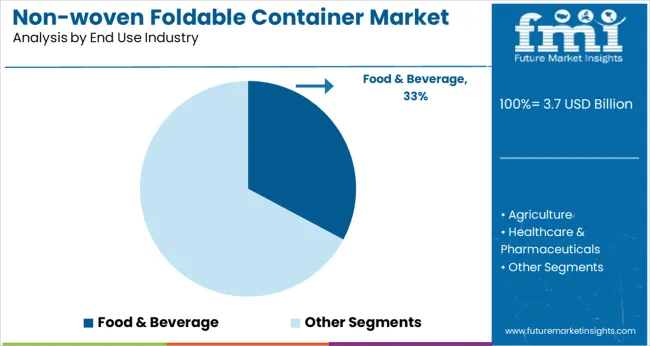
Non Woven Foldable Container Market Analysis By End Use Industry

The food and beverage industry held 32.8% of industry share in 2025, driven by a rising focus on hygienic and reusable secondary packaging. Between 2025 and 2027, USA and Canadian producers adopted foldable crates for fresh produce to meet retailer shelf-life targets.

From 2028 to 2031, dairy firms in the Middle East and confectionery exporters in Europe transitioned to non-woven containers to improve return logistics. By 2035, Southeast Asian beverage companies will utilize rigid containers for inter-facility transit under controlled environments. Food-grade compliance, easy sanitation, and reduced breakage supported continued use in packaged and fresh food logistics.

  • Adopted by USA Agrowers for produce and leafy greens
  • Used by Gulf dairy processors to streamline cold transport
  • Preferred by beverage bottlers for internal warehouse movements

Top Non-woven Foldable Container Market Dynamics

The industry is being shaped by increased demand for space-efficient, reusable packaging across retail, logistics, and industrial sectors. While the format supports supply chain agility and cost control, high setup costs and integration limitations pose notable constraints.

Rising Demand for Space-Saving and Reusable Formats

Non-woven foldable containers are increasingly adopted in sectors like automotive, e-commerce, and food distribution, where storage optimization and return logistics efficiency are critical. Studies show that collapsible formats can reduce reverse logistics volume by 70-80%, directly lowering backhaul costs.

Their lightweight non-woven design-typically 30-50% lighter than rigid plastic bins-enhances ergonomic handling and reduces workplace injuries. Reuse rates average 35-50 cycles per unit, significantly extending lifecycle value versus single-use corrugated alternatives, especially in high-frequency fulfillment operations.

  • Folded containers reduce return-trip volume by up to 80%
  • Average lifecycle reuse: 35-50 rotations before retirement
  • 30-50% lighter than rigid plastic bins, improving handling and stackability

Adoption Barriers Linked to Cost and Compatibility

Initial capital expenditure for non-woven foldable containers averages USD 6-9 per unit, compared to USD 1.5-3 for traditional corrugated options, limiting access for mid-sized players. Less than 25% of warehouses globally have automated systems fully compatible with foldable designs, creating bottlenecks in digital tracking and movement. In Asia and Latin America, regulatory variations delay market entry certification lead times range from 3 to 9 months depending on the destination. These factors combined have slowed adoption outside top-tier retail and logistics networks.
  • Unit cost is 3× higher than corrugated alternatives (USD 6-9 vs. USD 1.5-3)
  • Only 25% of global warehouses support foldable integration natively
  • Certification delays in key markets average 3-9 months per SKU approval

Top Countries Manufacturing, Deploying, and Scaling Non-Woven Foldable Containers

Non Woven Foldable Container Market Cagr Analysis By Country

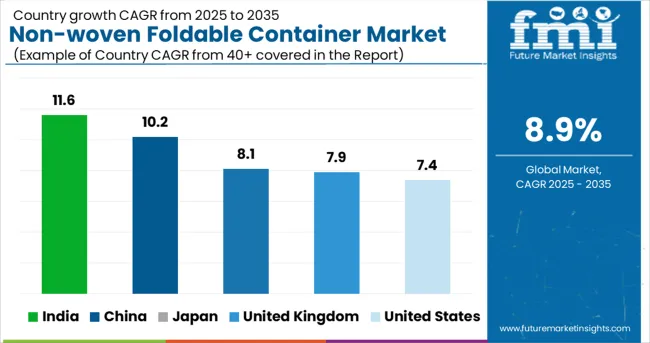
Countries CAGR (2025 to 2035)
United States 7.4%
United Kingdom 7.9%
India 11.6%
China 10.2%
Japan 8.1%

The global CAGR for non-woven foldable containers is projected at 8.9% from 2025 to 2035, with performance varying significantly across key economies. India leads at 11.6%, exceeding the global trend by over 30%, followed by China at 10.2%.

These BRICS nations are scaling output rapidly due to rising demand from e-commerce, agriculture logistics, and informal retail. The United Kingdom and Japan post moderate growth at 7.9% and 8.1% respectively, while the United States trails at 7.4%, impacted by higher input costs and slower warehouse automation cycles.

India is expanding local manufacturing zones with reusable container clusters near agri-mandis and FMCG hubs. China’s demand is tied to intra-city distribution for fresh produce and parcel services. USA demand remains steady but fragmented, while the UK and Japan see niche adoption across grocery, apparel, and pharmaceutical channels. These countries form part of a broader 40+ nation study.

Demand Outlook for Non-woven Foldable Containers in the United States

Between 2025 and 2035, the non-woven foldable container market in the United States is projected to grow at a CAGR of 7.4%. Growth is expected to be supported by adoption in last-mile delivery, retail warehousing, and omnichannel fulfillment strategies.

Logistics partners are integrating collapsible formats into automated picking systems to optimize space and cost. From 2020 to 2024, market penetration was driven by mandates and early trials in e-commerce warehouses, with moderate scale-up across national retailers.

  • Over 2,400 warehouses will integrate foldable container systems by 2024
  • Non-woven containers were used in 39% of retail chain distribution centers
  • 2.8× rise in procurement contracts was recorded in 3PL logistics from 2020 to 2024

Sales Analysis of Non-woven Foldable Containers in the United Kingdom

A CAGR of 7.9% is projected for the non-woven foldable container market in the United Kingdom from 2025 to 2035. Retailers and fulfillment centers are incorporating these units in seasonal warehousing and Q-commerce delivery infrastructure.

Expansion is expected through food, apparel, and home goods verticals. From 2020 to 2024, adoption was limited but supported by circular packaging pilots and commitments within regional supply chains, especially in Greater London.

  • Non-woven containers replaced rigid bins in 39% of UK retail stores by 2024
  • Quick-commerce hubs adopted collapsible packaging in 21 urban zones
  • Procurement volume rose 3× among logistics partners between 2020 and 2024

In-depth Analysis of Non-woven Foldable Container Market in India

Demand for non-woven foldable containersin India is projected to expand at a CAGR of 11.6% between 2025 and 2035. Growth is anticipated across garment exports, organized retail, and fast-growing warehouse networks in tier-1 and tier-2 cities.

Widespread adoption is being supported by infrastructure expansion in e-commerce and FMCG logistics. From 2020 to 2024, penetration was primarily concentrated in industrial belts and startup-driven supply chain solutions, with increased awareness emerging post-2022.

  • Bengaluru and Mumbai accounted for over 40% of demand in 2024
  • Foldable containers were integrated into 6 out of 10 textile export clusters
  • State incentives were provided for reusable format adoption across the logistics hub

Opportunity Analysis of Non-woven Foldable Containers in China

The non-woven foldable container market in China is expected to grow at a CAGR of 10.2% from 2025 to 2035. Regional logistics zones and industrial parks are increasingly deploying these systems in warehouse automation and component transit lines. Policy incentives targeting packaging recyclability are strengthening municipal demand.

From 2020 to 2024, domestic OEMs expanded production to support pilot procurement from SOEs and regional logistics hubs, with usage diversifying into sectors like automotive, electronics, and medical supplies.

  • Usage in Tier-2 cities increased 3.1× from 2021 to 2024
  • More than 180 logistics parks will deploy foldable container systems by 2024
  • Domestic production scaled 4× between 2020 and 2024 to meet inland demand

Demand Analysis for Non-woven Foldable Containers in Japan

The sale of non-woven foldable containers in Japan is forecast to grow at a CAGR of 8.1% from 2025 to 2035. Retail logistics, convenience store networks, and pharma distribution systems are expected to drive consistent demand. Growth is underpinned by a shift toward compact logistics formats and returnable container systems in high-density cities.

From 2020 to 2024, deployment remained limited but gained momentum post-pandemic as part of supply chain risk mitigation and resource optimization strategies.
  • Foldable containers were adopted by over 70% of Tokyo 3PL networks by 2024
  • Container return efficiency improved by 22% in pilot studies
  • Rail freight logistics will incorporate collapsible formats in 11 prefectures by 2024

Competitive Landscape for Non-woven Foldable Container Market

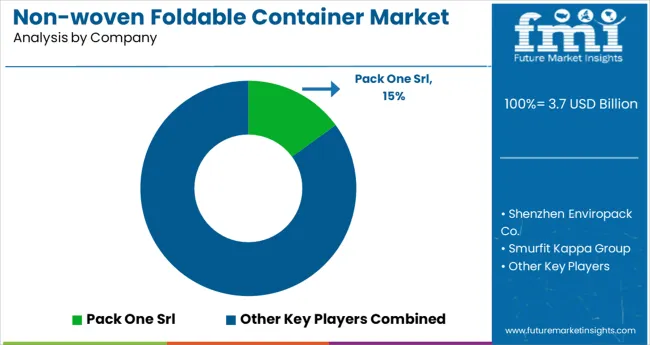
Non Woven Foldable Container Market Analysis By Company

The non-woven foldable container industry features a diverse group of companies focused on lightweight, space-efficient, and reusable packaging formats. Pack One Srl (Italy) specializes in industrial foldable containers using non-woven and hybrid fabrics suited for the mechanical and transport sectors.

Shenzhen Enviropack Co. is a prominent exporter offering non-woven storage and tote solutions across global retail and utility channels. Smurfit Kappa incorporates non-woven elements into its foldable bulk packaging systems to improve transport efficiency and reduce handling effort.

Supreme Industries Ltd. manufactures polymer-based foldable crates used widely in agriculture and storage infrastructure. Sonoco Products Company is enhancing its presence by integrating non-woven composites into its reusable container lineup, reflecting its commitment to scalable, multi-use packaging solutions.

Leading Company - Pack One SrlIndustry Share - 15%

Recent Industry News

  • On October 24, 2024, CCS launched the SeaFold HC 40′, a five-in-one ISO-certified foldable container. It collapses to one-fifth of its volume, reducing repositioning costs by 56%, storage space by 80%, and carbon emissions by up to 70%.
  • In 2024, Supreme Industries reported a 15.96% increase in total income, driven by rising demand for stackable, space-efficient polymer crates used in agriculture and industrial storage infrastructure across India and emerging markets.

Leading Companies in Non-woven Foldable Container Market

  • Pack One Srl
  • Shenzhen Enviropack Co.
  • Smurfit Kappa Group
  • Supreme Industries Ltd.
  • Sonoco Products Company
  • SILTEX
  • EPP-Packaging Solutions

Research Coverage and Scope Summary

  Report Attributes   Details
  Industry Size (2025)  USD 3.7 billion
  Projected Industry Size (2035)  USD 8.9 billion
  CAGR (2025 to 2035)  8.9%
  Base Year for Estimation  2024
  Historical Period  2020 to 2024
  Projections Period  2025 to 2035
  Quantitative Units  USD billion for value and million units for volume
  Material Types Analyzed (Segment 1)  Polypropylene (PP), Polyester (PET), Polyethylene (PE), Biodegradable Non-wovens (PLA, Starch-Based), Others (Composite Blends)
  Distribution Channels Analyzed (Segment 2)  Direct Sales (B2B), Distributors/Wholesalers, Online Platforms, Contract Packaging Services
  Structures Analyzed (Segment 3)  Rigid Foldable Containers, Semi-Rigid Foldable Containers, Soft-Sided Foldable Containers
  End Use Industries Analyzed (Segment 4)  Food & Beverage, Agriculture, Healthcare & Pharmaceuticals, Consumer Goods & Retail, Industrial Packaging
  Countries Covered  United States, Canada, Germany, United Kingdom, France, Italy, Spain, China, India, Japan, South Korea, Australia, Brazil, Mexico, Argentina, Saudi Arabia, UAE, South Africa
  Key Players  Pack One Srl, Shenzhen Enviropack Co., Smurfit Kappa Group, Supreme Industries Ltd., Sonoco Products Company, SILTEX, EPP-Packaging Solutions
  Additional Attributes  Dollar sales, share by structure and material type, growing demand from food and pharma logistics, expansion of eco-friendly and lightweight container systems, regional material substitution patterns

Key Segments

By Material Type:

The segment is categorized into Polypropylene (PP), Polyester (PET), Polyethylene (PE), Biodegradable Non-wovens (such as PLA and starch-based materials), and Others, including composite blends.

By Distribution Channel:

The industry is segmented into Direct Sales (B2B), Distributors/Wholesalers, Online Platforms, and Contract Packaging Services.

By Structure:

The category includes Rigid Foldable Containers, Semi-Rigid Foldable Containers, and Soft-Sided Foldable Containers.

By End Use Industry:

This segment covers Food & Beverage, Agriculture, Healthcare & Pharmaceuticals, Consumer Goods & Retail, and Industrial Packaging.

By Region:

Regional analysis includes North America, Europe, Asia Pacific, Latin America, and the Middle East & Africa.

Table of Content

  1. Executive Summary
    • Global Market Outlook
    • Demand-side Trends
    • Supply-side Trends
    • Technology Roadmap Analysis
    • Analysis and Recommendations
  2. Market Overview
    • Market Coverage / Taxonomy
    • Market Definition / Scope / Limitations
  3. Market Background
    • Market Dynamics
      • Drivers
      • Restraints
      • Opportunity
      • Trends
    • Scenario Forecast
      • Demand in Optimistic Scenario
      • Demand in Likely Scenario
      • Demand in Conservative Scenario
    • Opportunity Map Analysis
    • Product Life Cycle Analysis
    • Supply Chain Analysis
      • Supply Side Participants and their Roles
        • Producers
        • Mid-Level Participants (Traders/ Agents/ Brokers)
        • Wholesalers and Distributors
      • Value Added and Value Created at Node in the Supply Chain
      • List of Raw Material Suppliers
      • List of Existing and Potential Buyer’s
    • Investment Feasibility Matrix
    • Value Chain Analysis
      • Profit Margin Analysis
      • Wholesalers and Distributors
      • Retailers
    • PESTLE and Porter’s Analysis
    • Regulatory Landscape
      • By Key Regions
      • By Key Countries
    • Regional Parent Market Outlook
    • Production and Consumption Statistics
    • Import and Export Statistics
  4. Global Market Analysis 2020 to 2024 and Forecast, 2025 to 2035
    • Historical Market Size Value (USD Billion) & Volume (Million Units) Analysis, 2020 to 2024
    • Current and Future Market Size Value (USD Billion) & Volume (Million Units) Projections, 2025 to 2035
      • Y-o-Y Growth Trend Analysis
      • Absolute $ Opportunity Analysis
  5. Global Market Pricing Analysis 2020 to 2024 and Forecast 2025 to 2035
  6. Global Market Analysis 2020 to 2024 and Forecast 2025 to 2035, By Material Type
    • Introduction / Key Findings
    • Historical Market Size Value (USD Billion) & Volume (Million Units) Analysis By Material Type, 2020 to 2024
    • Current and Future Market Size Value (USD Billion) & Volume (Million Units) Analysis and Forecast By Material Type, 2025 to 2035
      • Polypropylene (PP)
      • Polyester (PET)
      • Polyethylene (PE)
      • Biodegradable Non-wovens (PLA, starch-based)
      • Others (composite blends)
    • Y-o-Y Growth Trend Analysis By Material Type, 2020 to 2024
    • Absolute $ Opportunity Analysis By Material Type, 2025 to 2035
  7. Global Market Analysis 2020 to 2024 and Forecast 2025 to 2035, By Distribution Channel
    • Introduction / Key Findings
    • Historical Market Size Value (USD Billion) & Volume (Million Units) Analysis By Distribution Channel, 2020 to 2024
    • Current and Future Market Size Value (USD Billion) & Volume (Million Units) Analysis and Forecast By Distribution Channel, 2025 to 2035
      • Direct Sales (B2B)
      • Distributors/Wholesalers
      • Online Platforms
      • Contract Packaging Services
    • Y-o-Y Growth Trend Analysis By Distribution Channel, 2020 to 2024
    • Absolute $ Opportunity Analysis By Distribution Channel, 2025 to 2035
  8. Global Market Analysis 2020 to 2024 and Forecast 2025 to 2035, By Structure
    • Introduction / Key Findings
    • Historical Market Size Value (USD Billion) & Volume (Million Units) Analysis By Structure, 2020 to 2024
    • Current and Future Market Size Value (USD Billion) & Volume (Million Units) Analysis and Forecast By Structure, 2025 to 2035
      • Rigid Foldable Containers
      • Semi-Rigid Foldable Containers
      • Soft-Sided Foldable Containers
    • Y-o-Y Growth Trend Analysis By Structure, 2020 to 2024
    • Absolute $ Opportunity Analysis By Structure, 2025 to 2035
  9. Global Market Analysis 2020 to 2024 and Forecast 2025 to 2035, By End Use Industry
    • Introduction / Key Findings
    • Historical Market Size Value (USD Billion) & Volume (Million Units) Analysis By End Use Industry, 2020 to 2024
    • Current and Future Market Size Value (USD Billion) & Volume (Million Units) Analysis and Forecast By End Use Industry, 2025 to 2035
      • Food & Beverage
      • Agriculture
      • Healthcare & Pharmaceuticals
      • Consumer Goods & Retail
      • Industrial Packaging
    • Y-o-Y Growth Trend Analysis By End Use Industry, 2020 to 2024
    • Absolute $ Opportunity Analysis By End Use Industry, 2025 to 2035
  10. Global Market Analysis 2020 to 2024 and Forecast 2025 to 2035, By Region
    • Introduction
    • Historical Market Size Value (USD Billion) & Volume (Million Units) Analysis By Region, 2020 to 2024
    • Current Market Size Value (USD Billion) & Volume (Million Units) Analysis and Forecast By Region, 2025 to 2035
      • North America
      • Latin America
      • Western Europe
      • Eastern Europe
      • East Asia
      • South Asia & Pacific
      • Middle East and Africa
    • Market Attractiveness Analysis By Region
  11. North America Market Analysis 2020 to 2024 and Forecast 2025 to 2035, By Country
    • Historical Market Size Value (USD Billion) & Volume (Million Units) Trend Analysis By Market Taxonomy, 2020 to 2024
    • Market Size Value (USD Billion) & Volume (Million Units) Forecast By Market Taxonomy, 2025 to 2035
      • By Country
        • USA
        • Canada
        • Mexico
      • By Material Type
      • By Distribution Channel
      • By Structure
      • By End Use Industry
    • Market Attractiveness Analysis
      • By Country
      • By Material Type
      • By Distribution Channel
      • By Structure
      • By End Use Industry
    • Key Takeaways
  12. Latin America Market Analysis 2020 to 2024 and Forecast 2025 to 2035, By Country
    • Historical Market Size Value (USD Billion) & Volume (Million Units) Trend Analysis By Market Taxonomy, 2020 to 2024
    • Market Size Value (USD Billion) & Volume (Million Units) Forecast By Market Taxonomy, 2025 to 2035
      • By Country
        • Brazil
        • Argentina
        • Rest of LATAM
      • By Material Type
      • By Distribution Channel
      • By Structure
      • By End Use Industry
    • Market Attractiveness Analysis
      • By Country
      • By Material Type
      • By Distribution Channel
      • By Structure
      • By End Use Industry
    • Key Takeaways
  13. Western Europe Market Analysis 2020 to 2024 and Forecast 2025 to 2035, By Country
    • Historical Market Size Value (USD Billion) & Volume (Million Units) Trend Analysis By Market Taxonomy, 2020 to 2024
    • Market Size Value (USD Billion) & Volume (Million Units) Forecast By Market Taxonomy, 2025 to 2035
      • By Country
        • Germany
        • Italy
        • France
        • UK
        • Spain
        • BENELUX
        • Nordic
        • Rest of W.Europe
      • By Material Type
      • By Distribution Channel
      • By Structure
      • By End Use Industry
    • Market Attractiveness Analysis
      • By Country
      • By Material Type
      • By Distribution Channel
      • By Structure
      • By End Use Industry
    • Key Takeaways
  14. Eastern Europe Market Analysis 2020 to 2024 and Forecast 2025 to 2035, By Country
    • Historical Market Size Value (USD Billion) & Volume (Million Units) Trend Analysis By Market Taxonomy, 2020 to 2024
    • Market Size Value (USD Billion) & Volume (Million Units) Forecast By Market Taxonomy, 2025 to 2035
      • By Country
        • Russia
        • Hungary
        • Poland
        • Balkan & Baltics
        • Rest of E. Europe
      • By Material Type
      • By Distribution Channel
      • By Structure
      • By End Use Industry
    • Market Attractiveness Analysis
      • By Country
      • By Material Type
      • By Distribution Channel
      • By Structure
      • By End Use Industry
    • Key Takeaways
  15. East Asia Market Analysis 2020 to 2024 and Forecast 2025 to 2035, By Country
    • Historical Market Size Value (USD Billion) & Volume (Million Units) Trend Analysis By Market Taxonomy, 2020 to 2024
    • Market Size Value (USD Billion) & Volume (Million Units) Forecast By Market Taxonomy, 2025 to 2035
      • By Country
        • China
        • Japan
        • South Korea
      • By Material Type
      • By Distribution Channel
      • By Structure
      • By End Use Industry
    • Market Attractiveness Analysis
      • By Country
      • By Material Type
      • By Distribution Channel
      • By Structure
      • By End Use Industry
    • Key Takeaways
  16. South Asia & Pacific Market Analysis 2020 to 2024 and Forecast 2025 to 2035, By Country
    • Historical Market Size Value (USD Billion) & Volume (Million Units) Trend Analysis By Market Taxonomy, 2020 to 2024
    • Market Size Value (USD Billion) & Volume (Million Units) Forecast By Market Taxonomy, 2025 to 2035
      • By Country
        • India
        • Australia & New Zealand
        • ASEAN
        • Rest of SAP
      • By Material Type
      • By Distribution Channel
      • By Structure
      • By End Use Industry
    • Market Attractiveness Analysis
      • By Country
      • By Material Type
      • By Distribution Channel
      • By Structure
      • By End Use Industry
    • Key Takeaways
  17. Middle East and Africa Market Analysis 2020 to 2024 and Forecast 2025 to 2035, By Country
    • Historical Market Size Value (USD Billion) & Volume (Million Units) Trend Analysis By Market Taxonomy, 2020 to 2024
    • Market Size Value (USD Billion) & Volume (Million Units) Forecast By Market Taxonomy, 2025 to 2035
      • By Country
        • GCC Countries
        • Northern Africa
        • South Africa
        • Turkiye
        • Rest of MEA
      • By Material Type
      • By Distribution Channel
      • By Structure
      • By End Use Industry
    • Market Attractiveness Analysis
      • By Country
      • By Material Type
      • By Distribution Channel
      • By Structure
      • By End Use Industry
    • Key Takeaways
  18. Key Countries Market Analysis
    • USA
      • Pricing Analysis
      • Market Share Analysis, 2024
        • By Material Type
        • By Distribution Channel
        • By Structure
        • By End Use Industry
    • Canada
      • Pricing Analysis
      • Market Share Analysis, 2024
        • By Material Type
        • By Distribution Channel
        • By Structure
        • By End Use Industry
    • Brazil
      • Pricing Analysis
      • Market Share Analysis, 2024
        • By Material Type
        • By Distribution Channel
        • By Structure
        • By End Use Industry
    • Mexico
      • Pricing Analysis
      • Market Share Analysis, 2024
        • By Material Type
        • By Distribution Channel
        • By Structure
        • By End Use Industry
    • Argentina
      • Pricing Analysis
      • Market Share Analysis, 2024
        • By Material Type
        • By Distribution Channel
        • By Structure
        • By End Use Industry
  19. Market Structure Analysis
    • Competition Dashboard
    • Competition Benchmarking
    • Market Share Analysis of Top Players
      • By Regional
      • By Material Type
      • By Distribution Channel
      • By Structure
      • By End Use Industry
  20. Competition Analysis
    • Competition Deep Dive
      • Pack One Srl
        • Overview
        • Product Portfolio
        • Profitability by Market Segments (Product/Age /Sales Channel/Region)
        • Sales Footprint
        • Strategy Overview
          • Marketing Strategy
          • Product Strategy
          • Channel Strategy
      • Shenzhen Enviropack Co.
        • Overview
        • Product Portfolio
        • Profitability by Market Segments (Product/Age /Sales Channel/Region)
        • Sales Footprint
        • Strategy Overview
          • Marketing Strategy
          • Product Strategy
          • Channel Strategy
      • Smurfit Kappa Group
        • Overview
        • Product Portfolio
        • Profitability by Market Segments (Product/Age /Sales Channel/Region)
        • Sales Footprint
        • Strategy Overview
          • Marketing Strategy
          • Product Strategy
          • Channel Strategy
      • Supreme Industries Ltd.
        • Overview
        • Product Portfolio
        • Profitability by Market Segments (Product/Age /Sales Channel/Region)
        • Sales Footprint
        • Strategy Overview
          • Marketing Strategy
          • Product Strategy
          • Channel Strategy
      • Sonoco Products Company
        • Overview
        • Product Portfolio
        • Profitability by Market Segments (Product/Age /Sales Channel/Region)
        • Sales Footprint
        • Strategy Overview
          • Marketing Strategy
          • Product Strategy
          • Channel Strategy
      • SILTEX
        • Overview
        • Product Portfolio
        • Profitability by Market Segments (Product/Age /Sales Channel/Region)
        • Sales Footprint
        • Strategy Overview
          • Marketing Strategy
          • Product Strategy
          • Channel Strategy
      • EPP-Packaging Solutions
        • Overview
        • Product Portfolio
        • Profitability by Market Segments (Product/Age /Sales Channel/Region)
        • Sales Footprint
        • Strategy Overview
          • Marketing Strategy
          • Product Strategy
          • Channel Strategy
  21. Assumptions & Acronyms Used
  22. Research Methodology

List of Tables

  • Table 1: Global Market Value (USD Billion) Forecast by Region, 2020-2035
  • Table 2: Global Market Volume (Million Units) Forecast by Region, 2020-2035
  • Table 3: Global Market Value (USD Billion) Forecast by Material Type, 2020-2035
  • Table 4: Global Market Volume (Million Units) Forecast by Material Type, 2020-2035
  • Table 5: Global Market Value (USD Billion) Forecast by Distribution Channel, 2020-2035
  • Table 6: Global Market Volume (Million Units) Forecast by Distribution Channel, 2020-2035
  • Table 7: Global Market Value (USD Billion) Forecast by Structure, 2020-2035
  • Table 8: Global Market Volume (Million Units) Forecast by Structure, 2020-2035
  • Table 9: Global Market Value (USD Billion) Forecast by End Use Industry, 2020-2035
  • Table 10: Global Market Volume (Million Units) Forecast by End Use Industry, 2020-2035
  • Table 11: North America Market Value (USD Billion) Forecast by Country, 2020-2035
  • Table 12: North America Market Volume (Million Units) Forecast by Country, 2020-2035
  • Table 13: North America Market Value (USD Billion) Forecast by Material Type, 2020-2035
  • Table 14: North America Market Volume (Million Units) Forecast by Material Type, 2020-2035
  • Table 15: North America Market Value (USD Billion) Forecast by Distribution Channel, 2020-2035
  • Table 16: North America Market Volume (Million Units) Forecast by Distribution Channel, 2020-2035
  • Table 17: North America Market Value (USD Billion) Forecast by Structure, 2020-2035
  • Table 18: North America Market Volume (Million Units) Forecast by Structure, 2020-2035
  • Table 19: North America Market Value (USD Billion) Forecast by End Use Industry, 2020-2035
  • Table 20: North America Market Volume (Million Units) Forecast by End Use Industry, 2020-2035
  • Table 21: Latin America Market Value (USD Billion) Forecast by Country, 2020-2035
  • Table 22: Latin America Market Volume (Million Units) Forecast by Country, 2020-2035
  • Table 23: Latin America Market Value (USD Billion) Forecast by Material Type, 2020-2035
  • Table 24: Latin America Market Volume (Million Units) Forecast by Material Type, 2020-2035
  • Table 25: Latin America Market Value (USD Billion) Forecast by Distribution Channel, 2020-2035
  • Table 26: Latin America Market Volume (Million Units) Forecast by Distribution Channel, 2020-2035
  • Table 27: Latin America Market Value (USD Billion) Forecast by Structure, 2020-2035
  • Table 28: Latin America Market Volume (Million Units) Forecast by Structure, 2020-2035
  • Table 29: Latin America Market Value (USD Billion) Forecast by End Use Industry, 2020-2035
  • Table 30: Latin America Market Volume (Million Units) Forecast by End Use Industry, 2020-2035
  • Table 31: Western Europe Market Value (USD Billion) Forecast by Country, 2020-2035
  • Table 32: Western Europe Market Volume (Million Units) Forecast by Country, 2020-2035
  • Table 33: Western Europe Market Value (USD Billion) Forecast by Material Type, 2020-2035
  • Table 34: Western Europe Market Volume (Million Units) Forecast by Material Type, 2020-2035
  • Table 35: Western Europe Market Value (USD Billion) Forecast by Distribution Channel, 2020-2035
  • Table 36: Western Europe Market Volume (Million Units) Forecast by Distribution Channel, 2020-2035
  • Table 37: Western Europe Market Value (USD Billion) Forecast by Structure, 2020-2035
  • Table 38: Western Europe Market Volume (Million Units) Forecast by Structure, 2020-2035
  • Table 39: Western Europe Market Value (USD Billion) Forecast by End Use Industry, 2020-2035
  • Table 40: Western Europe Market Volume (Million Units) Forecast by End Use Industry, 2020-2035
  • Table 41: Eastern Europe Market Value (USD Billion) Forecast by Country, 2020-2035
  • Table 42: Eastern Europe Market Volume (Million Units) Forecast by Country, 2020-2035
  • Table 43: Eastern Europe Market Value (USD Billion) Forecast by Material Type, 2020-2035
  • Table 44: Eastern Europe Market Volume (Million Units) Forecast by Material Type, 2020-2035
  • Table 45: Eastern Europe Market Value (USD Billion) Forecast by Distribution Channel, 2020-2035
  • Table 46: Eastern Europe Market Volume (Million Units) Forecast by Distribution Channel, 2020-2035
  • Table 47: Eastern Europe Market Value (USD Billion) Forecast by Structure, 2020-2035
  • Table 48: Eastern Europe Market Volume (Million Units) Forecast by Structure, 2020-2035
  • Table 49: Eastern Europe Market Value (USD Billion) Forecast by End Use Industry, 2020-2035
  • Table 50: Eastern Europe Market Volume (Million Units) Forecast by End Use Industry, 2020-2035
  • Table 51: East Asia Market Value (USD Billion) Forecast by Country, 2020-2035
  • Table 52: East Asia Market Volume (Million Units) Forecast by Country, 2020-2035
  • Table 53: East Asia Market Value (USD Billion) Forecast by Material Type, 2020-2035
  • Table 54: East Asia Market Volume (Million Units) Forecast by Material Type, 2020-2035
  • Table 55: East Asia Market Value (USD Billion) Forecast by Distribution Channel, 2020-2035
  • Table 56: East Asia Market Volume (Million Units) Forecast by Distribution Channel, 2020-2035
  • Table 57: East Asia Market Value (USD Billion) Forecast by Structure, 2020-2035
  • Table 58: East Asia Market Volume (Million Units) Forecast by Structure, 2020-2035
  • Table 59: East Asia Market Value (USD Billion) Forecast by End Use Industry, 2020-2035
  • Table 60: East Asia Market Volume (Million Units) Forecast by End Use Industry, 2020-2035
  • Table 61: South Asia & Pacific Market Value (USD Billion) Forecast by Country, 2020-2035
  • Table 62: South Asia & Pacific Market Volume (Million Units) Forecast by Country, 2020-2035
  • Table 63: South Asia & Pacific Market Value (USD Billion) Forecast by Material Type, 2020-2035
  • Table 64: South Asia & Pacific Market Volume (Million Units) Forecast by Material Type, 2020-2035
  • Table 65: South Asia & Pacific Market Value (USD Billion) Forecast by Distribution Channel, 2020-2035
  • Table 66: South Asia & Pacific Market Volume (Million Units) Forecast by Distribution Channel, 2020-2035
  • Table 67: South Asia & Pacific Market Value (USD Billion) Forecast by Structure, 2020-2035
  • Table 68: South Asia & Pacific Market Volume (Million Units) Forecast by Structure, 2020-2035
  • Table 69: South Asia & Pacific Market Value (USD Billion) Forecast by End Use Industry, 2020-2035
  • Table 70: South Asia & Pacific Market Volume (Million Units) Forecast by End Use Industry, 2020-2035
  • Table 71: Middle East and Africa Market Value (USD Billion) Forecast by Country, 2020-2035
  • Table 72: Middle East and Africa Market Volume (Million Units) Forecast by Country, 2020-2035
  • Table 73: Middle East and Africa Market Value (USD Billion) Forecast by Material Type, 2020-2035
  • Table 74: Middle East and Africa Market Volume (Million Units) Forecast by Material Type, 2020-2035
  • Table 75: Middle East and Africa Market Value (USD Billion) Forecast by Distribution Channel, 2020-2035
  • Table 76: Middle East and Africa Market Volume (Million Units) Forecast by Distribution Channel, 2020-2035
  • Table 77: Middle East and Africa Market Value (USD Billion) Forecast by Structure, 2020-2035
  • Table 78: Middle East and Africa Market Volume (Million Units) Forecast by Structure, 2020-2035
  • Table 79: Middle East and Africa Market Value (USD Billion) Forecast by End Use Industry, 2020-2035
  • Table 80: Middle East and Africa Market Volume (Million Units) Forecast by End Use Industry, 2020-2035

List of Figures

  • Figure 1: Global Market Volume (Million Units) Forecast 2020-2035
  • Figure 2: Global Market Pricing Analysis
  • Figure 3: Global Market Value (USD Billion) Forecast 2020-2035
  • Figure 4: Global Market Value Share and BPS Analysis by Material Type, 2025 and 2035
  • Figure 5: Global Market Y-o-Y Growth Comparison by Material Type, 2025-2035
  • Figure 6: Global Market Attractiveness Analysis by Material Type
  • Figure 7: Global Market Value Share and BPS Analysis by Distribution Channel, 2025 and 2035
  • Figure 8: Global Market Y-o-Y Growth Comparison by Distribution Channel, 2025-2035
  • Figure 9: Global Market Attractiveness Analysis by Distribution Channel
  • Figure 10: Global Market Value Share and BPS Analysis by Structure, 2025 and 2035
  • Figure 11: Global Market Y-o-Y Growth Comparison by Structure, 2025-2035
  • Figure 12: Global Market Attractiveness Analysis by Structure
  • Figure 13: Global Market Value Share and BPS Analysis by End Use Industry, 2025 and 2035
  • Figure 14: Global Market Y-o-Y Growth Comparison by End Use Industry, 2025-2035
  • Figure 15: Global Market Attractiveness Analysis by End Use Industry
  • Figure 16: Global Market Value (USD Billion) Share and BPS Analysis by Region, 2025 and 2035
  • Figure 17: Global Market Y-o-Y Growth Comparison by Region, 2025-2035
  • Figure 18: Global Market Attractiveness Analysis by Region
  • Figure 19: North America Market Incremental $ Opportunity, 2025-2035
  • Figure 20: Latin America Market Incremental $ Opportunity, 2025-2035
  • Figure 21: Western Europe Market Incremental $ Opportunity, 2025-2035
  • Figure 22: Eastern Europe Market Incremental $ Opportunity, 2025-2035
  • Figure 23: East Asia Market Incremental $ Opportunity, 2025-2035
  • Figure 24: South Asia & Pacific Market Incremental $ Opportunity, 2025-2035
  • Figure 25: Middle East and Africa Market Incremental $ Opportunity, 2025-2035
  • Figure 26: North America Market Value Share and BPS Analysis by Country, 2025 and 2035
  • Figure 27: North America Market Value Share and BPS Analysis by Material Type, 2025 and 2035
  • Figure 28: North America Market Y-o-Y Growth Comparison by Material Type, 2025-2035
  • Figure 29: North America Market Attractiveness Analysis by Material Type
  • Figure 30: North America Market Value Share and BPS Analysis by Distribution Channel, 2025 and 2035
  • Figure 31: North America Market Y-o-Y Growth Comparison by Distribution Channel, 2025-2035
  • Figure 32: North America Market Attractiveness Analysis by Distribution Channel
  • Figure 33: North America Market Value Share and BPS Analysis by Structure, 2025 and 2035
  • Figure 34: North America Market Y-o-Y Growth Comparison by Structure, 2025-2035
  • Figure 35: North America Market Attractiveness Analysis by Structure
  • Figure 36: North America Market Value Share and BPS Analysis by End Use Industry, 2025 and 2035
  • Figure 37: North America Market Y-o-Y Growth Comparison by End Use Industry, 2025-2035
  • Figure 38: North America Market Attractiveness Analysis by End Use Industry
  • Figure 39: Latin America Market Value Share and BPS Analysis by Country, 2025 and 2035
  • Figure 40: Latin America Market Value Share and BPS Analysis by Material Type, 2025 and 2035
  • Figure 41: Latin America Market Y-o-Y Growth Comparison by Material Type, 2025-2035
  • Figure 42: Latin America Market Attractiveness Analysis by Material Type
  • Figure 43: Latin America Market Value Share and BPS Analysis by Distribution Channel, 2025 and 2035
  • Figure 44: Latin America Market Y-o-Y Growth Comparison by Distribution Channel, 2025-2035
  • Figure 45: Latin America Market Attractiveness Analysis by Distribution Channel
  • Figure 46: Latin America Market Value Share and BPS Analysis by Structure, 2025 and 2035
  • Figure 47: Latin America Market Y-o-Y Growth Comparison by Structure, 2025-2035
  • Figure 48: Latin America Market Attractiveness Analysis by Structure
  • Figure 49: Latin America Market Value Share and BPS Analysis by End Use Industry, 2025 and 2035
  • Figure 50: Latin America Market Y-o-Y Growth Comparison by End Use Industry, 2025-2035
  • Figure 51: Latin America Market Attractiveness Analysis by End Use Industry
  • Figure 52: Western Europe Market Value Share and BPS Analysis by Country, 2025 and 2035
  • Figure 53: Western Europe Market Value Share and BPS Analysis by Material Type, 2025 and 2035
  • Figure 54: Western Europe Market Y-o-Y Growth Comparison by Material Type, 2025-2035
  • Figure 55: Western Europe Market Attractiveness Analysis by Material Type
  • Figure 56: Western Europe Market Value Share and BPS Analysis by Distribution Channel, 2025 and 2035
  • Figure 57: Western Europe Market Y-o-Y Growth Comparison by Distribution Channel, 2025-2035
  • Figure 58: Western Europe Market Attractiveness Analysis by Distribution Channel
  • Figure 59: Western Europe Market Value Share and BPS Analysis by Structure, 2025 and 2035
  • Figure 60: Western Europe Market Y-o-Y Growth Comparison by Structure, 2025-2035
  • Figure 61: Western Europe Market Attractiveness Analysis by Structure
  • Figure 62: Western Europe Market Value Share and BPS Analysis by End Use Industry, 2025 and 2035
  • Figure 63: Western Europe Market Y-o-Y Growth Comparison by End Use Industry, 2025-2035
  • Figure 64: Western Europe Market Attractiveness Analysis by End Use Industry
  • Figure 65: Eastern Europe Market Value Share and BPS Analysis by Country, 2025 and 2035
  • Figure 66: Eastern Europe Market Value Share and BPS Analysis by Material Type, 2025 and 2035
  • Figure 67: Eastern Europe Market Y-o-Y Growth Comparison by Material Type, 2025-2035
  • Figure 68: Eastern Europe Market Attractiveness Analysis by Material Type
  • Figure 69: Eastern Europe Market Value Share and BPS Analysis by Distribution Channel, 2025 and 2035
  • Figure 70: Eastern Europe Market Y-o-Y Growth Comparison by Distribution Channel, 2025-2035
  • Figure 71: Eastern Europe Market Attractiveness Analysis by Distribution Channel
  • Figure 72: Eastern Europe Market Value Share and BPS Analysis by Structure, 2025 and 2035
  • Figure 73: Eastern Europe Market Y-o-Y Growth Comparison by Structure, 2025-2035
  • Figure 74: Eastern Europe Market Attractiveness Analysis by Structure
  • Figure 75: Eastern Europe Market Value Share and BPS Analysis by End Use Industry, 2025 and 2035
  • Figure 76: Eastern Europe Market Y-o-Y Growth Comparison by End Use Industry, 2025-2035
  • Figure 77: Eastern Europe Market Attractiveness Analysis by End Use Industry
  • Figure 78: East Asia Market Value Share and BPS Analysis by Country, 2025 and 2035
  • Figure 79: East Asia Market Value Share and BPS Analysis by Material Type, 2025 and 2035
  • Figure 80: East Asia Market Y-o-Y Growth Comparison by Material Type, 2025-2035
  • Figure 81: East Asia Market Attractiveness Analysis by Material Type
  • Figure 82: East Asia Market Value Share and BPS Analysis by Distribution Channel, 2025 and 2035
  • Figure 83: East Asia Market Y-o-Y Growth Comparison by Distribution Channel, 2025-2035
  • Figure 84: East Asia Market Attractiveness Analysis by Distribution Channel
  • Figure 85: East Asia Market Value Share and BPS Analysis by Structure, 2025 and 2035
  • Figure 86: East Asia Market Y-o-Y Growth Comparison by Structure, 2025-2035
  • Figure 87: East Asia Market Attractiveness Analysis by Structure
  • Figure 88: East Asia Market Value Share and BPS Analysis by End Use Industry, 2025 and 2035
  • Figure 89: East Asia Market Y-o-Y Growth Comparison by End Use Industry, 2025-2035
  • Figure 90: East Asia Market Attractiveness Analysis by End Use Industry
  • Figure 91: South Asia & Pacific Market Value Share and BPS Analysis by Country, 2025 and 2035
  • Figure 92: South Asia & Pacific Market Value Share and BPS Analysis by Material Type, 2025 and 2035
  • Figure 93: South Asia & Pacific Market Y-o-Y Growth Comparison by Material Type, 2025-2035
  • Figure 94: South Asia & Pacific Market Attractiveness Analysis by Material Type
  • Figure 95: South Asia & Pacific Market Value Share and BPS Analysis by Distribution Channel, 2025 and 2035
  • Figure 96: South Asia & Pacific Market Y-o-Y Growth Comparison by Distribution Channel, 2025-2035
  • Figure 97: South Asia & Pacific Market Attractiveness Analysis by Distribution Channel
  • Figure 98: South Asia & Pacific Market Value Share and BPS Analysis by Structure, 2025 and 2035
  • Figure 99: South Asia & Pacific Market Y-o-Y Growth Comparison by Structure, 2025-2035
  • Figure 100: South Asia & Pacific Market Attractiveness Analysis by Structure
  • Figure 101: South Asia & Pacific Market Value Share and BPS Analysis by End Use Industry, 2025 and 2035
  • Figure 102: South Asia & Pacific Market Y-o-Y Growth Comparison by End Use Industry, 2025-2035
  • Figure 103: South Asia & Pacific Market Attractiveness Analysis by End Use Industry
  • Figure 104: Middle East and Africa Market Value Share and BPS Analysis by Country, 2025 and 2035
  • Figure 105: Middle East and Africa Market Value Share and BPS Analysis by Material Type, 2025 and 2035
  • Figure 106: Middle East and Africa Market Y-o-Y Growth Comparison by Material Type, 2025-2035
  • Figure 107: Middle East and Africa Market Attractiveness Analysis by Material Type
  • Figure 108: Middle East and Africa Market Value Share and BPS Analysis by Distribution Channel, 2025 and 2035
  • Figure 109: Middle East and Africa Market Y-o-Y Growth Comparison by Distribution Channel, 2025-2035
  • Figure 110: Middle East and Africa Market Attractiveness Analysis by Distribution Channel
  • Figure 111: Middle East and Africa Market Value Share and BPS Analysis by Structure, 2025 and 2035
  • Figure 112: Middle East and Africa Market Y-o-Y Growth Comparison by Structure, 2025-2035
  • Figure 113: Middle East and Africa Market Attractiveness Analysis by Structure
  • Figure 114: Middle East and Africa Market Value Share and BPS Analysis by End Use Industry, 2025 and 2035
  • Figure 115: Middle East and Africa Market Y-o-Y Growth Comparison by End Use Industry, 2025-2035
  • Figure 116: Middle East and Africa Market Attractiveness Analysis by End Use Industry
  • Figure 117: Global Market - Tier Structure Analysis
  • Figure 118: Global Market - Company Share Analysis

Frequently Asked Questions

What is the projected industry value of the non-woven foldable container market in 2025?

The industry is projected to reach USD 3.7 billion in 2025.

What is the expected global CAGR for the non-woven foldable container market from 2025 to 2035?

The industry is expected to grow at a CAGR of 8.9% from 2025 to 2035.

Which segment is expected to dominate the non-woven foldable container market in 2025?

Polypropylene is expected to capture 41.2% of the market in 2025.

Which region is forecasted to show significant growth in the non-woven foldable container market by 2035?

The Asia Pacific region, particularly India, is projected to register a CAGR of 11.6% from 2025 to 2035.

What is the forecasted industry value of the non-woven foldable container market by 2035?

The industry is projected to reach USD 8.9 billion by 2035.

Explore Similar Insights

Future Market Insights

Non-woven Foldable Container Market