SCK Paper Market Size and Share Forecast Outlook 2025 to 2035

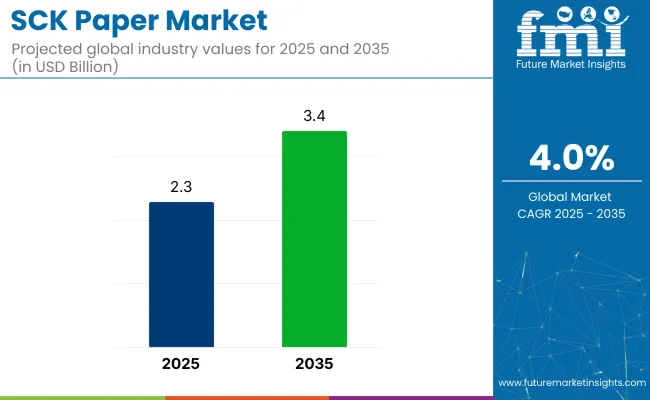
The global SCK (Super Calendered Kraft) paper market is likely to reach from USD 2.3 billion in 2025 to USD 3.4 billion by 2035, expanding at a 4.0% CAGR, driven by its superior smoothness, brightness, and strength for high-end printing and packaging applications.
Quick Stats of SCK Paper Market

  • Market Value (2025): USD 2.3 billion
  • Forecast Value (2035): USD 3.4 billion
  • Forecast CAGR: 4.0%
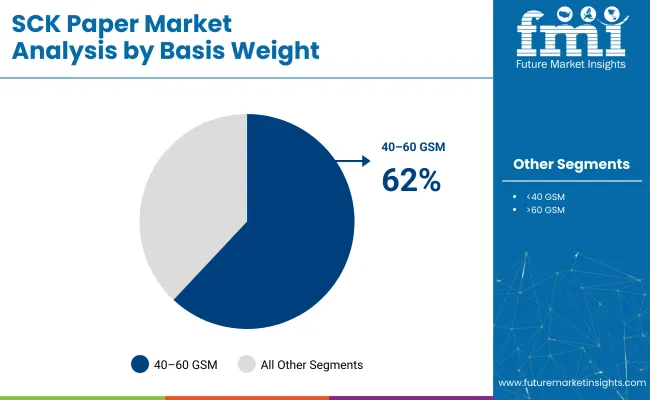
  • Leading GSM Segment: 40-60 GSM (62% market share)
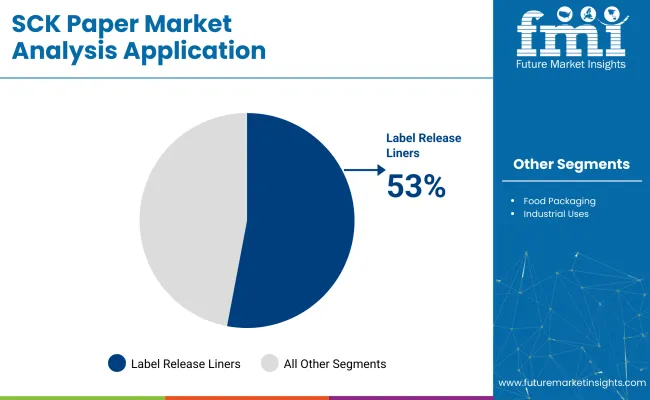
  • Top Application Segment: Label Release Liners (53% share)
  • Key Growth Region: Germany (leading Europe with 5.0% CAGR)
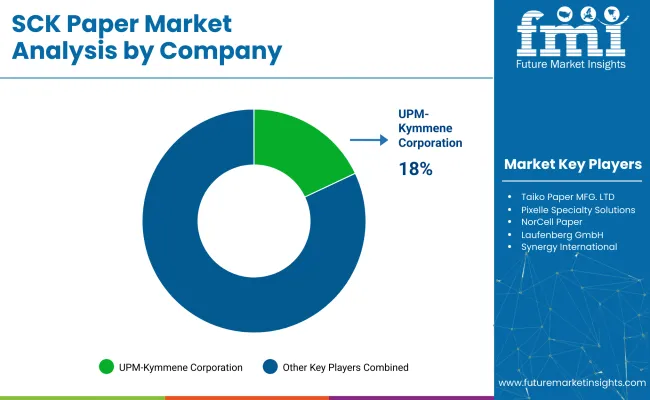
  • Leading Player: UPM-Kymmene Corporation (18% industry share)

SCK Paper Market

Attribute Detail
Market Size (2025) USD 2.3 billion
Market Size (2035) USD 3.4 billion
CAGR (2025 to 2035) 4.0%

Increasing demand for premium magazines, catalogs, and eco-friendly packaging alternatives is accelerating industry growth, as businesses prioritize recyclable and biodegradable materials over plastics. With its excellent printability and environmental benefits, SCK paper is becoming a preferred choice in publishing and e-commerce, aligning with global trends toward greener, high-performance paper solutions.

As of 2025, the super calendered kraft paper industry holds varying shares across its parent markets. It accounts for 18% of the Specialty Paper Market, 25% of the Label and Release Liner Market, and around 12% of the Flexible Packaging Paper Market. Within the Printing and Publishing Paper Market, it contributes about 7%, primarily for high-quality print applications.

In the broader Pulp and Paper Industry, its share is relatively niche at around 3%, given the dominance of commodity-grade paper types. SCK paper's strong performance in the label release liner segment, where it serves as a high-strength, printable substrate, drives its highest market penetration. Its specialized usage profile positions it as a critical, though smaller-volume, component across the specialty paper ecosystem.

In a 2024 interview with Paper and Packaging Digest, Mark Sutton, CEO of International Paper, stated, “SCK paper’s superior printability and strength make it indispensable for premium catalogs and magazines. As e-commerce packaging demand surges, we’re investing in SCK production to meet the need for high-performance, cost-effective solutions.” This underscores the company’s strategic focus on scaling SCK paper production to address rising demand in both print and packaging sectors.

With rising demand across publishing, packaging, and printing industries, the global SCK paper market is expected to continue its steady growth through 2035.

Analyzing SCK Paper Market by Top Investment Segments

In 2025, the 40-60 GSM segment dominates the Super Calendered Kraft paper market with a 62% share due to its strength and printability. Glossy finishes hold 58%, boosting appeal in premium packaging. Label release liners account for 53% of applications, while the packaging sector consumes 48%, driven by green initiative and e-commerce growth.

40-60 GSM Segment Dominates SCK Paper Market with 62% Share

The 40-60 GSM segment leads the Super Calendered Kraft paper industry, capturing a 62% share in 2025. This weight range offers a practical blend of strength and printability, favoring its use in magazines, catalog inserts, and industrial labels.
  • SCK paper's optimal tensile strength and flexibility enable smooth high-speed printing and die-cutting, making it ideal for industrial-scale production.
  • The material’s cost-efficiency and durability meet e-commerce labeling demands, driving strong demand for pressure-sensitive liners in logistics and retail.
  • Major producers like Stora Enso, Mondi, and International Paper are expanding capacity to serve growing needs in publishing, personal care, and commercial packaging industries.

SCK Paper Market Analysis by Basis Weight

Glossy Finish Captures 58% of SCK Paper Market

Glossy-finished SCK paper accounted for 58% of the industry in 2025. This finish type offers superior print definition and visual impact, increasing appeal in premium consumer packaging and advertising inserts.

  • The reflective surface of glossy Super Calendered Kraft SCK paper amplifies color vibrancy, elevating label aesthetics and shelf visibility for premium products.
  • Brand-centric industries like cosmetics, wine, and luxury confectionery prefer glossy SCK for its cost-efficient ink usage, smooth finish, and fast drying times.
  • Producers like UPM and WestRock are advancing glossy coatings to enhance abrasion resistance and texture, meeting growing demand from luxury retail and product differentiation trends.

Label Release Liners Claim 53% of SCK Paper Applications

Label release liners have captured 53% of total Super Calendered Kraft paper applications as of 2025. These liners are extensively used in pressure-sensitive adhesive systems due to their dimensional uniformity and stable caliper properties.
  • Super calendered kraft paper delivers reliable performance in high-speed die-cutting and dispensing, making it a top choice for logistics, food, and pharmaceutical packaging applications.
  • Growing e-commerce and serialized inventory tracking are driving demand for SCK paper in parcel labeling, supported by global shipping and supply chain digitization trends.
  • Leading manufacturers like 3M and Avery Dennison are enhancing silicone-coated SCK variants, optimizing liner-release force and automation compatibility for improved efficiency.

SCK Paper Market Analysis by Application

Packaging Industry Consumes 48% of SCK Paper Production

The packaging sector absorbs 48% of total SCK paper production by 2025. Its key applications include butter wrappers, confectionery wraps, interleaves, and electronics packaging.

  • Super Calendered Kraft paper’s high grease resistance and flexible caliper make it ideal for food packaging and foldable formats, while its machinability ensures efficient forming, filling, and sealing for converters.
  • As brands shift from plastic due to stricter regulations, SCK-based secondary packaging gains traction in electronics, apparel, and durable goods.
  • Producers like Sappi are developing barrier-coated SCK variants to enhance moisture resistance, meeting growing demand for paper-based packaging solutions.

Top SCK Paper Market Dynamics

Growing e-commerce and demand for high-performance labels drive SCK paper adoption. Its superior printability, durability, and cost-efficiency make it ideal for logistics, food, and luxury packaging. Key producers are expanding production to meet rising needs, while advancements in coating enhance moisture resistance and liner-release performance. The shift from plastic further accelerates market growth.

Recent Industry Trends

  • Glossy paper gains traction in cosmetics and premium labeling for enhanced shelf appeal.
  • Silicone-coated variants improve automation compatibility, boosting efficiency in high-speed printing.
  • Barrier-coated Super Calendered Kraft papers see higher demand for moisture-resistant food and pharma packaging.
  • Brands prioritize cost-effective SCK solutions with lower ink consumption and faster drying times.
  • Major players invest in capacity expansion to meet rising e-commerce and logistics labeling needs.

Challenges in the SCK Paper Market

  • Fluctuating raw material costs impact pricing stability for converters.
  • Strict regulatory standards for food-contact packaging require continuous compliance updates.
  • Competition from alternative materials pressures innovation while maintaining cost efficiency.

Top Countries Manufacturing, Synthesizing, Distributing, and Generating Demand for SCK Paper

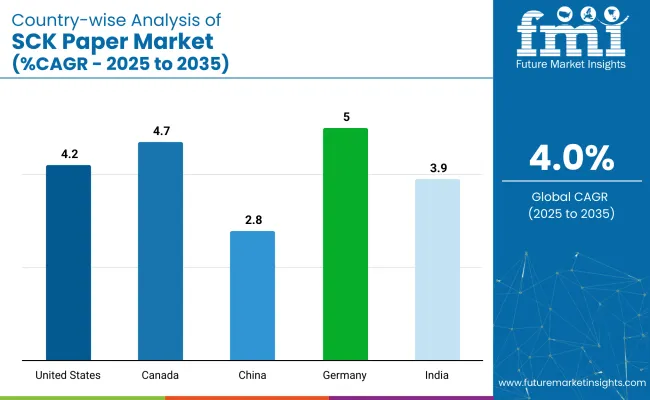
Countr-wise Analysis Of SCK Paper Market

Countries Projected CAGR (2025 to 2035)
United States 4.2%
Canada 4.7%
Germany 5.0%
China 2.8%
India 3.9%

The SCK Paper Market is witnessing steady growth across both developed and emerging economies. Germany leads with a 5.0% CAGR, driven by demand in the packaging and paper industries, particularly within the European market. Canada follows with a 4.7% CAGR, supported by strong demand for paper products in packaging, especially in the consumer goods sector.

In the United States, growth is steady at 4.2% CAGR, fueled by increased use of super calendered kraft sheets in packaging and industrial applications. India shows a 3.9% CAGR, benefiting from a growing demand for packaging solutions in the expanding industrial and retail sectors. China has the slowest growth in the group at 2.8% CAGR, reflecting a more mature market and slower adoption of SCK products.

The report covers detailed analysis of 40+ countries, with the top five countries shared as a reference.

An Overview of United States SCK Paper Market Growth

The United States super calendered kraft paper industry is forecast to grow at a 4.2% CAGR between 2025 and 2035. Growth is led by pharmaceutical packaging, logistics labeling, and retail distribution sectors that require durable, printable release liners. Federal and state policies support this trajectory.

  • FDA’s Drug Supply Chain Security Act enforces serialized labeling with precise substrates like super calendered kraft.
  • USPS labeling protocols favor Super Calendered Kraft for bulk shipment weight efficiency and structural integrity.
  • California’s SB 343 restricts non-recyclable packaging, indirectly promoting high-performance release liners.
  • Green procurement policies in government supply chains include SCK-based materials.
  • Industrial suppliers demand tear-resistant labels compliant with ASTM D3330 standards.

Canada SCK Paper Market Analysis and Growth

Canada’s super calendered kraft paper industry is growing at a steady 4.7% CAGR through 2035, driven by demand in bilingual pharmaceutical labeling and temperature-resistant logistics applications. National policy and industry programs reinforce industry expansion.

  • Health Canada mandates bilingual labeling with permanent adhesion and legibility under variable temperatures.
  • The Federal Plastics Registry accelerates adoption of fiber-based alternatives like SCK liners.
  • Provincial procurement codes in Ontario and British Columbia endorse FSC-certified SCK paper use.
  • Corrugated Paperboard Standard (CAN/CSA Z1001) recognizes high-gauge SCK as compliant for controlled substances labeling.
  • EcoLogo certifications favor low-VOC coating applications, indirectly benefiting SCK substrates in food-safe applications.

In-Depth Analysis of Germany SCK Paper Market

Germany’s super calendared kraft paper market, expanding at 5.0% CAGR, leads Europe in growth. Industrial precision and regulatory discipline define its upward trajectory. Automotive, chemical, and logistics labeling segments fuel demand.

  • VerpackG mandates traceable, recyclable substrates for all commercial packaging.
  • DIN EN ISO 9184-1 guides identification of paper fiber sources, favoring premium SCK.
  • German Packaging Institute promotes release liner upgrades in multi-sector logistics operations.
  • Automotive exports use super calendered kraft for QR-coded parts labeling with solvent-resistant coatings.
  • National Circular Economy Act encourages recyclability assessments where SCK liners perform favorably.

An Overview of China SCK Paper Market Growth

The super calendared kraft paper industry in China is projected to grow at 2.8% CAGR between 2025 and 2035. Controlled imports, rising domestic competition, and price pressures curb expansion. Regulatory frameworks are evolving but favor local substrates.

  • GB/T 4806.8 restricts chemical migration in packaging, affecting high-gloss SCK imports.
  • State-owned logistics enterprises push for cost-effective linerless formats.
  • China Green Packaging Alliance recommends kraft-blend liners, limiting SCK deployment.
  • Low-end release liner production receives VAT rebates, disincentivizing high-spec SCK consumption.
  • E-commerce giants transition to direct thermal labels, replacing multi-layer release liner structures.

India SCK Paper Market Analysis and Growth

India’s super calendered kraft paper industry is expected to grow at a 3.9% CAGR, shaped by export-oriented pharma packaging reforms and rapid expansion in organized retail logistics. Regulatory mandates enhance the demand for reliable release liners.
  • CDSCO’s barcode serialization rules require consistent adhesive compatibility, favoring SCK substrates.
  • Indian Standards IS 1060 revisions include moisture absorption limits benefiting SCK grades.
  • The National Logistics Policy mandates standardized packaging formats for express cargo-SCK preferred for label uniformity.
  • Drug export hubs in Gujarat and Telangana shift to fiber-based release liners.
  • Large retail supply chains integrate GS1-compliant labels, many using SCK backing.

Leading SCK paper Suppliers

SCK Paper Market Analysis by Company

Leading suppliers such as UPM-Kymmene, Pixelle Specialty Solutions, and Kruger Specialty Papers dominate the super calendered kraft paper space through integrated production and long-standing relationships with pressure-sensitive label manufacturers. UPM expanded its SCK range in 2024 to cater to labelstock converters seeking lightweight liners. Pixelle introduced new grades for converters demanding caliper consistency in label release. Entry into this space remains difficult due to capital-intensive calendaring lines, strict quality certifications, and high raw material dependency.

Emerging players like Taiko Paper, Cotek Papers, NorCell, and Synergy International target niche markets with custom coatings and flexible order volumes. Taiko has invested in lightweight pulp alternatives, while Cotek upgraded to a wider machine suited for faster turnarounds. The market remains moderately consolidated at the top but features fragmentation across converters and regional suppliers.

Recent Industry News

  • In March 2025, UPM-Kymmene acquired a Nordic specialty paper division to scale operations in release liner and medical-grade SCK formats.
  • In May 2025, Pixelle Specialty Solutions activated a high-speed supercalender line in Ohio to meet volume requirements in label stock and food packaging segments.

Leading players

  • Cheever Specialty Paper & Film
  • UPM-Kymmene Corporation
  • Taiko Paper MFG. LTD
  • Pixelle Specialty Solutions
  • NorCell Paper
  • Laufenberg GmbH
  • Synergy International
  • Kruger Specialty Papers
  • Cotek Papers
  • Verso

SCK Paper Market-Report Scope

Report Attributes Details
Market Size (2025) USD 2.3 billion
Projected Market Size (2035) USD 3.4 billion
CAGR (2025 to 2035) 4.0%
Base Year for Estimation 2024
Historical Period 2020 to 2024
Projections Period 2025 to 2035
Quantitative Units USD billion for value
Basis Weight Analyzed <40 GSM, 40 - 60 GSM, >60 GSM
Finish Types Analyzed Glossy, Matte, Semi-gloss
Applications Analyzed Label Release Liners (Pressure Sensitive Labels, Industrial Labels), Food Packaging (Butter Wraps, Bakery Wraps, Deli Sheets), Industrial Uses (Silicon Coating Base, Barrier Applications)
End-Use Industries Analyzed Packaging, Printing & Publishing, FMCG, Industrial Processing
Distribution Channels Analyzed Paper Mills, Distributors, Label Converters
Regions Covered North America, Europe, Asia-Pacific, Latin America, Middle East & Africa
Countries Covered United States, Canada, Germany, France, United Kingdom, Italy, Spain, China, Japan, South Korea, India, Australia, UAE, South Africa
Leading Players Cheever Specialty Paper & Film, UPM- Kymmene Corporation, Taiko Paper MFG. LTD, Pixelle Specialty Solutions, NorCell Paper, Laufenberg GmbH, Synergy International, Kruger Specialty Papers, Cotek Papers, Verso
Additional Attributes Dollar sales growth by application (labels, packaging), regional demand trends, competitive landscape, pricing strategies, material innovations, supply chain insights.

SCK Paper Market Analyzed by Key Investment Segments 

By Basis Weight:

<40 GSM, 40-60 GSM, >60 GSM

By Finish Type:

Glossy, Matte, Semi-gloss

By Application:

Label Release Liners: Pressure Sensitive Labels, Industrial LabelsFood Packaging: Butter Wraps, Bakery Wraps, Deli SheetsIndustrial Uses: Silicon Coating Base, Barrier Applications

By End-Use Industry:

Packaging, Printing & Publishing, FMCG, Industrial Processing

By Distribution Channel:

Paper Mills, Distributors, Label Converters

By Region:

North America, Europe, Asia-Pacific, Latin America, Middle East & Africa

Table of Content

  1. Executive Summary
    • Global Market Outlook
    • Demand-side Trends
    • Supply-side Trends
    • Technology Roadmap Analysis
    • Analysis and Recommendations
  2. Market Overview
    • Market Coverage / Taxonomy
    • Market Definition / Scope / Limitations
  3. Market Background
    • Market Dynamics
      • Drivers
      • Restraints
      • Opportunity
      • Trends
    • Scenario Forecast
      • Demand in Optimistic Scenario
      • Demand in Likely Scenario
      • Demand in Conservative Scenario
    • Opportunity Map Analysis
    • Product Life Cycle Analysis
    • Supply Chain Analysis
      • Supply Side Participants and their Roles
        • Producers
        • Mid-Level Participants (Traders/ Agents/ Brokers)
        • Wholesalers and Distributors
      • Value Added and Value Created at Node in the Supply Chain
      • List of Raw Material Suppliers
      • List of Existing and Potential Buyer’s
    • Investment Feasibility Matrix
    • Value Chain Analysis
      • Profit Margin Analysis
      • Wholesalers and Distributors
      • Retailers
    • PESTLE and Porter’s Analysis
    • Regulatory Landscape
      • By Key Regions
      • By Key Countries
    • Regional Parent Market Outlook
    • Production and Consumption Statistics
    • Import and Export Statistics
  4. Global Market Analysis 2020 to 2024 and Forecast, 2025 to 2035
    • Historical Market Size Value (USD Billion) & Volume (KT) Analysis, 2020 to 2024
    • Current and Future Market Size Value (USD Billion) & Volume (KT) Projections, 2025 to 2035
      • Y-o-Y Growth Trend Analysis
      • Absolute $ Opportunity Analysis
  5. Global Market Pricing Analysis 2020 to 2024 and Forecast 2025 to 2035
  6. Global Market Analysis 2020 to 2024 and Forecast 2025 to 2035, By Material Type
    • Introduction / Key Findings
    • Historical Market Size Value (USD Billion) & Volume (KT) Analysis By Material Type, 2020 to 2024
    • Current and Future Market Size Value (USD Billion) & Volume (KT) Analysis and Forecast By Material Type, 2025 to 2035
      • Silica Aerogel Films
      • Polymer Aerogel Films
      • Carbon Aerogel Films
      • Other Materials
    • Y-o-Y Growth Trend Analysis By Material Type, 2020 to 2024
    • Absolute $ Opportunity Analysis By Material Type, 2025 to 2035
  7. Global Market Analysis 2020 to 2024 and Forecast 2025 to 2035, By Basis Weight
    • Introduction / Key Findings
    • Historical Market Size Value (USD Billion) & Volume (KT) Analysis By Basis Weight, 2020 to 2024
    • Current and Future Market Size Value (USD Billion) & Volume (KT) Analysis and Forecast By Basis Weight, 2025 to 2035
      • <40 GSM
      • 40-60 GSM
      • >60 GSM
    • Y-o-Y Growth Trend Analysis By Basis Weight, 2020 to 2024
    • Absolute $ Opportunity Analysis By Basis Weight, 2025 to 2035
  8. Global Market Analysis 2020 to 2024 and Forecast 2025 to 2035, By Finish Type
    • Introduction / Key Findings
    • Historical Market Size Value (USD Billion) & Volume (KT) Analysis By Finish Type, 2020 to 2024
    • Current and Future Market Size Value (USD Billion) & Volume (KT) Analysis and Forecast By Finish Type, 2025 to 2035
      • Glossy
      • Matte
      • Semi-gloss
    • Y-o-Y Growth Trend Analysis By Finish Type, 2020 to 2024
    • Absolute $ Opportunity Analysis By Finish Type, 2025 to 2035
  9. Global Market Analysis 2020 to 2024 and Forecast 2025 to 2035, By Application
    • Introduction / Key Findings
    • Historical Market Size Value (USD Billion) & Volume (KT) Analysis By Application, 2020 to 2024
    • Current and Future Market Size Value (USD Billion) & Volume (KT) Analysis and Forecast By Application, 2025 to 2035
      • Label Release Liners
        • Industrial Labels
        • Pressure Sensitive Labels
      • Food Packaging
        • Butter Wraps
        • Bakery Wraps
        • Deli Sheets
      • Industrial Uses
        • Silicon Coating Base
        • Barrier Applications
    • Y-o-Y Growth Trend Analysis By Application, 2020 to 2024
    • Absolute $ Opportunity Analysis By Application, 2025 to 2035
  10. Global Market Analysis 2020 to 2024 and Forecast 2025 to 2035, By End-Use Industry
    • Introduction / Key Findings
    • Historical Market Size Value (USD Billion) & Volume (KT) Analysis By End-Use Industry, 2020 to 2024
    • Current and Future Market Size Value (USD Billion) & Volume (KT) Analysis and Forecast By End-Use Industry, 2025 to 2035
      • Packaging
      • Printing & Publishing
      • FMCG
      • Industrial Processing
    • Y-o-Y Growth Trend Analysis By End-Use Industry, 2020 to 2024
    • Absolute $ Opportunity Analysis By End-Use Industry, 2025 to 2035
  11. Global Market Analysis 2020 to 2024 and Forecast 2025 to 2035, By Distribution Channel
    • Introduction / Key Findings
    • Historical Market Size Value (USD Billion) & Volume (KT) Analysis By Distribution Channel, 2020 to 2024
    • Current and Future Market Size Value (USD Billion) & Volume (KT) Analysis and Forecast By Distribution Channel, 2025 to 2035
      • Paper Mills
      • Distributors
      • Label Converters
    • Y-o-Y Growth Trend Analysis By Distribution Channel, 2020 to 2024
    • Absolute $ Opportunity Analysis By Distribution Channel, 2025 to 2035
  12. Global Market Analysis 2020 to 2024 and Forecast 2025 to 2035, By Region
    • Introduction
    • Historical Market Size Value (USD Billion) & Volume (KT) Analysis By Region, 2020 to 2024
    • Current Market Size Value (USD Billion) & Volume (KT) Analysis and Forecast By Region, 2025 to 2035
      • North America
      • Latin America
      • Western Europe
      • Eastern Europe
      • East Asia
      • South Asia & Pacific
      • Middle East and Africa
    • Market Attractiveness Analysis By Region
  13. North America Market Analysis 2020 to 2024 and Forecast 2025 to 2035, By Country
    • Historical Market Size Value (USD Billion) & Volume (KT) Trend Analysis By Market Taxonomy, 2020 to 2024
    • Market Size Value (USD Billion) & Volume (KT) Forecast By Market Taxonomy, 2025 to 2035
      • By Country
        • USA
        • Canada
        • Mexico
      • By Material Type
      • By Basis Weight
      • By Finish Type
      • By Application
      • By End-Use Industry
      • By Distribution Channel
    • Market Attractiveness Analysis
      • By Country
      • By Material Type
      • By Basis Weight
      • By Finish Type
      • By Application
      • By End-Use Industry
      • By Distribution Channel
    • Key Takeaways
  14. Latin America Market Analysis 2020 to 2024 and Forecast 2025 to 2035, By Country
    • Historical Market Size Value (USD Billion) & Volume (KT) Trend Analysis By Market Taxonomy, 2020 to 2024
    • Market Size Value (USD Billion) & Volume (KT) Forecast By Market Taxonomy, 2025 to 2035
      • By Country
        • Brazil
        • Argentina
        • Rest of LATAM
      • By Material Type
      • By Basis Weight
      • By Finish Type
      • By Application
      • By End-Use Industry
      • By Distribution Channel
    • Market Attractiveness Analysis
      • By Country
      • By Material Type
      • By Basis Weight
      • By Finish Type
      • By Application
      • By End-Use Industry
      • By Distribution Channel
    • Key Takeaways
  15. Western Europe Market Analysis 2020 to 2024 and Forecast 2025 to 2035, By Country
    • Historical Market Size Value (USD Billion) & Volume (KT) Trend Analysis By Market Taxonomy, 2020 to 2024
    • Market Size Value (USD Billion) & Volume (KT) Forecast By Market Taxonomy, 2025 to 2035
      • By Country
        • Germany
        • Italy
        • France
        • UK
        • Spain
        • BENELUX
        • Nordic
        • Rest of W.Europe
      • By Material Type
      • By Basis Weight
      • By Finish Type
      • By Application
      • By End-Use Industry
      • By Distribution Channel
    • Market Attractiveness Analysis
      • By Country
      • By Material Type
      • By Basis Weight
      • By Finish Type
      • By Application
      • By End-Use Industry
      • By Distribution Channel
    • Key Takeaways
  16. Eastern Europe Market Analysis 2020 to 2024 and Forecast 2025 to 2035, By Country
    • Historical Market Size Value (USD Billion) & Volume (KT) Trend Analysis By Market Taxonomy, 2020 to 2024
    • Market Size Value (USD Billion) & Volume (KT) Forecast By Market Taxonomy, 2025 to 2035
      • By Country
        • Russia
        • Hungary
        • Poland
        • Balkan & Baltics
        • Rest of E. Europe
      • By Material Type
      • By Basis Weight
      • By Finish Type
      • By Application
      • By End-Use Industry
      • By Distribution Channel
    • Market Attractiveness Analysis
      • By Country
      • By Material Type
      • By Basis Weight
      • By Finish Type
      • By Application
      • By End-Use Industry
      • By Distribution Channel
    • Key Takeaways
  17. East Asia Market Analysis 2020 to 2024 and Forecast 2025 to 2035, By Country
    • Historical Market Size Value (USD Billion) & Volume (KT) Trend Analysis By Market Taxonomy, 2020 to 2024
    • Market Size Value (USD Billion) & Volume (KT) Forecast By Market Taxonomy, 2025 to 2035
      • By Country
        • China
        • Japan
        • South Korea
      • By Material Type
      • By Basis Weight
      • By Finish Type
      • By Application
      • By End-Use Industry
      • By Distribution Channel
    • Market Attractiveness Analysis
      • By Country
      • By Material Type
      • By Basis Weight
      • By Finish Type
      • By Application
      • By End-Use Industry
      • By Distribution Channel
    • Key Takeaways
  18. South Asia & Pacific Market Analysis 2020 to 2024 and Forecast 2025 to 2035, By Country
    • Historical Market Size Value (USD Billion) & Volume (KT) Trend Analysis By Market Taxonomy, 2020 to 2024
    • Market Size Value (USD Billion) & Volume (KT) Forecast By Market Taxonomy, 2025 to 2035
      • By Country
        • India
        • Australia & New Zealand
        • ASEAN
        • Rest of SAP
      • By Material Type
      • By Basis Weight
      • By Finish Type
      • By Application
      • By End-Use Industry
      • By Distribution Channel
    • Market Attractiveness Analysis
      • By Country
      • By Material Type
      • By Basis Weight
      • By Finish Type
      • By Application
      • By End-Use Industry
      • By Distribution Channel
    • Key Takeaways
  19. Middle East and Africa Market Analysis 2020 to 2024 and Forecast 2025 to 2035, By Country
    • Historical Market Size Value (USD Billion) & Volume (KT) Trend Analysis By Market Taxonomy, 2020 to 2024
    • Market Size Value (USD Billion) & Volume (KT) Forecast By Market Taxonomy, 2025 to 2035
      • By Country
        • GCC Countries
        • Northern Africa
        • South Africa
        • Turkiye
        • Rest of MEA
      • By Material Type
      • By Basis Weight
      • By Finish Type
      • By Application
      • By End-Use Industry
      • By Distribution Channel
    • Market Attractiveness Analysis
      • By Country
      • By Material Type
      • By Basis Weight
      • By Finish Type
      • By Application
      • By End-Use Industry
      • By Distribution Channel
    • Key Takeaways
  20. Key Countries Market Analysis
    • USA
      • Pricing Analysis
      • Market Share Analysis, 2024
        • By Material Type
        • By Basis Weight
        • By Finish Type
        • By Application
        • By End-Use Industry
        • By Distribution Channel
    • Canada
      • Pricing Analysis
      • Market Share Analysis, 2024
        • By Material Type
        • By Basis Weight
        • By Finish Type
        • By Application
        • By End-Use Industry
        • By Distribution Channel
    • Brazil
      • Pricing Analysis
      • Market Share Analysis, 2024
        • By Material Type
        • By Basis Weight
        • By Finish Type
        • By Application
        • By End-Use Industry
        • By Distribution Channel
    • Mexico
      • Pricing Analysis
      • Market Share Analysis, 2024
        • By Material Type
        • By Basis Weight
        • By Finish Type
        • By Application
        • By End-Use Industry
        • By Distribution Channel
    • Argentina
      • Pricing Analysis
      • Market Share Analysis, 2024
        • By Material Type
        • By Basis Weight
        • By Finish Type
        • By Application
        • By End-Use Industry
        • By Distribution Channel
  21. Market Structure Analysis
    • Competition Dashboard
    • Competition Benchmarking
    • Market Share Analysis of Top Players
      • By Regional
      • By Material Type
      • By Basis Weight
      • By Finish Type
      • By Application
      • By End-Use Industry
      • By Distribution Channel
  22. Competition Analysis
    • Competition Deep Dive
      • Cheever Specialty Paper & Film
        • Overview
        • Product Portfolio
        • Profitability by Market Segments (Product/Age /Sales Channel/Region)
        • Sales Footprint
        • Strategy Overview
          • Marketing Strategy
          • Product Strategy
          • Channel Strategy
      • UPM-Kymmene Corporation
        • Overview
        • Product Portfolio
        • Profitability by Market Segments (Product/Age /Sales Channel/Region)
        • Sales Footprint
        • Strategy Overview
          • Marketing Strategy
          • Product Strategy
          • Channel Strategy
      • Taiko Paper MFG. LTD
        • Overview
        • Product Portfolio
        • Profitability by Market Segments (Product/Age /Sales Channel/Region)
        • Sales Footprint
        • Strategy Overview
          • Marketing Strategy
          • Product Strategy
          • Channel Strategy
      • Pixelle Specialty Solutions
        • Overview
        • Product Portfolio
        • Profitability by Market Segments (Product/Age /Sales Channel/Region)
        • Sales Footprint
        • Strategy Overview
          • Marketing Strategy
          • Product Strategy
          • Channel Strategy
      • NorCell Paper
        • Overview
        • Product Portfolio
        • Profitability by Market Segments (Product/Age /Sales Channel/Region)
        • Sales Footprint
        • Strategy Overview
          • Marketing Strategy
          • Product Strategy
          • Channel Strategy
      • Laufenberg GmbH
        • Overview
        • Product Portfolio
        • Profitability by Market Segments (Product/Age /Sales Channel/Region)
        • Sales Footprint
        • Strategy Overview
          • Marketing Strategy
          • Product Strategy
          • Channel Strategy
      • Synergy International
        • Overview
        • Product Portfolio
        • Profitability by Market Segments (Product/Age /Sales Channel/Region)
        • Sales Footprint
        • Strategy Overview
          • Marketing Strategy
          • Product Strategy
          • Channel Strategy
      • Kruger Specialty Papers
        • Overview
        • Product Portfolio
        • Profitability by Market Segments (Product/Age /Sales Channel/Region)
        • Sales Footprint
        • Strategy Overview
          • Marketing Strategy
          • Product Strategy
          • Channel Strategy
      • Cotek Papers
        • Overview
        • Product Portfolio
        • Profitability by Market Segments (Product/Age /Sales Channel/Region)
        • Sales Footprint
        • Strategy Overview
          • Marketing Strategy
          • Product Strategy
          • Channel Strategy
      • Verso
        • Overview
        • Product Portfolio
        • Profitability by Market Segments (Product/Age /Sales Channel/Region)
        • Sales Footprint
        • Strategy Overview
          • Marketing Strategy
          • Product Strategy
          • Channel Strategy
  23. Assumptions & Acronyms Used
  24. Research Methodology

List of Tables

  • Table 1: Global Market Value (USD Billion) Forecast by Region, 2020 to 2035
  • Table 2: Global Market Volume (KT) Forecast by Region, 2020 to 2035
  • Table 3: Global Market Value (USD Billion) Forecast by Material Type, 2020 to 2035
  • Table 4: Global Market Volume (KT) Forecast by Material Type, 2020 to 2035
  • Table 5: Global Market Value (USD Billion) Forecast by Basis Weight, 2020 to 2035
  • Table 6: Global Market Volume (KT) Forecast by Basis Weight, 2020 to 2035
  • Table 7: Global Market Value (USD Billion) Forecast by Finish Type, 2020 to 2035
  • Table 8: Global Market Volume (KT) Forecast by Finish Type, 2020 to 2035
  • Table 9: Global Market Value (USD Billion) Forecast by Application, 2020 to 2035
  • Table 10: Global Market Volume (KT) Forecast by Application, 2020 to 2035
  • Table 11: Global Market Value (USD Billion) Forecast by End-Use Industry, 2020 to 2035
  • Table 12: Global Market Volume (KT) Forecast by End-Use Industry, 2020 to 2035
  • Table 13: Global Market Value (USD Billion) Forecast by Distribution Channel, 2020 to 2035
  • Table 14: Global Market Volume (KT) Forecast by Distribution Channel, 2020 to 2035
  • Table 15: North America Market Value (USD Billion) Forecast by Country, 2020 to 2035
  • Table 16: North America Market Volume (KT) Forecast by Country, 2020 to 2035
  • Table 17: North America Market Value (USD Billion) Forecast by Material Type, 2020 to 2035
  • Table 18: North America Market Volume (KT) Forecast by Material Type, 2020 to 2035
  • Table 19: North America Market Value (USD Billion) Forecast by Basis Weight, 2020 to 2035
  • Table 20: North America Market Volume (KT) Forecast by Basis Weight, 2020 to 2035
  • Table 21: North America Market Value (USD Billion) Forecast by Finish Type, 2020 to 2035
  • Table 22: North America Market Volume (KT) Forecast by Finish Type, 2020 to 2035
  • Table 23: North America Market Value (USD Billion) Forecast by Application, 2020 to 2035
  • Table 24: North America Market Volume (KT) Forecast by Application, 2020 to 2035
  • Table 25: North America Market Value (USD Billion) Forecast by End-Use Industry, 2020 to 2035
  • Table 26: North America Market Volume (KT) Forecast by End-Use Industry, 2020 to 2035
  • Table 27: North America Market Value (USD Billion) Forecast by Distribution Channel, 2020 to 2035
  • Table 28: North America Market Volume (KT) Forecast by Distribution Channel, 2020 to 2035
  • Table 29: Latin America Market Value (USD Billion) Forecast by Country, 2020 to 2035
  • Table 30: Latin America Market Volume (KT) Forecast by Country, 2020 to 2035
  • Table 31: Latin America Market Value (USD Billion) Forecast by Material Type, 2020 to 2035
  • Table 32: Latin America Market Volume (KT) Forecast by Material Type, 2020 to 2035
  • Table 33: Latin America Market Value (USD Billion) Forecast by Basis Weight, 2020 to 2035
  • Table 34: Latin America Market Volume (KT) Forecast by Basis Weight, 2020 to 2035
  • Table 35: Latin America Market Value (USD Billion) Forecast by Finish Type, 2020 to 2035
  • Table 36: Latin America Market Volume (KT) Forecast by Finish Type, 2020 to 2035
  • Table 37: Latin America Market Value (USD Billion) Forecast by Application, 2020 to 2035
  • Table 38: Latin America Market Volume (KT) Forecast by Application, 2020 to 2035
  • Table 39: Latin America Market Value (USD Billion) Forecast by End-Use Industry, 2020 to 2035
  • Table 40: Latin America Market Volume (KT) Forecast by End-Use Industry, 2020 to 2035
  • Table 41: Latin America Market Value (USD Billion) Forecast by Distribution Channel, 2020 to 2035
  • Table 42: Latin America Market Volume (KT) Forecast by Distribution Channel, 2020 to 2035
  • Table 43: Western Europe Market Value (USD Billion) Forecast by Country, 2020 to 2035
  • Table 44: Western Europe Market Volume (KT) Forecast by Country, 2020 to 2035
  • Table 45: Western Europe Market Value (USD Billion) Forecast by Material Type, 2020 to 2035
  • Table 46: Western Europe Market Volume (KT) Forecast by Material Type, 2020 to 2035
  • Table 47: Western Europe Market Value (USD Billion) Forecast by Basis Weight, 2020 to 2035
  • Table 48: Western Europe Market Volume (KT) Forecast by Basis Weight, 2020 to 2035
  • Table 49: Western Europe Market Value (USD Billion) Forecast by Finish Type, 2020 to 2035
  • Table 50: Western Europe Market Volume (KT) Forecast by Finish Type, 2020 to 2035
  • Table 51: Western Europe Market Value (USD Billion) Forecast by Application, 2020 to 2035
  • Table 52: Western Europe Market Volume (KT) Forecast by Application, 2020 to 2035
  • Table 53: Western Europe Market Value (USD Billion) Forecast by End-Use Industry, 2020 to 2035
  • Table 54: Western Europe Market Volume (KT) Forecast by End-Use Industry, 2020 to 2035
  • Table 55: Western Europe Market Value (USD Billion) Forecast by Distribution Channel, 2020 to 2035
  • Table 56: Western Europe Market Volume (KT) Forecast by Distribution Channel, 2020 to 2035
  • Table 57: Eastern Europe Market Value (USD Billion) Forecast by Country, 2020 to 2035
  • Table 58: Eastern Europe Market Volume (KT) Forecast by Country, 2020 to 2035
  • Table 59: Eastern Europe Market Value (USD Billion) Forecast by Material Type, 2020 to 2035
  • Table 60: Eastern Europe Market Volume (KT) Forecast by Material Type, 2020 to 2035
  • Table 61: Eastern Europe Market Value (USD Billion) Forecast by Basis Weight, 2020 to 2035
  • Table 62: Eastern Europe Market Volume (KT) Forecast by Basis Weight, 2020 to 2035
  • Table 63: Eastern Europe Market Value (USD Billion) Forecast by Finish Type, 2020 to 2035
  • Table 64: Eastern Europe Market Volume (KT) Forecast by Finish Type, 2020 to 2035
  • Table 65: Eastern Europe Market Value (USD Billion) Forecast by Application, 2020 to 2035
  • Table 66: Eastern Europe Market Volume (KT) Forecast by Application, 2020 to 2035
  • Table 67: Eastern Europe Market Value (USD Billion) Forecast by End-Use Industry, 2020 to 2035
  • Table 68: Eastern Europe Market Volume (KT) Forecast by End-Use Industry, 2020 to 2035
  • Table 69: Eastern Europe Market Value (USD Billion) Forecast by Distribution Channel, 2020 to 2035
  • Table 70: Eastern Europe Market Volume (KT) Forecast by Distribution Channel, 2020 to 2035
  • Table 71: East Asia Market Value (USD Billion) Forecast by Country, 2020 to 2035
  • Table 72: East Asia Market Volume (KT) Forecast by Country, 2020 to 2035
  • Table 73: East Asia Market Value (USD Billion) Forecast by Material Type, 2020 to 2035
  • Table 74: East Asia Market Volume (KT) Forecast by Material Type, 2020 to 2035
  • Table 75: East Asia Market Value (USD Billion) Forecast by Basis Weight, 2020 to 2035
  • Table 76: East Asia Market Volume (KT) Forecast by Basis Weight, 2020 to 2035
  • Table 77: East Asia Market Value (USD Billion) Forecast by Finish Type, 2020 to 2035
  • Table 78: East Asia Market Volume (KT) Forecast by Finish Type, 2020 to 2035
  • Table 79: East Asia Market Value (USD Billion) Forecast by Application, 2020 to 2035
  • Table 80: East Asia Market Volume (KT) Forecast by Application, 2020 to 2035
  • Table 81: East Asia Market Value (USD Billion) Forecast by End-Use Industry, 2020 to 2035
  • Table 82: East Asia Market Volume (KT) Forecast by End-Use Industry, 2020 to 2035
  • Table 83: East Asia Market Value (USD Billion) Forecast by Distribution Channel, 2020 to 2035
  • Table 84: East Asia Market Volume (KT) Forecast by Distribution Channel, 2020 to 2035
  • Table 85: South Asia & Pacific Market Value (USD Billion) Forecast by Country, 2020 to 2035
  • Table 86: South Asia & Pacific Market Volume (KT) Forecast by Country, 2020 to 2035
  • Table 87: South Asia & Pacific Market Value (USD Billion) Forecast by Material Type, 2020 to 2035
  • Table 88: South Asia & Pacific Market Volume (KT) Forecast by Material Type, 2020 to 2035
  • Table 89: South Asia & Pacific Market Value (USD Billion) Forecast by Basis Weight, 2020 to 2035
  • Table 90: South Asia & Pacific Market Volume (KT) Forecast by Basis Weight, 2020 to 2035
  • Table 91: South Asia & Pacific Market Value (USD Billion) Forecast by Finish Type, 2020 to 2035
  • Table 92: South Asia & Pacific Market Volume (KT) Forecast by Finish Type, 2020 to 2035
  • Table 93: South Asia & Pacific Market Value (USD Billion) Forecast by Application, 2020 to 2035
  • Table 94: South Asia & Pacific Market Volume (KT) Forecast by Application, 2020 to 2035
  • Table 95: South Asia & Pacific Market Value (USD Billion) Forecast by End-Use Industry, 2020 to 2035
  • Table 96: South Asia & Pacific Market Volume (KT) Forecast by End-Use Industry, 2020 to 2035
  • Table 97: South Asia & Pacific Market Value (USD Billion) Forecast by Distribution Channel, 2020 to 2035
  • Table 98: South Asia & Pacific Market Volume (KT) Forecast by Distribution Channel, 2020 to 2035
  • Table 99: Middle East and Africa Market Value (USD Billion) Forecast by Country, 2020 to 2035
  • Table 100: Middle East and Africa Market Volume (KT) Forecast by Country, 2020 to 2035
  • Table 101: Middle East and Africa Market Value (USD Billion) Forecast by Material Type, 2020 to 2035
  • Table 102: Middle East and Africa Market Volume (KT) Forecast by Material Type, 2020 to 2035
  • Table 103: Middle East and Africa Market Value (USD Billion) Forecast by Basis Weight, 2020 to 2035
  • Table 104: Middle East and Africa Market Volume (KT) Forecast by Basis Weight, 2020 to 2035
  • Table 105: Middle East and Africa Market Value (USD Billion) Forecast by Finish Type, 2020 to 2035
  • Table 106: Middle East and Africa Market Volume (KT) Forecast by Finish Type, 2020 to 2035
  • Table 107: Middle East and Africa Market Value (USD Billion) Forecast by Application, 2020 to 2035
  • Table 108: Middle East and Africa Market Volume (KT) Forecast by Application, 2020 to 2035
  • Table 109: Middle East and Africa Market Value (USD Billion) Forecast by End-Use Industry, 2020 to 2035
  • Table 110: Middle East and Africa Market Volume (KT) Forecast by End-Use Industry, 2020 to 2035
  • Table 111: Middle East and Africa Market Value (USD Billion) Forecast by Distribution Channel, 2020 to 2035
  • Table 112: Middle East and Africa Market Volume (KT) Forecast by Distribution Channel, 2020 to 2035

List of Figures

  • Figure 1: Global Market Volume (KT) Forecast 2020 to 2035
  • Figure 2: Global Market Pricing Analysis
  • Figure 3: Global Market Value (USD Billion) Forecast 2020 to 2035
  • Figure 4: Global Market Value Share and BPS Analysis by Material Type, 2025 and 2035
  • Figure 5: Global Market Y-o-Y Growth Comparison by Material Type, 2025 to 2035
  • Figure 6: Global Market Attractiveness Analysis by Material Type
  • Figure 7: Global Market Value Share and BPS Analysis by Basis Weight, 2025 and 2035
  • Figure 8: Global Market Y-o-Y Growth Comparison by Basis Weight, 2025 to 2035
  • Figure 9: Global Market Attractiveness Analysis by Basis Weight
  • Figure 10: Global Market Value Share and BPS Analysis by Finish Type, 2025 and 2035
  • Figure 11: Global Market Y-o-Y Growth Comparison by Finish Type, 2025 to 2035
  • Figure 12: Global Market Attractiveness Analysis by Finish Type
  • Figure 13: Global Market Value Share and BPS Analysis by Application, 2025 and 2035
  • Figure 14: Global Market Y-o-Y Growth Comparison by Application, 2025 to 2035
  • Figure 15: Global Market Attractiveness Analysis by Application
  • Figure 16: Global Market Value Share and BPS Analysis by End-Use Industry, 2025 and 2035
  • Figure 17: Global Market Y-o-Y Growth Comparison by End-Use Industry, 2025 to 2035
  • Figure 18: Global Market Attractiveness Analysis by End-Use Industry
  • Figure 19: Global Market Value Share and BPS Analysis by Distribution Channel, 2025 and 2035
  • Figure 20: Global Market Y-o-Y Growth Comparison by Distribution Channel, 2025 to 2035
  • Figure 21: Global Market Attractiveness Analysis by Distribution Channel
  • Figure 22: Global Market Value (USD Billion) Share and BPS Analysis by Region, 2025 and 2035
  • Figure 23: Global Market Y-o-Y Growth Comparison by Region, 2025 to 2035
  • Figure 24: Global Market Attractiveness Analysis by Region
  • Figure 25: North America Market Incremental $ Opportunity, 2025 to 2035
  • Figure 26: Latin America Market Incremental $ Opportunity, 2025 to 2035
  • Figure 27: Western Europe Market Incremental $ Opportunity, 2025 to 2035
  • Figure 28: Eastern Europe Market Incremental $ Opportunity, 2025 to 2035
  • Figure 29: East Asia Market Incremental $ Opportunity, 2025 to 2035
  • Figure 30: South Asia & Pacific Market Incremental $ Opportunity, 2025 to 2035
  • Figure 31: Middle East and Africa Market Incremental $ Opportunity, 2025 to 2035
  • Figure 32: North America Market Value Share and BPS Analysis by Country, 2025 and 2035
  • Figure 33: North America Market Value Share and BPS Analysis by Material Type, 2025 and 2035
  • Figure 34: North America Market Y-o-Y Growth Comparison by Material Type, 2025 to 2035
  • Figure 35: North America Market Attractiveness Analysis by Material Type
  • Figure 36: North America Market Value Share and BPS Analysis by Basis Weight, 2025 and 2035
  • Figure 37: North America Market Y-o-Y Growth Comparison by Basis Weight, 2025 to 2035
  • Figure 38: North America Market Attractiveness Analysis by Basis Weight
  • Figure 39: North America Market Value Share and BPS Analysis by Finish Type, 2025 and 2035
  • Figure 40: North America Market Y-o-Y Growth Comparison by Finish Type, 2025 to 2035
  • Figure 41: North America Market Attractiveness Analysis by Finish Type
  • Figure 42: North America Market Value Share and BPS Analysis by Application, 2025 and 2035
  • Figure 43: North America Market Y-o-Y Growth Comparison by Application, 2025 to 2035
  • Figure 44: North America Market Attractiveness Analysis by Application
  • Figure 45: North America Market Value Share and BPS Analysis by End-Use Industry, 2025 and 2035
  • Figure 46: North America Market Y-o-Y Growth Comparison by End-Use Industry, 2025 to 2035
  • Figure 47: North America Market Attractiveness Analysis by End-Use Industry
  • Figure 48: North America Market Value Share and BPS Analysis by Distribution Channel, 2025 and 2035
  • Figure 49: North America Market Y-o-Y Growth Comparison by Distribution Channel, 2025 to 2035
  • Figure 50: North America Market Attractiveness Analysis by Distribution Channel
  • Figure 51: Latin America Market Value Share and BPS Analysis by Country, 2025 and 2035
  • Figure 52: Latin America Market Value Share and BPS Analysis by Material Type, 2025 and 2035
  • Figure 53: Latin America Market Y-o-Y Growth Comparison by Material Type, 2025 to 2035
  • Figure 54: Latin America Market Attractiveness Analysis by Material Type
  • Figure 55: Latin America Market Value Share and BPS Analysis by Basis Weight, 2025 and 2035
  • Figure 56: Latin America Market Y-o-Y Growth Comparison by Basis Weight, 2025 to 2035
  • Figure 57: Latin America Market Attractiveness Analysis by Basis Weight
  • Figure 58: Latin America Market Value Share and BPS Analysis by Finish Type, 2025 and 2035
  • Figure 59: Latin America Market Y-o-Y Growth Comparison by Finish Type, 2025 to 2035
  • Figure 60: Latin America Market Attractiveness Analysis by Finish Type
  • Figure 61: Latin America Market Value Share and BPS Analysis by Application, 2025 and 2035
  • Figure 62: Latin America Market Y-o-Y Growth Comparison by Application, 2025 to 2035
  • Figure 63: Latin America Market Attractiveness Analysis by Application
  • Figure 64: Latin America Market Value Share and BPS Analysis by End-Use Industry, 2025 and 2035
  • Figure 65: Latin America Market Y-o-Y Growth Comparison by End-Use Industry, 2025 to 2035
  • Figure 66: Latin America Market Attractiveness Analysis by End-Use Industry
  • Figure 67: Latin America Market Value Share and BPS Analysis by Distribution Channel, 2025 and 2035
  • Figure 68: Latin America Market Y-o-Y Growth Comparison by Distribution Channel, 2025 to 2035
  • Figure 69: Latin America Market Attractiveness Analysis by Distribution Channel
  • Figure 70: Western Europe Market Value Share and BPS Analysis by Country, 2025 and 2035
  • Figure 71: Western Europe Market Value Share and BPS Analysis by Material Type, 2025 and 2035
  • Figure 72: Western Europe Market Y-o-Y Growth Comparison by Material Type, 2025 to 2035
  • Figure 73: Western Europe Market Attractiveness Analysis by Material Type
  • Figure 74: Western Europe Market Value Share and BPS Analysis by Basis Weight, 2025 and 2035
  • Figure 75: Western Europe Market Y-o-Y Growth Comparison by Basis Weight, 2025 to 2035
  • Figure 76: Western Europe Market Attractiveness Analysis by Basis Weight
  • Figure 77: Western Europe Market Value Share and BPS Analysis by Finish Type, 2025 and 2035
  • Figure 78: Western Europe Market Y-o-Y Growth Comparison by Finish Type, 2025 to 2035
  • Figure 79: Western Europe Market Attractiveness Analysis by Finish Type
  • Figure 80: Western Europe Market Value Share and BPS Analysis by Application, 2025 and 2035
  • Figure 81: Western Europe Market Y-o-Y Growth Comparison by Application, 2025 to 2035
  • Figure 82: Western Europe Market Attractiveness Analysis by Application
  • Figure 83: Western Europe Market Value Share and BPS Analysis by End-Use Industry, 2025 and 2035
  • Figure 84: Western Europe Market Y-o-Y Growth Comparison by End-Use Industry, 2025 to 2035
  • Figure 85: Western Europe Market Attractiveness Analysis by End-Use Industry
  • Figure 86: Western Europe Market Value Share and BPS Analysis by Distribution Channel, 2025 and 2035
  • Figure 87: Western Europe Market Y-o-Y Growth Comparison by Distribution Channel, 2025 to 2035
  • Figure 88: Western Europe Market Attractiveness Analysis by Distribution Channel
  • Figure 89: Eastern Europe Market Value Share and BPS Analysis by Country, 2025 and 2035
  • Figure 90: Eastern Europe Market Value Share and BPS Analysis by Material Type, 2025 and 2035
  • Figure 91: Eastern Europe Market Y-o-Y Growth Comparison by Material Type, 2025 to 2035
  • Figure 92: Eastern Europe Market Attractiveness Analysis by Material Type
  • Figure 93: Eastern Europe Market Value Share and BPS Analysis by Basis Weight, 2025 and 2035
  • Figure 94: Eastern Europe Market Y-o-Y Growth Comparison by Basis Weight, 2025 to 2035
  • Figure 95: Eastern Europe Market Attractiveness Analysis by Basis Weight
  • Figure 96: Eastern Europe Market Value Share and BPS Analysis by Finish Type, 2025 and 2035
  • Figure 97: Eastern Europe Market Y-o-Y Growth Comparison by Finish Type, 2025 to 2035
  • Figure 98: Eastern Europe Market Attractiveness Analysis by Finish Type
  • Figure 99: Eastern Europe Market Value Share and BPS Analysis by Application, 2025 and 2035
  • Figure 100: Eastern Europe Market Y-o-Y Growth Comparison by Application, 2025 to 2035
  • Figure 101: Eastern Europe Market Attractiveness Analysis by Application
  • Figure 102: Eastern Europe Market Value Share and BPS Analysis by End-Use Industry, 2025 and 2035
  • Figure 103: Eastern Europe Market Y-o-Y Growth Comparison by End-Use Industry, 2025 to 2035
  • Figure 104: Eastern Europe Market Attractiveness Analysis by End-Use Industry
  • Figure 105: Eastern Europe Market Value Share and BPS Analysis by Distribution Channel, 2025 and 2035
  • Figure 106: Eastern Europe Market Y-o-Y Growth Comparison by Distribution Channel, 2025 to 2035
  • Figure 107: Eastern Europe Market Attractiveness Analysis by Distribution Channel
  • Figure 108: East Asia Market Value Share and BPS Analysis by Country, 2025 and 2035
  • Figure 109: East Asia Market Value Share and BPS Analysis by Material Type, 2025 and 2035
  • Figure 110: East Asia Market Y-o-Y Growth Comparison by Material Type, 2025 to 2035
  • Figure 111: East Asia Market Attractiveness Analysis by Material Type
  • Figure 112: East Asia Market Value Share and BPS Analysis by Basis Weight, 2025 and 2035
  • Figure 113: East Asia Market Y-o-Y Growth Comparison by Basis Weight, 2025 to 2035
  • Figure 114: East Asia Market Attractiveness Analysis by Basis Weight
  • Figure 115: East Asia Market Value Share and BPS Analysis by Finish Type, 2025 and 2035
  • Figure 116: East Asia Market Y-o-Y Growth Comparison by Finish Type, 2025 to 2035
  • Figure 117: East Asia Market Attractiveness Analysis by Finish Type
  • Figure 118: East Asia Market Value Share and BPS Analysis by Application, 2025 and 2035
  • Figure 119: East Asia Market Y-o-Y Growth Comparison by Application, 2025 to 2035
  • Figure 120: East Asia Market Attractiveness Analysis by Application
  • Figure 121: East Asia Market Value Share and BPS Analysis by End-Use Industry, 2025 and 2035
  • Figure 122: East Asia Market Y-o-Y Growth Comparison by End-Use Industry, 2025 to 2035
  • Figure 123: East Asia Market Attractiveness Analysis by End-Use Industry
  • Figure 124: East Asia Market Value Share and BPS Analysis by Distribution Channel, 2025 and 2035
  • Figure 125: East Asia Market Y-o-Y Growth Comparison by Distribution Channel, 2025 to 2035
  • Figure 126: East Asia Market Attractiveness Analysis by Distribution Channel
  • Figure 127: South Asia & Pacific Market Value Share and BPS Analysis by Country, 2025 and 2035
  • Figure 128: South Asia & Pacific Market Value Share and BPS Analysis by Material Type, 2025 and 2035
  • Figure 129: South Asia & Pacific Market Y-o-Y Growth Comparison by Material Type, 2025 to 2035
  • Figure 130: South Asia & Pacific Market Attractiveness Analysis by Material Type
  • Figure 131: South Asia & Pacific Market Value Share and BPS Analysis by Basis Weight, 2025 and 2035
  • Figure 132: South Asia & Pacific Market Y-o-Y Growth Comparison by Basis Weight, 2025 to 2035
  • Figure 133: South Asia & Pacific Market Attractiveness Analysis by Basis Weight
  • Figure 134: South Asia & Pacific Market Value Share and BPS Analysis by Finish Type, 2025 and 2035
  • Figure 135: South Asia & Pacific Market Y-o-Y Growth Comparison by Finish Type, 2025 to 2035
  • Figure 136: South Asia & Pacific Market Attractiveness Analysis by Finish Type
  • Figure 137: South Asia & Pacific Market Value Share and BPS Analysis by Application, 2025 and 2035
  • Figure 138: South Asia & Pacific Market Y-o-Y Growth Comparison by Application, 2025 to 2035
  • Figure 139: South Asia & Pacific Market Attractiveness Analysis by Application
  • Figure 140: South Asia & Pacific Market Value Share and BPS Analysis by End-Use Industry, 2025 and 2035
  • Figure 141: South Asia & Pacific Market Y-o-Y Growth Comparison by End-Use Industry, 2025 to 2035
  • Figure 142: South Asia & Pacific Market Attractiveness Analysis by End-Use Industry
  • Figure 143: South Asia & Pacific Market Value Share and BPS Analysis by Distribution Channel, 2025 and 2035
  • Figure 144: South Asia & Pacific Market Y-o-Y Growth Comparison by Distribution Channel, 2025 to 2035
  • Figure 145: South Asia & Pacific Market Attractiveness Analysis by Distribution Channel
  • Figure 146: Middle East and Africa Market Value Share and BPS Analysis by Country, 2025 and 2035
  • Figure 147: Middle East and Africa Market Value Share and BPS Analysis by Material Type, 2025 and 2035
  • Figure 148: Middle East and Africa Market Y-o-Y Growth Comparison by Material Type, 2025 to 2035
  • Figure 149: Middle East and Africa Market Attractiveness Analysis by Material Type
  • Figure 150: Middle East and Africa Market Value Share and BPS Analysis by Basis Weight, 2025 and 2035
  • Figure 151: Middle East and Africa Market Y-o-Y Growth Comparison by Basis Weight, 2025 to 2035
  • Figure 152: Middle East and Africa Market Attractiveness Analysis by Basis Weight
  • Figure 153: Middle East and Africa Market Value Share and BPS Analysis by Finish Type, 2025 and 2035
  • Figure 154: Middle East and Africa Market Y-o-Y Growth Comparison by Finish Type, 2025 to 2035
  • Figure 155: Middle East and Africa Market Attractiveness Analysis by Finish Type
  • Figure 156: Middle East and Africa Market Value Share and BPS Analysis by Application, 2025 and 2035
  • Figure 157: Middle East and Africa Market Y-o-Y Growth Comparison by Application, 2025 to 2035
  • Figure 158: Middle East and Africa Market Attractiveness Analysis by Application
  • Figure 159: Middle East and Africa Market Value Share and BPS Analysis by End-Use Industry, 2025 and 2035
  • Figure 160: Middle East and Africa Market Y-o-Y Growth Comparison by End-Use Industry, 2025 to 2035
  • Figure 161: Middle East and Africa Market Attractiveness Analysis by End-Use Industry
  • Figure 162: Middle East and Africa Market Value Share and BPS Analysis by Distribution Channel, 2025 and 2035
  • Figure 163: Middle East and Africa Market Y-o-Y Growth Comparison by Distribution Channel, 2025 to 2035
  • Figure 164: Middle East and Africa Market Attractiveness Analysis by Distribution Channel
  • Figure 165: Global Market - Tier Structure Analysis
  • Figure 166: Global Market - Company Share Analysis

Frequently Asked Questions

What is the projected market size of the SCK paper industry in 2025 and 2035?

The industry size is projected to be USD 2.3 billion in 2025 and USD 3.4 billion by 2035.

What is the expected CAGR for the SCK Paper industry from 2025 to 2035?

The expected CAGR is 4.0% from 2025 to 2035.

Which GSM segment dominates the SCK Paper industry in 2025?

The 40-60 GSM segment dominates the industry with a 62% share in 2025.

Who is the leading company in the SCK Paper industry?

UPM-Kymmene Corporation is the leading company with 18 % Industry share.

What is the projected CAGR of the SCK Paper Industry in India?

India is projected to grow at a CAGR of 3.9% from 2025 to 2035.

Explore Similar Insights

Future Market Insights

SCK Paper Market