Self-sampling HPV Test Kits Market Size and Share Forecast Outlook 2025 to 2035

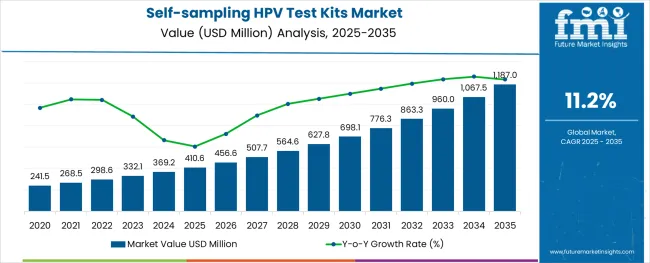
The self-sampling HPV test kits market is anticipated to rise from USD 410.6 million in 2025 to USD 1,187.0 million by 2035, growing at a robust CAGR of 11.2%.
Quick Stats in Self-Sampling HPV Test Kits Market

  • Self-Sampling HPV Test Kits Market Size (2025): USD 410.6 million
  • Projected Self-Sampling HPV Test Kits Market (2035): USD 1,187.0 million
  • Forecast CAGR of Self-Sampling HPV Test Kits Market (2025 to 2035): 11.2%
  • Leading Segment by Test Kits of Self-Sampling HPV Test Kits Market (2025): Vaginal Swab-Based Kits (49%
  • Fastest Growing Country in Self-Sampling HPV Test Kits Market (2025): India (13.9% CAGR)
  • Top Key Players in Self-Sampling HPV Test Kits Market: Roche Diagnostics, Becton, Dickinson and Company, Everlywell, Quest International, LifeCell International

Self Sampling Hpv Test Kits Market Market Value Analysis

Metric Value
Industry Size (2025E) USD 410.6 million
Industry Value (2035F) USD 1,187.0 million
CAGR (2025 to 2035) 11.2%

This sharp growth reflects a global shift toward early cervical cancer detection and greater emphasis on women’s preventive healthcare.

By 2025, nearly 28% of HPV testing in high-income countries is expected to be conducted via self-collection kits. Adoption is particularly strong in countries with national screening mandates, such as Australia and the UK, where pilot programs have demonstrated improved participation rates among under-screened populations. Digital health integration and mail-in testing models are further enabling access in rural and underserved regions.

Between 2026 and 2035, the market is poised for rapid expansion across Latin America, India, and Southeast Asia as public health programs shift toward scalable, decentralized screening strategies. The challenges such as cost reimbursement, cultural barriers, and test accuracy concerns in low-resource settings may restrict uptake. Continued WHO backing and evidence from implementation trials will be critical for broader adoption.

The self-sampling HPV test kits market is playing an increasingly important role across multiple healthcare sectors. In the global cervical cancer screening market, valued at over USD 10 billion, these kits make up 6-8% due to their convenience and patient-led sample collection.

Within the USD 20 billion at-home diagnostics industry, around 4-5% is contributed by self-collection HPV tests, reflecting rising consumer trust in remote health solutions. In women’s health diagnostics, a segment worth more than USD 30 billion, nearly 3-4% is attributed to these kits, driven by early detection efforts.

Personalized healthcare, currently valued at USD 150 billion, allocates 1-2% to self-screening tools. Even public health programs are directing 5-7% of HPV prevention efforts toward self-sampling initiatives for wider outreach.

Analyzing Self-sampling HPV Test Kits Market by Top Investment Segments

The self-sampling HPV test kits market is witnessing strong traction across vaginal swab-based kits, cervical cancer screening applications, and hospital distribution channels. Growth is supported by rising focus on early detection, patient convenience, and public health initiatives.
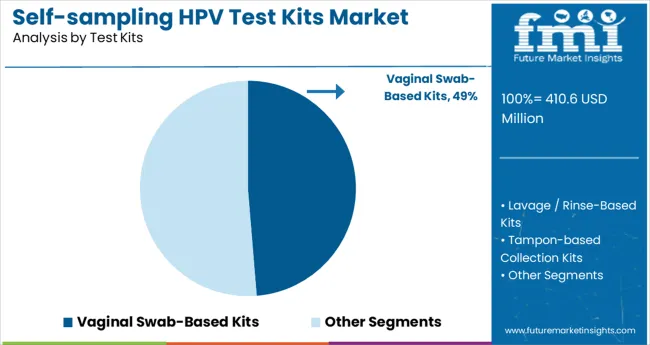
Vaginal Swab-Based Kits Lead Test Kit Preferences at 49%

Self Sampling Hpv Test Kits Market Analysis By Test Kits

Vaginal swab-based kits are projected to capture 49% share of the market by 2025. Their ease of use, privacy benefits, and accuracy make them the preferred option for home-based HPV testing. Rising awareness around cervical health and early screening has pushed adoption across both developed and emerging nations.

  • Women favor swab kits due to non-invasive and hygienic design.
  • Government campaigns in Europe and Asia are actively promoting at-home sampling.
  • Regulatory approvals and expanded distribution are accelerating market penetration.

Cervical Cancer Screening Dominates Application Segment with 88.0% Share

Cervical cancer screening accounts for a dominant 88.0% of the application segment. Self-sampling kits play a critical role in increasing screening coverage, especially in underserved or rural populations. These kits help overcome social stigma and logistical challenges tied to traditional testing.
  • Public health bodies are integrating self-tests into national screening programs.
  • NGOs and global health organizations are distributing free kits in high-risk regions.
  • Studies confirm comparable sensitivity to clinician-collected samples, boosting confidence in widespread adoption.

Hospitals Hold a 30% Share in Sales Channel Preference

Self Sampling Hpv Test Kits Market Analysis By Sales Channel

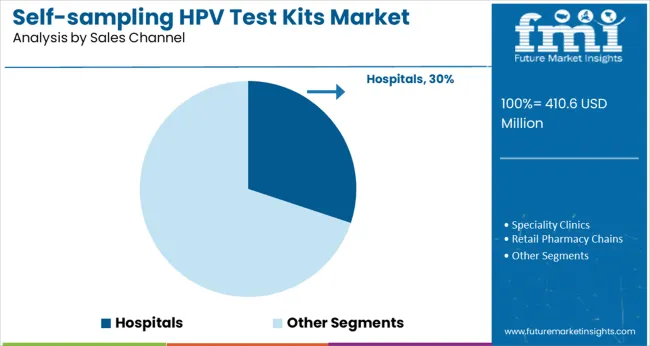
Hospitals account for 30% of the sales channel in 2025, driven by integrated diagnostics and physician recommendation. Patients who visit hospitals for general checkups are more likely to purchase or receive test kits on-site.

  • Hospital pharmacies are bundling HPV kits with wellness and gynecological services.
  • Growing doctor-patient awareness improves compliance and follow-up testing.
  • Healthcare systems in North America and Europe support distribution through public hospitals.

Top Self-sampling HPV Test Kits Market Dynamics

The global market is gaining traction due to higher screening uptake among under-screened populations, growing telehealth integration, and validated clinical equivalence with clinician-collected samples. Demand is shifting toward mail-in kits with high DNA yield and compatibility with PCR platforms, accelerating early detection in decentralized healthcare systems.

Screening Uptake Expands Through Mail-Based Distribution

Self-sampling HPV kit distribution through national screening programs rose 46% YoY, especially in low-screening regions across North America and Europe. Return compliance reached 68% when prepaid mailers and SMS follow-ups were used. Programs deploying dry flocked swab kits saw a 33% improvement in DNA stability after 10 days in transit.

Labs reported 96% concordance with clinician-collected samples, enabling regulatory endorsement for population-level use. Urban centers using opt-in digital enrollment boosted participation among women aged 30-49 by 41%. These logistics-driven efficiencies have positioned mail-based HPV self-tests as core tools for eliminating screening disparities in underserved and hard-to-reach groups.

PCR-Compatible Kits Drive Lab Integration and Accuracy

Demand for PCR-compatible self-sampling HPV kits rose 38% in 2025 as reference labs standardized workflows for high-throughput genotyping. Kits using wet media preserved DNA integrity above 95% across a 7-day window, enabling batch processing without re-extraction. Automated liquid handlers processed up to 1,200 self-collected samples/day, reducing turnaround time by 27%.

Labs reported genotype detection sensitivity above 98% for HPV-16 and HPV-18 using validated self-collected specimens. Integration with e-referral platforms cut administrative load by 22% per case. These metrics are accelerating insurer and public health adoption of PCR-grade kits for longitudinal screening programs, especially in Asia-Pacific and Northern Europe.
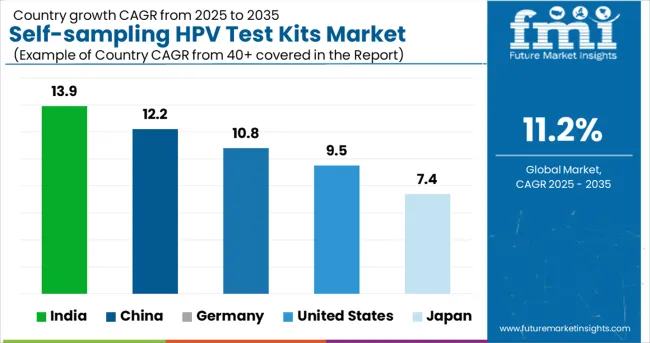
Top Countries Innovating, Producing, Validating, and Scaling Self-sampling HPV Test Kits

Self Sampling Hpv Test Kits Market Cagr Analysis By Country

Countries CAGR (2025 to 2035)
India 13.9%
China 12.2%
Germany 10.8%
United States 9.5%
Japan 7.4%

The global market is anticipated to grow at a CAGR of 11.2% between 2025 and 2035. India, a key BRICS nation, leads the pack with a projected CAGR of 13.9%, fueled by rising public health campaigns and increasing accessibility in tier-2 and tier-3 cities. China follows with 12.2%, supported by domestic manufacturing and broad adoption across urban clinics.

Both outperform the global average, underscoring the momentum in emerging markets. Germany, part of the OECD bloc, posts a slightly below-average CAGR of 10.8% as adoption aligns with regulatory integration and structured national screening programs. The USA trails at 9.5%, affected by slower regulatory approvals and existing preferences for clinician-led testing.

Japan reports the lowest CAGR at 7.4%, reflecting demographic constraints and slower cultural uptake. This growth disparity highlights contrasting healthcare infrastructure readiness and consumer acceptance across developed and developing economies.

The report provides insights across 40+ countries. The five below are highlighted for their strategic influence and growth trajectory.

Expansion of Self-sampling HPV Test Kits Market in India

India is expected to witness strong growth at a CAGR of 13.9% through 2035. Between 2020 and 2024, awareness and availability of HPV testing remained low, primarily confined to metros and pilot public health programs. Over the next decade, government-led cervical cancer screening drives and mobile health outreach are scaling access in Tier 2 and rural zones. Local manufacturers are rapidly introducing low-cost kits tailored for regional languages and home delivery.

  • Over 40% of cervical screening projected to shift to self-sampling by 2030
  • New partnerships emerging between diagnostics startups and public hospitals
  • Demand rising in Northeast and Central India due to NGO-driven outreach

Demand Outlook for Self-sampling HPV Test Kits Market in China

China is projected to grow at a CAGR of 12.2% from 2025 to 2035. From 2020 to 2024, uptake of self-sampling kits was modest, driven mainly by urban consumers in Shanghai and Beijing. Looking forward, policy emphasis on early detection, along with expanding e-commerce channels, is fostering adoption in suburban and peri-urban zones. Regulatory support is accelerating approval cycles for AI-integrated at-home testing platforms.

  • HPV self-test kits now cover over 150 cities across Tier 1 and Tier 2
  • Public-private projects targeting 70% screening rate in women by 2032
  • Domestic tech firms investing in app-linked test result integration

Market Development of Self-sampling HPV Test Kits in Germany

Germany is forecast to expand at a CAGR of 10.8% during the assessment period. Between 2020 and 2024, conventional physician-led screening dominated the HPV diagnostics landscape. The evolving consumer preferences, rising telemedicine consultations, and privacy-centric healthcare policies are catalyzing a shift toward self-sampling. Digital pharmacies and direct-to-consumer lab brands are also gaining traction.

  • Statutory health insurers increasingly reimbursing self-sampling options
  • Over 600,000 self-sampling units sold in 2024, up 4x since 2020
  • Home diagnostics firms reporting 40% YoY growth in female users

Growth Forecast for Self-sampling HPV Test Kits Market in the United States

The United States is estimated to grow at a CAGR of 9.5% from 2025 to 2035. During 2020 to 2024, adoption was primarily driven by COVID-era home testing trends and broader awareness of at-home diagnostics. Moving ahead, partnerships with women’s health platforms and integrations with employer health benefits are making self-testing more accessible. FDA-backed innovations and fast-track approvals are also supporting wider distribution.

  • 60% of OB-GYN clinics now recommend self-sampling for low-risk patients
  • Uptake highest among Hispanic and African-American demographics
  • Retail pharmacy chains expanding point-of-sale HPV test kits

Self-sampling HPV Test Kits Market Trends in Japan

Japan is projected to grow at a CAGR of 7.4% over the next decade. Between 2020 and 2024, cultural reservations and reliance on clinic-based gynecological visits limited market penetration. In contrast, 2025 to 2035 will benefit from changing generational attitudes, government-funded pilot projects, and integration of self-testing into workplace health programs.
  • Public health insurers are trialing reimbursements for postal kits
  • Tokyo and Osaka regions showing early adoption in working professionals
  • Local diagnostics brands launching user-friendly, minimal-contact designs

Leading Self-Sampling HPV Test Kits Suppliers

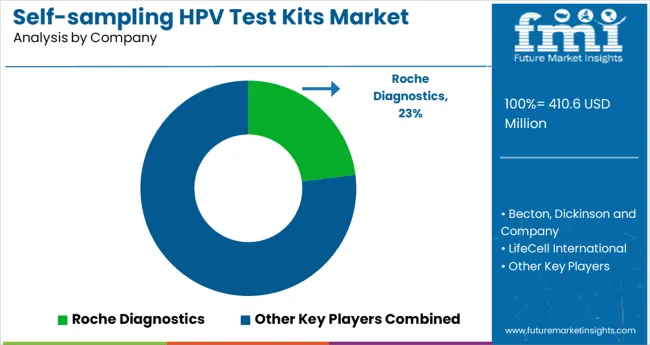
Self Sampling Hpv Test Kits Market Analysis By Company

The self-sampling HPV test kits market is led by Roche Diagnostics, which maintains a significant presence with its Cobas self-collection system approved in multiple major markets. Roche is estimated to hold a 20-25% share of the global self-sampling segment, supported by its strong clinical validation and integration with established laboratory workflows.

Becton, Dickinson and Company follows with approximately 10-12% market share through its Onclarity HPV assay, which is FDA- and CE-approved for self-collected samples. Everlywell, though relatively smaller, has captured an estimated 2-4% share via DTC distribution and partnerships with CLIA-certified labs.

Companies like LifeCell International, Quest Diagnostics, and Teal Health are expanding reach in India, the USA, and emerging markets by offering tailored self-sampling kits and digital result platforms.

Recent Self-Sampling HPV Test Kits Market

  • In May 2024, Roche Diagnostics received FDA approval for its cobas HPV self-collection solution, allowing women in the USA to collect vaginal samples at home for cervical cancer screening. The milestone is expected to improve participation rates, offer greater privacy, and reduce barriers to testing, especially in underserved communities.

Leading Players in Self-Sampling HPV Test Kits Market

  • Becton, Dickinson and Company
  • Roche Diagnostics
  • LifeCell International
  • Trinity Medical Centre
  • Pragmatech Healthcare Solutions Pvt. Ltd
  • Daiichi Biotech Services Sdn Bhd.
  • Everlywell
  • UltrassayBioTech Co., Ltd
  • Winnergy Medical Public Company Limited
  • Teal Health, Inc
  • Quest Diagnostics
  • Medico Technology Co., Ltd.
  • IOTA Diagnostic

Report Coverage and Scope Summary

Report Attributes Details
Market Size (2025) USD 410.6 million
Projected Market Size (2035) USD 1,187.0 million
CAGR (2025 to 2035) 11.2%
Base Year for Estimation 2024
Historical Period 2020 to 2024
Projections Period 2025 to 2035
Quantitative Units USD million for market value
Test Kits Analyzed (Segment 1) Vaginal Swab-Based Kits, Lavage/Rinse-Based Kits, Tampon-Based Collection Kits, Brush-Based Kits, POC Integrated Kits
Applications Analyzed (Segment 2) Cervical Cancer Screening, Vaginal/Vulvar Screening Programs
Sales Channels Analyzed (Segment 3) Hospitals, Specialty Clinics, Retail Pharmacy Chains, Direct-to-Consumer (DTC) Platforms, Online Sales Channels
Regions Covered North America, Latin America, Western Europe, Eastern Europe, East Asia, South Asia & Pacific, Middle East & Africa
Countries Covered United States, Canada, Germany, United Kingdom, France, Italy, Spain, China, India, Japan, South Korea, Australia, Brazil, Mexico, Argentina, Saudi Arabia, UAE, South Africa
Key Players Becton, Dickinson and Company, Roche Diagnostics, LifeCell International, Trinity Medical Centre, Pragmatech Healthcare Solutions Pvt. Ltd., Daiichi Biotech Services Sdn Bhd., Everlywell, Ultrassay BioTech Co., Ltd, Winnergy Medical Public Company Limited, Teal Health, Inc, Quest Diagnostics, Medico Technology Co., Ltd., IOTA Diagnostic
Additional Attributes Dollar sales by kit type and channel, rising adoption in cervical screening programs, growing popularity of home-based testing, and increased DTC distribution driving early detection initiatives.

Self-Sampling HPV Test Kits Market Analyzed by Key Investment Segments

By Test Kits:

Segmented into vaginal swab-based kits, lavage/rinse-based kits, tampon-based collection kits, brush-based kits, and POC integrated kits.

By Application:

Applied primarily in cervical cancer screening and vaginal/vulvar screening programs.

By Sales Channel:

Distributed through hospitals, specialty clinics, retail pharmacy chains, direct-to-consumer (DTC) platforms, and online sales channels.

Table of Content

  1. Executive Summary
    • Global Market Outlook
    • Demand-side Trends
    • Supply-side Trends
    • Technology Roadmap Analysis
    • Analysis and Recommendations
  2. Market Overview
    • Market Coverage / Taxonomy
    • Market Definition / Scope / Limitations
  3. Market Background
    • Market Dynamics
      • Drivers
      • Restraints
      • Opportunity
      • Trends
    • Scenario Forecast
      • Demand in Optimistic Scenario
      • Demand in Likely Scenario
      • Demand in Conservative Scenario
    • Opportunity Map Analysis
    • Product Life Cycle Analysis
    • Supply Chain Analysis
      • Supply Side Participants and their Roles
        • Producers
        • Mid-Level Participants (Traders/ Agents/ Brokers)
        • Wholesalers and Distributors
      • Value Added and Value Created at Node in the Supply Chain
      • List of Raw Material Suppliers
      • List of Existing and Potential Buyer’s
    • Investment Feasibility Matrix
    • Value Chain Analysis
      • Profit Margin Analysis
      • Wholesalers and Distributors
      • Retailers
    • PESTLE and Porter’s Analysis
    • Regulatory Landscape
      • By Key Regions
      • By Key Countries
    • Regional Parent Market Outlook
    • Production and Consumption Statistics
    • Import and Export Statistics
  4. Global Market Analysis 2020 to 2024 and Forecast, 2025 to 2035
    • Historical Market Size Value (USD Million) & Volume (K Units) Analysis, 2020 to 2024
    • Current and Future Market Size Value (USD Million) & Volume (K Units) Projections, 2025 to 2035
      • Y-o-Y Growth Trend Analysis
      • Absolute $ Opportunity Analysis
  5. Global Market Pricing Analysis 2020 to 2024 and Forecast 2025 to 2035
  6. Global Market Analysis 2020 to 2024 and Forecast 2025 to 2035, By By Test Kits
    • Introduction / Key Findings
    • Historical Market Size Value (USD Million) & Volume (K Units) Analysis By By Test Kits, 2020 to 2024
    • Current and Future Market Size Value (USD Million) & Volume (K Units) Analysis and Forecast By By Test Kits, 2025 to 2035
      • Vaginal Swab-Based Kits
      • Lavage / Rinse-Based Kits
      • Tampon-based Collection Kits
      • Brush-based Kits
      • POC Integrated Kits
    • Y-o-Y Growth Trend Analysis By By Test Kits, 2020 to 2024
    • Absolute $ Opportunity Analysis By By Test Kits, 2025 to 2035
  7. Global Market Analysis 2020 to 2024 and Forecast 2025 to 2035, By By Application
    • Introduction / Key Findings
    • Historical Market Size Value (USD Million) & Volume (K Units) Analysis By By Application, 2020 to 2024
    • Current and Future Market Size Value (USD Million) & Volume (K Units) Analysis and Forecast By By Application, 2025 to 2035
      • Cervical Cancer Screening
      • Vaginal/Vulvar Screening
    • Y-o-Y Growth Trend Analysis By By Application, 2020 to 2024
    • Absolute $ Opportunity Analysis By By Application, 2025 to 2035
  8. Global Market Analysis 2020 to 2024 and Forecast 2025 to 2035, By Sales Channel
    • Introduction / Key Findings
    • Historical Market Size Value (USD Million) & Volume (K Units) Analysis By Sales Channel, 2020 to 2024
    • Current and Future Market Size Value (USD Million) & Volume (K Units) Analysis and Forecast By Sales Channel, 2025 to 2035
      • Hospitals
      • Speciality Clinics
      • Retail Pharmacy Chains
      • Direct-to-Consumer (DTC)
      • Online Sales
    • Y-o-Y Growth Trend Analysis By Sales Channel, 2020 to 2024
    • Absolute $ Opportunity Analysis By Sales Channel, 2025 to 2035
  9. Global Market Analysis 2020 to 2024 and Forecast 2025 to 2035, By Region
    • Introduction
    • Historical Market Size Value (USD Million) & Volume (K Units) Analysis By Region, 2020 to 2024
    • Current Market Size Value (USD Million) & Volume (K Units) Analysis and Forecast By Region, 2025 to 2035
      • North America
      • Latin America
      • Western Europe
      • Eastern Europe
      • East Asia
      • South Asia & Pacific
      • Middle East and Africa
    • Market Attractiveness Analysis By Region
  10. North America Market Analysis 2020 to 2024 and Forecast 2025 to 2035, By Country
    • Historical Market Size Value (USD Million) & Volume (K Units) Trend Analysis By Market Taxonomy, 2020 to 2024
    • Market Size Value (USD Million) & Volume (K Units) Forecast By Market Taxonomy, 2025 to 2035
      • By Country
        • USA
        • Canada
        • Mexico
      • By By Test Kits
      • By By Application
      • By Sales Channel
    • Market Attractiveness Analysis
      • By Country
      • By By Test Kits
      • By By Application
      • By Sales Channel
    • Key Takeaways
  11. Latin America Market Analysis 2020 to 2024 and Forecast 2025 to 2035, By Country
    • Historical Market Size Value (USD Million) & Volume (K Units) Trend Analysis By Market Taxonomy, 2020 to 2024
    • Market Size Value (USD Million) & Volume (K Units) Forecast By Market Taxonomy, 2025 to 2035
      • By Country
        • Brazil
        • Argentina
        • Rest of LATAM
      • By By Test Kits
      • By By Application
      • By Sales Channel
    • Market Attractiveness Analysis
      • By Country
      • By By Test Kits
      • By By Application
      • By Sales Channel
    • Key Takeaways
  12. Western Europe Market Analysis 2020 to 2024 and Forecast 2025 to 2035, By Country
    • Historical Market Size Value (USD Million) & Volume (K Units) Trend Analysis By Market Taxonomy, 2020 to 2024
    • Market Size Value (USD Million) & Volume (K Units) Forecast By Market Taxonomy, 2025 to 2035
      • By Country
        • Germany
        • Italy
        • France
        • UK
        • Spain
        • BENELUX
        • Nordic
        • Rest of W.Europe
      • By By Test Kits
      • By By Application
      • By Sales Channel
    • Market Attractiveness Analysis
      • By Country
      • By By Test Kits
      • By By Application
      • By Sales Channel
    • Key Takeaways
  13. Eastern Europe Market Analysis 2020 to 2024 and Forecast 2025 to 2035, By Country
    • Historical Market Size Value (USD Million) & Volume (K Units) Trend Analysis By Market Taxonomy, 2020 to 2024
    • Market Size Value (USD Million) & Volume (K Units) Forecast By Market Taxonomy, 2025 to 2035
      • By Country
        • Russia
        • Hungary
        • Poland
        • Balkan & Baltics
        • Rest of E. Europe
      • By By Test Kits
      • By By Application
      • By Sales Channel
    • Market Attractiveness Analysis
      • By Country
      • By By Test Kits
      • By By Application
      • By Sales Channel
    • Key Takeaways
  14. East Asia Market Analysis 2020 to 2024 and Forecast 2025 to 2035, By Country
    • Historical Market Size Value (USD Million) & Volume (K Units) Trend Analysis By Market Taxonomy, 2020 to 2024
    • Market Size Value (USD Million) & Volume (K Units) Forecast By Market Taxonomy, 2025 to 2035
      • By Country
        • China
        • Japan
        • South Korea
      • By By Test Kits
      • By By Application
      • By Sales Channel
    • Market Attractiveness Analysis
      • By Country
      • By By Test Kits
      • By By Application
      • By Sales Channel
    • Key Takeaways
  15. South Asia & Pacific Market Analysis 2020 to 2024 and Forecast 2025 to 2035, By Country
    • Historical Market Size Value (USD Million) & Volume (K Units) Trend Analysis By Market Taxonomy, 2020 to 2024
    • Market Size Value (USD Million) & Volume (K Units) Forecast By Market Taxonomy, 2025 to 2035
      • By Country
        • India
        • Australia & New Zealand
        • ASEAN
        • Rest of SAP
      • By By Test Kits
      • By By Application
      • By Sales Channel
    • Market Attractiveness Analysis
      • By Country
      • By By Test Kits
      • By By Application
      • By Sales Channel
    • Key Takeaways
  16. Middle East and Africa Market Analysis 2020 to 2024 and Forecast 2025 to 2035, By Country
    • Historical Market Size Value (USD Million) & Volume (K Units) Trend Analysis By Market Taxonomy, 2020 to 2024
    • Market Size Value (USD Million) & Volume (K Units) Forecast By Market Taxonomy, 2025 to 2035
      • By Country
        • GCC Countries
        • Northern Africa
        • South Africa
        • Turkiye
        • Rest of MEA
      • By By Test Kits
      • By By Application
      • By Sales Channel
    • Market Attractiveness Analysis
      • By Country
      • By By Test Kits
      • By By Application
      • By Sales Channel
    • Key Takeaways
  17. Key Countries Market Analysis
    • USA
      • Pricing Analysis
      • Market Share Analysis, 2024
        • By By Test Kits
        • By By Application
        • By Sales Channel
    • Canada
      • Pricing Analysis
      • Market Share Analysis, 2024
        • By By Test Kits
        • By By Application
        • By Sales Channel
    • Brazil
      • Pricing Analysis
      • Market Share Analysis, 2024
        • By By Test Kits
        • By By Application
        • By Sales Channel
    • Mexico
      • Pricing Analysis
      • Market Share Analysis, 2024
        • By By Test Kits
        • By By Application
        • By Sales Channel
    • Argentina
      • Pricing Analysis
      • Market Share Analysis, 2024
        • By By Test Kits
        • By By Application
        • By Sales Channel
  18. Market Structure Analysis
    • Competition Dashboard
    • Competition Benchmarking
    • Market Share Analysis of Top Players
      • By Regional
      • By By Test Kits
      • By By Application
      • By Sales Channel
  19. Competition Analysis
    • Competition Deep Dive
      • Becton, Dickinson and Company
        • Overview
        • Product Portfolio
        • Profitability by Market Segments (Product/Age /Sales Channel/Region)
        • Sales Footprint
        • Strategy Overview
          • Marketing Strategy
          • Product Strategy
          • Channel Strategy
      • Roche Diagnostics
        • Overview
        • Product Portfolio
        • Profitability by Market Segments (Product/Age /Sales Channel/Region)
        • Sales Footprint
        • Strategy Overview
          • Marketing Strategy
          • Product Strategy
          • Channel Strategy
      • LifeCell International
        • Overview
        • Product Portfolio
        • Profitability by Market Segments (Product/Age /Sales Channel/Region)
        • Sales Footprint
        • Strategy Overview
          • Marketing Strategy
          • Product Strategy
          • Channel Strategy
      • Trinity Medical Centre
        • Overview
        • Product Portfolio
        • Profitability by Market Segments (Product/Age /Sales Channel/Region)
        • Sales Footprint
        • Strategy Overview
          • Marketing Strategy
          • Product Strategy
          • Channel Strategy
      • Pragmatech Healthcare Solutions Pvt. Ltd
        • Overview
        • Product Portfolio
        • Profitability by Market Segments (Product/Age /Sales Channel/Region)
        • Sales Footprint
        • Strategy Overview
          • Marketing Strategy
          • Product Strategy
          • Channel Strategy
      • Daiichi Biotech Services Sdn Bhd.
        • Overview
        • Product Portfolio
        • Profitability by Market Segments (Product/Age /Sales Channel/Region)
        • Sales Footprint
        • Strategy Overview
          • Marketing Strategy
          • Product Strategy
          • Channel Strategy
      • Everlywell
        • Overview
        • Product Portfolio
        • Profitability by Market Segments (Product/Age /Sales Channel/Region)
        • Sales Footprint
        • Strategy Overview
          • Marketing Strategy
          • Product Strategy
          • Channel Strategy
      • Ultrassay BioTech Co., Ltd
        • Overview
        • Product Portfolio
        • Profitability by Market Segments (Product/Age /Sales Channel/Region)
        • Sales Footprint
        • Strategy Overview
          • Marketing Strategy
          • Product Strategy
          • Channel Strategy
      • Winnergy Medical Public Company Limited
        • Overview
        • Product Portfolio
        • Profitability by Market Segments (Product/Age /Sales Channel/Region)
        • Sales Footprint
        • Strategy Overview
          • Marketing Strategy
          • Product Strategy
          • Channel Strategy
      • Teal Health, Inc
        • Overview
        • Product Portfolio
        • Profitability by Market Segments (Product/Age /Sales Channel/Region)
        • Sales Footprint
        • Strategy Overview
          • Marketing Strategy
          • Product Strategy
          • Channel Strategy
      • Quest Diagnostics
        • Overview
        • Product Portfolio
        • Profitability by Market Segments (Product/Age /Sales Channel/Region)
        • Sales Footprint
        • Strategy Overview
          • Marketing Strategy
          • Product Strategy
          • Channel Strategy
      • Medico Technology Co., Ltd.
        • Overview
        • Product Portfolio
        • Profitability by Market Segments (Product/Age /Sales Channel/Region)
        • Sales Footprint
        • Strategy Overview
          • Marketing Strategy
          • Product Strategy
          • Channel Strategy
      • IOTA Diagnostic
        • Overview
        • Product Portfolio
        • Profitability by Market Segments (Product/Age /Sales Channel/Region)
        • Sales Footprint
        • Strategy Overview
          • Marketing Strategy
          • Product Strategy
          • Channel Strategy
  20. Assumptions & Acronyms Used
  21. Research Methodology

List of Tables

  • Table 1: Global Market Value (USD Million) Forecast by Region, 2020-2035
  • Table 2: Global Market Volume (K Units) Forecast by Region, 2020-2035
  • Table 3: Global Market Value (USD Million) Forecast by By Test Kits, 2020-2035
  • Table 4: Global Market Volume (K Units) Forecast by By Test Kits, 2020-2035
  • Table 5: Global Market Value (USD Million) Forecast by By Application, 2020-2035
  • Table 6: Global Market Volume (K Units) Forecast by By Application, 2020-2035
  • Table 7: Global Market Value (USD Million) Forecast by Sales Channel, 2020-2035
  • Table 8: Global Market Volume (K Units) Forecast by Sales Channel, 2020-2035
  • Table 9: North America Market Value (USD Million) Forecast by Country, 2020-2035
  • Table 10: North America Market Volume (K Units) Forecast by Country, 2020-2035
  • Table 11: North America Market Value (USD Million) Forecast by By Test Kits, 2020-2035
  • Table 12: North America Market Volume (K Units) Forecast by By Test Kits, 2020-2035
  • Table 13: North America Market Value (USD Million) Forecast by By Application, 2020-2035
  • Table 14: North America Market Volume (K Units) Forecast by By Application, 2020-2035
  • Table 15: North America Market Value (USD Million) Forecast by Sales Channel, 2020-2035
  • Table 16: North America Market Volume (K Units) Forecast by Sales Channel, 2020-2035
  • Table 17: Latin America Market Value (USD Million) Forecast by Country, 2020-2035
  • Table 18: Latin America Market Volume (K Units) Forecast by Country, 2020-2035
  • Table 19: Latin America Market Value (USD Million) Forecast by By Test Kits, 2020-2035
  • Table 20: Latin America Market Volume (K Units) Forecast by By Test Kits, 2020-2035
  • Table 21: Latin America Market Value (USD Million) Forecast by By Application, 2020-2035
  • Table 22: Latin America Market Volume (K Units) Forecast by By Application, 2020-2035
  • Table 23: Latin America Market Value (USD Million) Forecast by Sales Channel, 2020-2035
  • Table 24: Latin America Market Volume (K Units) Forecast by Sales Channel, 2020-2035
  • Table 25: Western Europe Market Value (USD Million) Forecast by Country, 2020-2035
  • Table 26: Western Europe Market Volume (K Units) Forecast by Country, 2020-2035
  • Table 27: Western Europe Market Value (USD Million) Forecast by By Test Kits, 2020-2035
  • Table 28: Western Europe Market Volume (K Units) Forecast by By Test Kits, 2020-2035
  • Table 29: Western Europe Market Value (USD Million) Forecast by By Application, 2020-2035
  • Table 30: Western Europe Market Volume (K Units) Forecast by By Application, 2020-2035
  • Table 31: Western Europe Market Value (USD Million) Forecast by Sales Channel, 2020-2035
  • Table 32: Western Europe Market Volume (K Units) Forecast by Sales Channel, 2020-2035
  • Table 33: Eastern Europe Market Value (USD Million) Forecast by Country, 2020-2035
  • Table 34: Eastern Europe Market Volume (K Units) Forecast by Country, 2020-2035
  • Table 35: Eastern Europe Market Value (USD Million) Forecast by By Test Kits, 2020-2035
  • Table 36: Eastern Europe Market Volume (K Units) Forecast by By Test Kits, 2020-2035
  • Table 37: Eastern Europe Market Value (USD Million) Forecast by By Application, 2020-2035
  • Table 38: Eastern Europe Market Volume (K Units) Forecast by By Application, 2020-2035
  • Table 39: Eastern Europe Market Value (USD Million) Forecast by Sales Channel, 2020-2035
  • Table 40: Eastern Europe Market Volume (K Units) Forecast by Sales Channel, 2020-2035
  • Table 41: East Asia Market Value (USD Million) Forecast by Country, 2020-2035
  • Table 42: East Asia Market Volume (K Units) Forecast by Country, 2020-2035
  • Table 43: East Asia Market Value (USD Million) Forecast by By Test Kits, 2020-2035
  • Table 44: East Asia Market Volume (K Units) Forecast by By Test Kits, 2020-2035
  • Table 45: East Asia Market Value (USD Million) Forecast by By Application, 2020-2035
  • Table 46: East Asia Market Volume (K Units) Forecast by By Application, 2020-2035
  • Table 47: East Asia Market Value (USD Million) Forecast by Sales Channel, 2020-2035
  • Table 48: East Asia Market Volume (K Units) Forecast by Sales Channel, 2020-2035
  • Table 49: South Asia & Pacific Market Value (USD Million) Forecast by Country, 2020-2035
  • Table 50: South Asia & Pacific Market Volume (K Units) Forecast by Country, 2020-2035
  • Table 51: South Asia & Pacific Market Value (USD Million) Forecast by By Test Kits, 2020-2035
  • Table 52: South Asia & Pacific Market Volume (K Units) Forecast by By Test Kits, 2020-2035
  • Table 53: South Asia & Pacific Market Value (USD Million) Forecast by By Application, 2020-2035
  • Table 54: South Asia & Pacific Market Volume (K Units) Forecast by By Application, 2020-2035
  • Table 55: South Asia & Pacific Market Value (USD Million) Forecast by Sales Channel, 2020-2035
  • Table 56: South Asia & Pacific Market Volume (K Units) Forecast by Sales Channel, 2020-2035
  • Table 57: Middle East and Africa Market Value (USD Million) Forecast by Country, 2020-2035
  • Table 58: Middle East and Africa Market Volume (K Units) Forecast by Country, 2020-2035
  • Table 59: Middle East and Africa Market Value (USD Million) Forecast by By Test Kits, 2020-2035
  • Table 60: Middle East and Africa Market Volume (K Units) Forecast by By Test Kits, 2020-2035
  • Table 61: Middle East and Africa Market Value (USD Million) Forecast by By Application, 2020-2035
  • Table 62: Middle East and Africa Market Volume (K Units) Forecast by By Application, 2020-2035
  • Table 63: Middle East and Africa Market Value (USD Million) Forecast by Sales Channel, 2020-2035
  • Table 64: Middle East and Africa Market Volume (K Units) Forecast by Sales Channel, 2020-2035

List of Figures

  • Figure 1: Global Market Volume (K Units) Forecast 2020-2035
  • Figure 2: Global Market Pricing Analysis
  • Figure 3: Global Market Value (USD Million) Forecast 2020-2035
  • Figure 4: Global Market Value Share and BPS Analysis by By Test Kits, 2025 and 2035
  • Figure 5: Global Market Y-o-Y Growth Comparison by By Test Kits, 2025-2035
  • Figure 6: Global Market Attractiveness Analysis by By Test Kits
  • Figure 7: Global Market Value Share and BPS Analysis by By Application, 2025 and 2035
  • Figure 8: Global Market Y-o-Y Growth Comparison by By Application, 2025-2035
  • Figure 9: Global Market Attractiveness Analysis by By Application
  • Figure 10: Global Market Value Share and BPS Analysis by Sales Channel, 2025 and 2035
  • Figure 11: Global Market Y-o-Y Growth Comparison by Sales Channel, 2025-2035
  • Figure 12: Global Market Attractiveness Analysis by Sales Channel
  • Figure 13: Global Market Value (USD Million) Share and BPS Analysis by Region, 2025 and 2035
  • Figure 14: Global Market Y-o-Y Growth Comparison by Region, 2025-2035
  • Figure 15: Global Market Attractiveness Analysis by Region
  • Figure 16: North America Market Incremental $ Opportunity, 2025-2035
  • Figure 17: Latin America Market Incremental $ Opportunity, 2025-2035
  • Figure 18: Western Europe Market Incremental $ Opportunity, 2025-2035
  • Figure 19: Eastern Europe Market Incremental $ Opportunity, 2025-2035
  • Figure 20: East Asia Market Incremental $ Opportunity, 2025-2035
  • Figure 21: South Asia & Pacific Market Incremental $ Opportunity, 2025-2035
  • Figure 22: Middle East and Africa Market Incremental $ Opportunity, 2025-2035
  • Figure 23: North America Market Value Share and BPS Analysis by Country, 2025 and 2035
  • Figure 24: North America Market Value Share and BPS Analysis by By Test Kits, 2025 and 2035
  • Figure 25: North America Market Y-o-Y Growth Comparison by By Test Kits, 2025-2035
  • Figure 26: North America Market Attractiveness Analysis by By Test Kits
  • Figure 27: North America Market Value Share and BPS Analysis by By Application, 2025 and 2035
  • Figure 28: North America Market Y-o-Y Growth Comparison by By Application, 2025-2035
  • Figure 29: North America Market Attractiveness Analysis by By Application
  • Figure 30: North America Market Value Share and BPS Analysis by Sales Channel, 2025 and 2035
  • Figure 31: North America Market Y-o-Y Growth Comparison by Sales Channel, 2025-2035
  • Figure 32: North America Market Attractiveness Analysis by Sales Channel
  • Figure 33: Latin America Market Value Share and BPS Analysis by Country, 2025 and 2035
  • Figure 34: Latin America Market Value Share and BPS Analysis by By Test Kits, 2025 and 2035
  • Figure 35: Latin America Market Y-o-Y Growth Comparison by By Test Kits, 2025-2035
  • Figure 36: Latin America Market Attractiveness Analysis by By Test Kits
  • Figure 37: Latin America Market Value Share and BPS Analysis by By Application, 2025 and 2035
  • Figure 38: Latin America Market Y-o-Y Growth Comparison by By Application, 2025-2035
  • Figure 39: Latin America Market Attractiveness Analysis by By Application
  • Figure 40: Latin America Market Value Share and BPS Analysis by Sales Channel, 2025 and 2035
  • Figure 41: Latin America Market Y-o-Y Growth Comparison by Sales Channel, 2025-2035
  • Figure 42: Latin America Market Attractiveness Analysis by Sales Channel
  • Figure 43: Western Europe Market Value Share and BPS Analysis by Country, 2025 and 2035
  • Figure 44: Western Europe Market Value Share and BPS Analysis by By Test Kits, 2025 and 2035
  • Figure 45: Western Europe Market Y-o-Y Growth Comparison by By Test Kits, 2025-2035
  • Figure 46: Western Europe Market Attractiveness Analysis by By Test Kits
  • Figure 47: Western Europe Market Value Share and BPS Analysis by By Application, 2025 and 2035
  • Figure 48: Western Europe Market Y-o-Y Growth Comparison by By Application, 2025-2035
  • Figure 49: Western Europe Market Attractiveness Analysis by By Application
  • Figure 50: Western Europe Market Value Share and BPS Analysis by Sales Channel, 2025 and 2035
  • Figure 51: Western Europe Market Y-o-Y Growth Comparison by Sales Channel, 2025-2035
  • Figure 52: Western Europe Market Attractiveness Analysis by Sales Channel
  • Figure 53: Eastern Europe Market Value Share and BPS Analysis by Country, 2025 and 2035
  • Figure 54: Eastern Europe Market Value Share and BPS Analysis by By Test Kits, 2025 and 2035
  • Figure 55: Eastern Europe Market Y-o-Y Growth Comparison by By Test Kits, 2025-2035
  • Figure 56: Eastern Europe Market Attractiveness Analysis by By Test Kits
  • Figure 57: Eastern Europe Market Value Share and BPS Analysis by By Application, 2025 and 2035
  • Figure 58: Eastern Europe Market Y-o-Y Growth Comparison by By Application, 2025-2035
  • Figure 59: Eastern Europe Market Attractiveness Analysis by By Application
  • Figure 60: Eastern Europe Market Value Share and BPS Analysis by Sales Channel, 2025 and 2035
  • Figure 61: Eastern Europe Market Y-o-Y Growth Comparison by Sales Channel, 2025-2035
  • Figure 62: Eastern Europe Market Attractiveness Analysis by Sales Channel
  • Figure 63: East Asia Market Value Share and BPS Analysis by Country, 2025 and 2035
  • Figure 64: East Asia Market Value Share and BPS Analysis by By Test Kits, 2025 and 2035
  • Figure 65: East Asia Market Y-o-Y Growth Comparison by By Test Kits, 2025-2035
  • Figure 66: East Asia Market Attractiveness Analysis by By Test Kits
  • Figure 67: East Asia Market Value Share and BPS Analysis by By Application, 2025 and 2035
  • Figure 68: East Asia Market Y-o-Y Growth Comparison by By Application, 2025-2035
  • Figure 69: East Asia Market Attractiveness Analysis by By Application
  • Figure 70: East Asia Market Value Share and BPS Analysis by Sales Channel, 2025 and 2035
  • Figure 71: East Asia Market Y-o-Y Growth Comparison by Sales Channel, 2025-2035
  • Figure 72: East Asia Market Attractiveness Analysis by Sales Channel
  • Figure 73: South Asia & Pacific Market Value Share and BPS Analysis by Country, 2025 and 2035
  • Figure 74: South Asia & Pacific Market Value Share and BPS Analysis by By Test Kits, 2025 and 2035
  • Figure 75: South Asia & Pacific Market Y-o-Y Growth Comparison by By Test Kits, 2025-2035
  • Figure 76: South Asia & Pacific Market Attractiveness Analysis by By Test Kits
  • Figure 77: South Asia & Pacific Market Value Share and BPS Analysis by By Application, 2025 and 2035
  • Figure 78: South Asia & Pacific Market Y-o-Y Growth Comparison by By Application, 2025-2035
  • Figure 79: South Asia & Pacific Market Attractiveness Analysis by By Application
  • Figure 80: South Asia & Pacific Market Value Share and BPS Analysis by Sales Channel, 2025 and 2035
  • Figure 81: South Asia & Pacific Market Y-o-Y Growth Comparison by Sales Channel, 2025-2035
  • Figure 82: South Asia & Pacific Market Attractiveness Analysis by Sales Channel
  • Figure 83: Middle East and Africa Market Value Share and BPS Analysis by Country, 2025 and 2035
  • Figure 84: Middle East and Africa Market Value Share and BPS Analysis by By Test Kits, 2025 and 2035
  • Figure 85: Middle East and Africa Market Y-o-Y Growth Comparison by By Test Kits, 2025-2035
  • Figure 86: Middle East and Africa Market Attractiveness Analysis by By Test Kits
  • Figure 87: Middle East and Africa Market Value Share and BPS Analysis by By Application, 2025 and 2035
  • Figure 88: Middle East and Africa Market Y-o-Y Growth Comparison by By Application, 2025-2035
  • Figure 89: Middle East and Africa Market Attractiveness Analysis by By Application
  • Figure 90: Middle East and Africa Market Value Share and BPS Analysis by Sales Channel, 2025 and 2035
  • Figure 91: Middle East and Africa Market Y-o-Y Growth Comparison by Sales Channel, 2025-2035
  • Figure 92: Middle East and Africa Market Attractiveness Analysis by Sales Channel
  • Figure 93: Global Market - Tier Structure Analysis
  • Figure 94: Global Market - Company Share Analysis

Frequently Asked Questions

What is the projected size of the self-sampling HPV test kits market by 2035?

The market is expected to reach USD 1,187.0 million by 2035.

What is the current valuation of the self-sampling HPV test kits market in 2025?

The market is valued at USD 410.6 million in 2025.

What is the growth rate of the self-sampling HPV test kits market from 2025 to 2035?

The market is set to grow at a CAGR of 11.2% during the forecast period.

Which is the leading test kit type in the self-sampling HPV test kits market?

Vaginal swab-based kits lead the segment with a 49% market share in 2025.

Which country is expected to show the fastest growth in the self-sampling HPV test kits market?

India is projected to grow at the highest CAGR of 13.9% from 2025 to 2035.

Explore Similar Insights

Future Market Insights

Self-sampling HPV Test Kits Market