Reports

- Global Locations -

Headquarters

Future Market Insights, Inc.

Christiana Corporate, 200
Continental Drive, Suite 401,
Newark, Delaware - 19713,
United States

T: +1-347-918-3531

Americas

Future Market Insights, Inc.

616 Corporate Way, Suite 2-9018,
Valley Cottage, NY 10989, United States

MEA

Future Market Insights

1602-6 Jumeirah Bay X2 Tower, Plot No: JLT-PH2-X2A,
Jumeirah Lakes Towers, Dubai,
United Arab Emirates

Europe

Future Market Insights

3rd Floor, 207 Regent Street,
W1B 3HH London
United Kingdom

T: + 44 (0) 20 8123 9659

Asia Pacific

Future Market Insights

IndiaLand Global Tech Park, Unit UG-1, Behind Grand HighStreet, Phase 1, Hinjawadi, MH, Pune – 411057, India

A Summary of the Shawarma Grill Machine Market Developments (2023 to 2033)

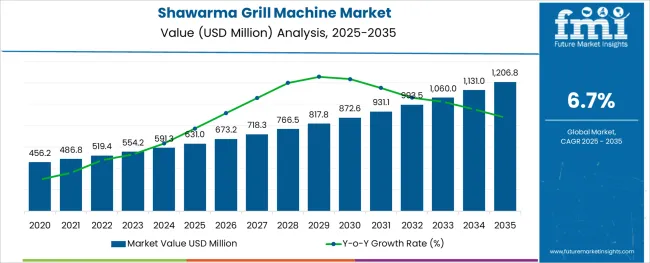
The global shawarma grill machine market is projected to have a moderate-paced CAGR of 6.7% during the forecast period. The current valuation of the market is US$ 554.2 million in 2023. The market value of the shawarma grill machine market is anticipated to reach a high of US$ 1,060.1 million by the year 2033. A historical market valuation of US$ 518.5 million has been recorded by the experts of Future Market Insights for the concerned market during the base year. This growth is supported by:

  • Easy availability in a wide range of product types that cater to the need of the customers.
  • A unique feature of the savory cooked on a shawarma grill machine imparts a smoky flavor or aroma to the dish, which is appealing to the consumers’ taste buds.
  • User-friendly features of these grill machines and the rise in the awareness about usage of such equipment are projected to fuel the market demand for the product.
  • A rapidly evolving lifestyle coupled with a surge in disposable income is leading consumers to eat barbequed and restaurant-style food at home.
  • The use of shawarma grill machines in commercial settings is offering significant opportunities to players operating in the concerned market.
  • The rise in the number of dine-out lifestyles among young adults is a vital factor responsible for the upliftment of market statistics.
  • The gas barbeque grill market is also gaining traction sidewise with shawarma grill machines, as it offers a healthier food option that has low fat and low-calorie content.

Although the market is having healthy growth, it has been revealed by the expert analysts at Future Market Insights that certain elements are likely to curb the pace of advancement for the shawarma grill machine market during the forthcoming years. The restraining factors identified are as follows:

  • Waste disposal concerns are hampering the market players from producing shawarma grill machines, owing to issues about the biodegradability of the tableware products used, which are largely made of plastics.
  • An upsurge in the cost of research and development activities acts as a major factor amongst others that is anticipated to obstruct the market growth during the projection period.
Report Attribute Details
Shawarma Grill Machine Market Value (2023) US$ 554.2 million
Shawarma Grill Machine Market Anticipated Value (2033) US$ 1,060.1 million
Shawarma Grill Machine Projected Growth Rate (2023 to 2033) 6.7%

Don't pay for what you don't need

Customize your report by selecting specific countries or regions and save 30%!

Introduction of Electric Shawarma Grill Machines - A Stroke of Luck for Propelling Forum

As per the analysis of FMI, it has been identified the end-use industries and consumers in recent years have been demanding easy and convenient grilling appliances that can cope with the hectic work schedules and faster delivery of palates across eateries. The restaurant sector is seeking lightweight alternatives to various food preparation appliances. Electric shawarma grill machines are reckoned to be more convenient, owing to the fact that they do not need consistent addition of fuel such as wood, gas, and charcoal. Flames are not involved in the process, which keeps the product clean, as the shawarmas are constantly heated by electricity.

Additionally, the electric shawarma grill machines are portable and do not incur any installation costs. They are available in compact sizes, which makes them easy to be carried, prompting customers to use them for indoor and outdoor activities too.

Preview of Factual Insights for the period 2018 to 2022

After analyzing the market in-depth, the experts of FMI have unveiled that the shawarma grill machine market has been witnessing an unprecedented surge in the past few years. There is an approximate rise of US$ 35.7 million surge in the total market value from 2022 to 2023. The market during the period 2018 to 2023 registered a CAGR of 2.9%.

The growth of the market can be attributed to the increasing trend of consuming meat and the demand for processed food. The growing meat and poultry industry, coupled with rising investments in the same are opening up avenues for more consumption of meat preparations or protein food products by consumers.

Macroeconomic factors like emerging economies in diverse countries, the surge in per capita income, and the rapid rate of urbanization are instigating the populace to try out new cuisines like shawarma, burritos, pita bread, rice pilafs, and more, driving the demand for shawarma grill machines with evolving lifestyles across the globe.

Additionally, Programmable Logic Controllers (PLCs) and Recipe Management Controllers in automatic shawarma grill machines are identified to be some technological advances that have stirred up the market dynamics in the historical period.

Nandini Roy Choudhury

Principal Consultant

Talk to Analyst

Find your sweet spots for generating winning opportunities in this market.

Comparative Analysis of Adjacent Markets

Shawarma Grill Machine Market:

Differentiating Aspects Shawarma Grill Machine Market
CAGR 6.7%
Market Valuation in 2023 US$ 554.2 Million
Projected Market Value in 2033 US$ 1,060.1 Million
Drivers
  • The surge in the dine-out lifestyle fuels the consumption of Lebanese food like shawarma, elevating market shares for shawarma grill machines.
  • Smoky flavors imparted to the savory with grill machines are largely preferred by consumers, thereby bolstering sales for the machines.

Barbeque Grill Machine Market:

Differentiating Aspects Barbeque Grill Machine Market
CAGR 4.5%
Market Valuation in 2023 US$ 951.79 Million
Projected Market Value in 2033 US$ 1,478.09 Million
Drivers
  • Preferences of individuals to have outside gatherings and picnics are anticipated to fuel the market shares for commercial barbeque grill machines.
  • The rising disposable income of the populace across the developing economies is influencing food habits and is therefore raising the adoption of barbeque grill machines, favoring the rising consumption of meat-based food items.

Electric Grilling Machine Market:

Differentiating Aspects Electric Grilling Machine Market
CAGR 5.5%
Market Valuation in 2023 US$ 1.90 Billion
Projected Market Value in 2033 US$ 3.24 Billion
Drivers
  • The rising trend of cookouts on weekends and holidays is projected to fuel the market size of electric grill machines.
  • Compactness and portability, coupled with minimal or no fuel consumption are identified to be key aspects boosting market growth for electric grill machines.

Category-wise Insights

A Peek into the Domineering Segments in the Shawarma Grill Machine Market

Semi-automatic Shawarma Grill Machine - By Product Type

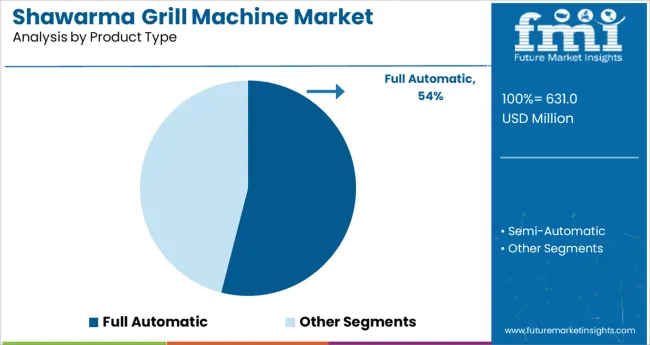
After an in-depth analysis of the shawarma grill machine market, it is identified that the semi-automatic segment dominates the product type category. This segment is currently accountable for a market share of 79.1% in 2023. The responsible aspects behind the optimum sale of semi-automatic shawarma grill machines are:

  • These machines come in high-quality bearing designs that allow smooth operation while meat preparations.
  • They are safe and convenient to use and save a considerable share of money for the shawarma sellers with fewer fumes due to no or minimal usage of natural gas for preparing the shawarma.

Gas-based Shawarma Grill Machine - By Fuel Type

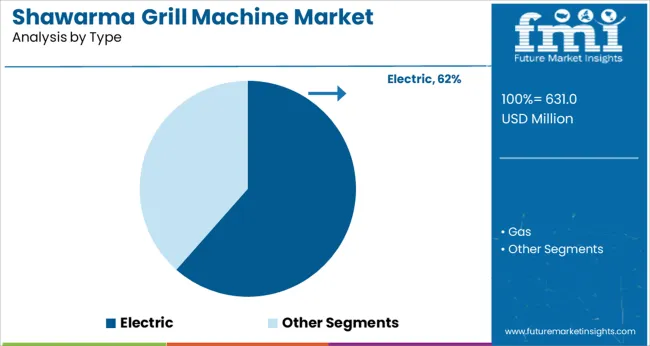
The gas-based grill machine segment is estimated to hold a dominant market share during the forecast period. At present, this segment is accountable for a market share of 69.4% and is likely to exert influence in the forthcoming years too. The factors responsible for the growth of this segment can be identified as follows:
  • The gas-based grills offer healthier food options with low fat and calories in comparison to other fuel-type grill machines.
  • These machines serve as an eco-friendly alternative as it uses natural gas or liquified petroleum gas as a fuel source for cooking food.

Get the data you need at a Fraction of the cost

Personalize your report by choosing insights you need
and save 40%!

Country-wise Insights

Preference for Enhanced Flavors in Diverse Economies Influences the Sale of Shawarma Grill Machines

Country United States of America
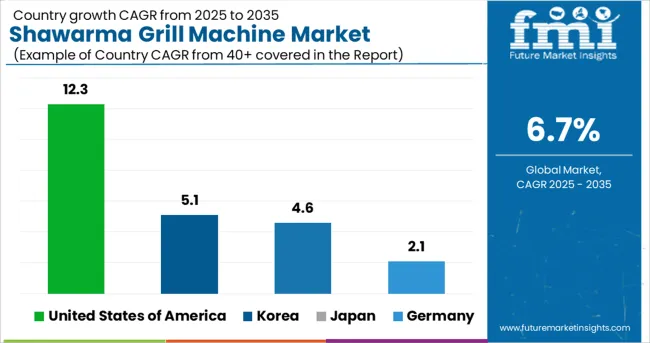
Statistics The USA shawarma grill machine market is likely to dominate the North American region with a CAGR of 12.3% during the projection period. The barbeque grill market in North America is anticipated to account for 27.6% market share from 2023 to 2033.
Growth Propellants The factors responsible for the growth of the market in the USA are identified as the following:
  • The emergence of smart kitchens and the adoption of advanced technologies in the restaurant sector across the USA is creating robust growth opportunities for shawarma grill machines for home use.
  • The rising trend of cookouts on weekends and holidays, especially among the younger population is expected to drive the growth.
Country Germany
Statistics The market in Germany is expected to advance at a steady pace, recording a CAGR of 2.1% through 2033. The European barbeque grill market accounted for a market share of 35.1% during the base year and is likely to exert the same dominance in the upcoming years.
Growth Propellants Factors propelling the growth of the market in Germany are:
  • The populace in this country is heavily investing in grilling products that are making an allowance for an eat-out experience at home.
  • The tradition of outdoor cooking in European countries is further fueling the sale of chicken shawarma grill machines across Germany.
Country Japan
Statistics Japan is estimated to advance at a moderate pace, registering a CAGR of 4.6% during the period 2023 to 2023.
Growth Propellants Aspects propelling the growth of the shawarma grill market in the country of Japan are:
  • The restaurant sector is rapidly advancing, and the owners are increasingly spending on luxury kitchen appliances for ease of operation, faster delivery of orders, and convenience of handling with automated and semi-automated solutions.
  • The presence of key players across the region, who are launching innovative products is further bolstering the market dynamics in Japan.
Country Korea
Statistics The Korean shawarma grill machine market is projected to advance at a CAGR of 5.1% through 2033.
Growth Propellants The market in Korea is witnessing a significant surge owing to:
  • High manufacturing of machines, coupled with increased consumption of meat in this country and changing food preferences.
  • Government initiatives and a surge in Research and Development activities on barbeque machines are making allowance for market players to cater to the diverse demand of consumers, fueling the market size of shawarma grill machines in Korea.

Start-up Ecosystem

Emerging Companies Revamp the Shawarma Grill Machine Landscape

The new entrants in the shawarma grill machine market are leveraging advancements in technology to launch new products and gain a competitive advantage. These firms are continually investing in research and development activities to keep themselves in tandem with the changing consumer preferences and end-use industry demands. Efforts are being made to strengthen their foothold in the forum and aid the further progression of the shawarma grill machines market.

Top Start-ups to Watch for

Spark Grills - USA-based Start-up

Developed an internet-first brand offering smart grills and accessories for cooking. The company provides portable charcoal grill systems with wheels. The spark produced on switching the grill ignites the bricks which come along with the system and provides the experience of a real charcoal grill. It also offers accessories like grill covers, temperature probes, cutting boards, etc. The company also creates a social impact by supporting the financial health of local families and communities.

Coolex Industries Pvt. Ltd. - Indian Start-up

This firm is providing a number of grill machines like chicken barbeque grill machines, mini shawarma grill machines, and other kitchen equipment based on the end-use industry demands and consumer choice for convenient grilling solutions.

Char-Broil - USA-based Start-up

This start-up company introduced the SmartChef Smoker app to notify people about maintaining meat temperature, chamber temperature, and cooking time.

Competitive Landscape

Biggies Revolutionizing the Market Dynamics with Smart Technologies

Due to the existence of numerous international and regional companies, the market for shawarma grill machines is very competitive. To strengthen their position in the market, major players are implementing a variety of methods, including product portfolio growth and regional development. Leading market players are adopting various business strategies, such as mergers and acquisitions, to expand their geographic presence and consumer base across the world.

Many luxury barbeque grill manufacturers in the US, such as Fire Magic and Twin Eagles, have been offering their products to consumers at a premium price with advanced functionalities. Luxury barbeque grills are usually more convenient and high-tech. This cutting-edge technology helps users utilize these products safely and more effectively.

Recently, under the name George Foreman Grills, Spectrum Brands, Inc. introduced the Grill & Broil, an electric grill comprising five non-stick plates. Product innovations such as the Tower T14028 indoor/outdoor electric shawarma grill are standing out in the marketplace.

Luxury shawarma grill machine manufacturers, such as Fire Magic, provide a limited lifetime warranty based on the type of material of the grill. The surge in disposable income among consumers in developing regions has also led to an increase in consumers' purchasing power, thus, fueling the spending on luxury kitchen appliances, which is driving the shawarma grill machine market growth.

Recent Developments

  • In November 2021, Kenyon International, Inc., a specialty electric grill manufacturer, launched a new product called the G2 Grill. The product offers a 35% larger cooking surface than other electric grills offered by the company.
  • In January 2020, Weber-Stephen launched its Smart Grilling Hub with connected USB ports and wireless access through a mobile application. The device allows the user to monitor the temperature of the food with built-in sensors.
  • In March 2019, IntelliKEN Touch, which has characteristics such as a built-in kitchen timer and touch control system, was introduced by Kenyon International, Inc. A non-stick grill plate is included with these cutting-edge goods, and it can be hand- or dishwasher-washed. Additionally, they eliminate the need to acquire gas bottles, clean grease, and light charcoal.
  • In October 2019, Weber partnered with June, a smart cooking start-up, to integrate intelligent technologies into its electric shawarma grill machines.

Some of the key companies proliferating in the market are

  • Broilmaster
  • Char-broil LLC
  • Dean Forge Ltd.
  • Fire Magic
  • Landmann
  • Shutter home and hearth
  • The Coleman Company, Inc.
  • Traeger Pellet Grills LLC
  • Transform SR Brands LLC
  • Weber-Stephen Products LLC (HK) Ltd

Key Segments in the Shawarma Grill Machine Market

By Product Type:

  • Gas Shawarma Grill Machines
  • Charcoal Shawarma Grill Machines
  • Electric Shawarma Grill Machines

By Application Type:

  • Household Shawarma Grill Machines
  • Commercial Shawarma Grill Machines

By Region:

  • North America
  • Latin America
  • Asia Pacific
  • Middle East and Africa (MEA)
  • Europe

Frequently Asked Questions

What is the Growth Outlook for the Shawarma Grill Machine Market?

The growth outlook for the shawarma grill machine market is predicted to advance at a CAGR of 6.7% from 2023 to 2033.

Which Region Leads the Shawarma Grill Machine Market?

The North American region is anticipated to lead the shawarma grill machine market during the forecast period.

What is the market valuation of the Shawarma Grill Machine in 2023?

The market valuation of the shawarma grill machine market stands at US$ 554.2 million in 2023.

How much Growth Potential does the Shawarma Grill Machine hold?

The shawarma grill machine market is likely to hold a valuation of US$ 1,060.1 million by 2033.

Which sector is the key driver in the Shawarma Grill Machine Market?

The restaurant sector is the key driver in the shawarma grill machine market.

Table of Content

1. Executive Summary | Shawarma Grill Machine Market

    1.1. Global Market Outlook

    1.2. Demand Side Trends

    1.3. Supply Side Trends

    1.4. Technology Roadmap

    1.5. Analysis and Recommendations

2. Market Overview

    2.1. Market Coverage / Taxonomy

    2.2. Market Definition / Scope / Limitations

3. Key Market Trends

    3.1. Key Trends Impacting the Market

    3.2. Product Innovation / Development Trends

4. Key Success Factors

5. Global Market Demand Analysis 2018 to 2022 and Forecast, 2023 to 2033

    5.1. Historical Market Volume (Units) Analysis, 2018 to 2022

    5.2. Current and Future Market Volume (Units) Projections, 2023 to 2033

    5.3. Y-o-Y Growth Trend Analysis

6. Global Market - Pricing Analysis

7. Global Market Demand (in Value or Size in US$ Million) Analysis 2018 to 2022 and Forecast, 2023 to 2033

    7.1. Historical Market Value (US$ Million) Analysis, 2018 to 2022

    7.2. Current and Future Market Value (US$ Million) Projections, 2023 to 2033

        7.2.1. Y-o-Y Growth Trend Analysis

        7.2.2. Absolute $ Opportunity Analysis

8. Market Background

    8.1. Macro-Economic Factors

        8.1.1. Global Economic Outlook

        8.1.2. Global GDP Growth Outlook

        8.1.3. Industry Value Added By Key Countries

        8.1.4. Manufacturing Value Added by Key Countries

        8.1.5. Global Hospitality Industry Overview

        8.1.6. Global Food and Beverages Industry Outlook

        8.1.7. Others

    8.2. Forecast Factors - Relevance & Impact

        8.2.1. Top Companies Historical Growth

        8.2.2. GDP Growth forecast

        8.2.3. Population Growth Outlook

        8.2.4. Business Climate

        8.2.5. Others

    8.3. Value Chain Analysis

        8.3.1. List of Suppliers

        8.3.2. List of Distributors and Traders

        8.3.3. List of End Users

    8.4. COVID-19 Crisis - Impact Assessment

        8.4.1. Current Statistics

        8.4.2. COVID-19 Impact On the Market

        8.4.3. COVID-19: Rebound Scenario - FMI Perspective

        8.4.4. Key Factors for the Market Participants to Over Come COVID-19 Impact

    8.5. Market Dynamics

        8.5.1. Drivers

        8.5.2. Restraints

        8.5.3. Opportunity Analysis

9. Global Market Analysis 2018 to 2022 and Forecast 2023 to 2033, by Product Type

    9.1. Introduction / Key Findings

    9.2. Historical Market Size (US$ Million) and Volume Analysis By Product Type, 2018 to 2022

    9.3. Current and Future Market Size (US$ Million) and Volume Analysis and Forecast By Product Type, 2023 to 2033

        9.3.1. Full Automatic

        9.3.2. Semi-Automatic

    9.4. Market Attractiveness Analysis By Product Type

10. Global Market Analysis 2018 to 2022 and Forecast 2023 to 2033, By Type

    10.1. Introduction / Key Findings

    10.2. Historical Market Size (US$ Million) and Volume Analysis By Product Type, 2018 to 2022

    10.3. Current and Future Market Size (US$ Million) and Volume Analysis and Forecast By Type, 2023 to 2033

        10.3.1. Electric

        10.3.2. Gas

    10.4. Market Attractiveness Analysis By Type

11. Global Market Analysis 2018 to 2022 and Forecast 2023 to 2033, By Burner Type

    11.1. Introduction / Key Findings

    11.2. Historical Market Size (US$ Million) and Volume Analysis By Burner Type, 2018 to 2022

    11.3. Current and Future Market Size (US$ Million) and Volume Analysis and Forecast By Burner Type, 2023 to 2033

        11.3.1. 1 Burner

        11.3.2. 2 Burner

        11.3.3. 3 Burner

        11.3.4. 4 Burner

        11.3.5. 5 Burner

        11.3.6. Others

    11.4. Market Attractiveness Analysis By Burner Type

12. Global Market Analysis 2018 to 2022 and Forecast 2023 to 2033, By Application

    12.1. Introduction / Key Findings

    12.2. Historical Market Size (US$ Million) and Volume Analysis By Application, 2018 to 2022

    12.3. Current and Future Market Size (US$ Million) and Volume Analysis and Forecast By Application, 2023 to 2033

        12.3.1. Full-Service Restaurants

        12.3.2. Quick Service Restaurants

        12.3.3. Hotels

        12.3.4. Others

    12.4. Market Attractiveness Analysis By Application

13. Global Market Analysis 2018 to 2022 and Forecast 2023 to 2033, by Region

    13.1. Introduction

    13.2. Historical Market Size (US$ Million) and Volume Analysis By Region, 2018 to 2022

    13.3. Current Market Size (US$ Million) and Volume Analysis and Forecast By Region, 2023 to 2033

        13.3.1. North America

        13.3.2. Latin America

        13.3.3. Europe

        13.3.4. South Asia and Pacific

        13.3.5. East Asia

        13.3.6. Middle East & Africa

    13.4. Market Attractiveness Analysis By Region

14. North America Market Analysis 2018 to 2022 and Forecast 2023 to 2033

    14.1. Introduction

    14.2. Pricing Analysis

    14.3. Historical Market Size (US$ Million) and Volume Trend Analysis By Market Taxonomy, 2018 to 2022

    14.4. Market Size (US$ Million) and Volume Forecast By Market Taxonomy, 2023 to 2033

        14.4.1. By Country

            14.4.1.1. United States of America

            14.4.1.2. Canada

        14.4.2. By Product Type

        14.4.3. By Type

        14.4.4. By Burner Type

        14.4.5. By Application

    14.5. Market Attractiveness Analysis

        14.5.1. By Country

        14.5.2. By Product Type

        14.5.3. By Type

        14.5.4. By Burner Type

        14.5.5. By Application

15. Latin America Market Analysis 2018 to 2022 and Forecast 2023 to 2033

    15.1. Introduction

    15.2. Pricing Analysis

    15.3. Historical Market Size (US$ Million) and Volume Trend Analysis By Market Taxonomy, 2018 to 2022

    15.4. Market Size (US$ Million) and Volume Forecast By Market Taxonomy, 2023 to 2033

        15.4.1. By Country

            15.4.1.1. Brazil

            15.4.1.2. Mexico

            15.4.1.3. Rest of Latin America

        15.4.2. By Product Type

        15.4.3. By Type

        15.4.4. By Burner Type

        15.4.5. By Application

    15.5. Market Attractiveness Analysis

        15.5.1. By Country

        15.5.2. By Product Type

        15.5.3. By Type

        15.5.4. By Burner Type

        15.5.5. By Application

16. Europe Market Analysis 2018 to 2022 and Forecast 2023 to 2033

    16.1. Introduction

    16.2. Pricing Analysis

    16.3. Historical Market Size (US$ Million) and Volume Trend Analysis By Market Taxonomy, 2018 to 2022

    16.4. Market Size (US$ Million) and Volume Forecast By Market Taxonomy, 2023 to 2033

        16.4.1. By Country

            16.4.1.1. Germany

            16.4.1.2. Italy

            16.4.1.3. France

            16.4.1.4. United Kingdom

            16.4.1.5. Spain

            16.4.1.6. BENELUX

            16.4.1.7. NORDICS

            16.4.1.8. Russia

            16.4.1.9. Rest of Europe

        16.4.2. By Product Type

        16.4.3. By Type

        16.4.4. By Burner Type

        16.4.5. By Application

    16.5. Market Attractiveness Analysis

        16.5.1. By Country

        16.5.2. By Product Type

        16.5.3. By Type

        16.5.4. By Burner Type

        16.5.5. By Application

17. South Asia and Pacific Market Analysis 2018 to 2022 and Forecast 2023 to 2033

    17.1. Introduction

    17.2. Pricing Analysis

    17.3. Historical Market Size (US$ Million) and Volume Trend Analysis By Market Taxonomy, 2018 to 2022

    17.4. Market Size (US$ Million) and Volume Forecast By Market Taxonomy, 2023 to 2033

        17.4.1. By Country

            17.4.1.1. India

            17.4.1.2. ASEAN

            17.4.1.3. Oceania

            17.4.1.4. Rest of South Asia and Pacific

        17.4.2. By Product Type

        17.4.3. By Type

        17.4.4. By Burner Type

        17.4.5. By Application

    17.5. Market Attractiveness Analysis

        17.5.1. By Country

        17.5.2. By Product Type

        17.5.3. By Type

        17.5.4. By Burner Type

        17.5.5. By Application

18. East Asia Market Analysis 2018 to 2022 and Forecast 2023 to 2033

    18.1. Introduction

    18.2. Pricing Analysis

    18.3. Historical Market Size (US$ Million) and Volume Trend Analysis By Market Taxonomy, 2018 to 2022

    18.4. Market Size (US$ Million) and Volume Forecast By Market Taxonomy, 2023 to 2033

        18.4.1. By Country

            18.4.1.1. China

            18.4.1.2. Japan

            18.4.1.3. South Korea

        18.4.2. By Product Type

        18.4.3. By Type

        18.4.4. By Burner Type

        18.4.5. By Application

    18.5. Market Attractiveness Analysis

        18.5.1. By Country

        18.5.2. By Product Type

        18.5.3. By Type

        18.5.4. By Burner Type

        18.5.5. By Application

19. Middle East and Africa Market Analysis 2018 to 2022 and Forecast 2023 to 2033

    19.1. Introduction

    19.2. Pricing Analysis

    19.3. Historical Market Size (US$ Million) and Volume Trend Analysis By Market Taxonomy, 2018 to 2022

    19.4. Market Size (US$ Million) and Volume Forecast By Market Taxonomy, 2023 to 2033

        19.4.1. By Country

            19.4.1.1. GCC Countries

            19.4.1.2. Turkey

            19.4.1.3. Northern Africa

            19.4.1.4. South Africa

            19.4.1.5. Rest of Middle East and Africa

        19.4.2. By Product Type

        19.4.3. By Type

        19.4.4. By Burner Type

        19.4.5. By Application

    19.5. Market Attractiveness Analysis

        19.5.1. By Country

        19.5.2. By Product Type

        19.5.3. By Type

        19.5.4. By Burner Type

        19.5.5. By Application

20. Key and Emerging Countries Market Analysis

    20.1. Introduction

        20.1.1. Market Value Proportion Analysis, By Key Countries

        20.1.2. Global Vs. Country Growth Comparison

    20.2. USA Market Analysis

        20.2.1. By Product Type

        20.2.2. By Type

        20.2.3. By Burner Type

        20.2.4. By Application

    20.3. Canada Market Analysis

        20.3.1. By Product Type

        20.3.2. By Type

        20.3.3. By Burner Type

        20.3.4. By Application

    20.4. Mexico Market Analysis

        20.4.1. By Product Type

        20.4.2. By Type

        20.4.3. By Burner Type

        20.4.4. By Application

    20.5. Brazil Market Analysis

        20.5.1. By Product Type

        20.5.2. By Type

        20.5.3. By Burner Type

        20.5.4. By Application

    20.6. Germany Market Analysis

        20.6.1. By Product Type

        20.6.2. By Type

        20.6.3. By Burner Type

        20.6.4. By Application

    20.7. Italy Market Analysis

        20.7.1. By Product Type

        20.7.2. By Type

        20.7.3. By Burner Type

        20.7.4. By Application

    20.8. France Market Analysis

        20.8.1. By Product Type

        20.8.2. By Type

        20.8.3. By Burner Type

        20.8.4. By Application

    20.9. United Kingdom Market Analysis

        20.9.1. By Product Type

        20.9.2. By Type

        20.9.3. By Burner Type

        20.9.4. By Application

    20.10. Spain Market Analysis

        20.10.1. By Product Type

        20.10.2. By Type

        20.10.3. By Burner Type

        20.10.4. By Application

    20.11. Russia Market Analysis

        20.11.1. By Product Type

        20.11.2. By Type

        20.11.3. By Burner Type

        20.11.4. By Application

    20.12. China Market Analysis

        20.12.1. By Product Type

        20.12.2. By Type

        20.12.3. By Burner Type

        20.12.4. By Application

    20.13. Japan Market Analysis

        20.13.1. By Product Type

        20.13.2. By Type

        20.13.3. By Burner Type

        20.13.4. By Application

    20.14. S. Korea Market Analysis

        20.14.1. By Product Type

        20.14.2. By Type

        20.14.3. By Burner Type

        20.14.4. By Application

    20.15. India Market Analysis

        20.15.1. By Product Type

        20.15.2. By Type

        20.15.3. By Burner Type

        20.15.4. By Application

    20.16. ASEAN Market Analysis

        20.16.1. By Product Type

        20.16.2. By Type

        20.16.3. By Burner Type

        20.16.4. By Application

    20.17. Oceania Market Analysis

        20.17.1. By Product Type

        20.17.2. By Type

        20.17.3. By Burner Type

        20.17.4. By Application

    20.18. GCC Market Analysis

        20.18.1. By Product Type

        20.18.2. By Type

        20.18.3. By Burner Type

        20.18.4. By Application

    20.19. Turkey Market Analysis

        20.19.1. By Product Type

        20.19.2. By Type

        20.19.3. By Burner Type

        20.19.4. By Application

    20.20. South Africa Market Analysis

        20.20.1. By Product Type

        20.20.2. By Type

        20.20.3. By Burner Type

        20.20.4. By Application

21. Market Structure Analysis

    21.1. Key Players - Market Positioning

    21.2. Market Concentration by Leading Players

    21.3. Market Tier Structure Analysis

    21.4. Market Share Analysis of Top Players

    21.5. Market Presence Analysis

        21.5.1. By Regional Footprint

        21.5.2. By Product Footprint

22. Competition Analysis

    22.1. Competition Dashboard

    22.2. Competition Deep Dive

        22.2.1. Spinning Grillers

            22.2.1.1. Overview

            22.2.1.2. Product Portfolio

            22.2.1.3. Sales Footprint

            22.2.1.4. Strategy Overview

        22.2.2. Arican Industrial Kitchen

            22.2.2.1. Overview

            22.2.2.2. Product Portfolio

            22.2.2.3. Sales Footprint

            22.2.2.4. Strategy Overview

        22.2.3. Siberian Refrigeration LLP

            22.2.3.1. Overview

            22.2.3.2. Product Portfolio

            22.2.3.3. Sales Footprint

            22.2.3.4. Strategy Overview

        22.2.4. Bharti Refrigeration Works

            22.2.4.1. Overview

            22.2.4.2. Product Portfolio

            22.2.4.3. Sales Footprint

            22.2.4.4. Strategy Overview

        22.2.5. CKE Kitchen Equipment

            22.2.5.1. Overview

            22.2.5.2. Product Portfolio

            22.2.5.3. Sales Footprint

            22.2.5.4. Strategy Overview

        22.2.6. Delight Kitchens

            22.2.6.1. Overview

            22.2.6.2. Product Portfolio

            22.2.6.3. Sales Footprint

            22.2.6.4. Strategy Overview

        22.2.7. Ital Kitchen Equipment

            22.2.7.1. Overview

            22.2.7.2. Product Portfolio

            22.2.7.3. Sales Footprint

            22.2.7.4. Strategy Overview

        22.2.8. ROLLER GRILL INTERNATIONAL S.A.S

            22.2.8.1. Overview

            22.2.8.2. Product Portfolio

            22.2.8.3. Sales Footprint

            22.2.8.4. Strategy Overview

        22.2.9. Akasa International

            22.2.9.1. Overview

            22.2.9.2. Product Portfolio

            22.2.9.3. Sales Footprint

            22.2.9.4. Strategy Overview

        22.2.10. Bresco

            22.2.10.1. Overview

            22.2.10.2. Product Portfolio

            22.2.10.3. Sales Footprint

            22.2.10.4. Strategy Overview

23. Assumptions and Acronyms Used

24. Research Methodology

List of Tables

Table 01: Global Market Value (US$ Million) & Volume (units) Historical Data 2018 to 2022 and Forecast 2023 to 2033 By Product Type

Table 02: Global Market Value (US$ Million) & Volume (units) Historical Data 2018 to 2022 and Forecast 2023 to 2033 By Model

Table 03: Global Market Value (US$ Million) & Volume (units) Historical Data 2018 to 2022 and Forecast 2023 to 2033 By End Users

Table 04: Global Market Value (US$ Million) & Volume (units) Historical Data 2018 to 2022 and Forecast 2023 to 2033 By Distribution Channel

Table 05: Global Market Value (US$ Million) & Volume (units) Historical Data 2018 to 2022 and Forecast 2023 to 2033 By Region

Table 06: North America Market Value (US$ Million) & Volume (units) Historical Data 2018 to 2022 and Forecast 2023 to 2033 By Country

Table 07: North America Market Value (US$ Million) & Volume (units) Historical Data 2018 to 2022 and Forecast 2023 to 2033 By Product Type

Table 08: North America Market Value (US$ Million) & Volume (units) Historical Data 2018 to 2022 and Forecast 2023 to 2033 By Model

Table 09: North America Market Value (US$ Million) & Volume (units) Historical Data 2018 to 2022 and Forecast 2023 to 2033 By End Users

Table 10: North America Market Value (US$ Million) & Volume (units) Historical Data 2018 to 2022 and Forecast 2023 to 2033 By Distribution Channel

Table 11: Latin America Market Value (US$ Million) & Volume (units) Historical Data 2018 to 2022 and Forecast 2023 to 2033 By Country

Table 12: Latin America Market Value (US$ Million) & Volume (units) Historical Data 2018 to 2022 and Forecast 2023 to 2033 By Product Type

Table 13: Latin America Market Value (US$ Million) & Volume (units) Historical Data 2018 to 2022 and Forecast 2023 to 2033 By Model

Table 14: Latin America Market Value (US$ Million) & Volume (units) Historical Data 2018 to 2022 and Forecast 2023 to 2033 By End Users

Table 15: Latin America Market Value (US$ Million) & Volume (units) Historical Data 2018 to 2022 and Forecast 2023 to 2033 By Distribution Channel

Table 16: Europe Market Value (US$ Million) & Volume (units) Historical Data 2018 to 2022 and Forecast 2023 to 2033 By Country

Table 17: Europe Market Value (US$ Million) & Volume (units) Historical Data 2018 to 2022 and Forecast 2023 to 2033 By Product Type

Table 18: Europe Market Value (US$ Million) & Volume (units) Historical Data 2018 to 2022 and Forecast 2023 to 2033 By Model

Table 19: Europe Market Value (US$ Million) & Volume (units) Historical Data 2018 to 2022 and Forecast 2023 to 2033 By End Users

Table 20: Europe Market Value (US$ Million) & Volume (units) Historical Data 2018 to 2022 and Forecast 2023 to 2033 By Distribution Channel

Table 21: East Asia Market Value (US$ Million) & Volume (units) Historical Data 2018 to 2022 and Forecast 2023 to 2033 By Country

Table 22: East Asia Market Value (US$ Million) & Volume (units) Historical Data 2018 to 2022 and Forecast 2023 to 2033 By Product Type

Table 23: East Asia Market Value (US$ Million) & Volume (units) Historical Data 2018 to 2022 and Forecast 2023 to 2033 By Model

Table 24: East Asia Market Value (US$ Million) & Volume (units) Historical Data 2018 to 2022 and Forecast 2023 to 2033 By End Users

Table 25: East Asia Market Value (US$ Million) & Volume (units) Historical Data 2018 to 2022 and Forecast 2023 to 2033 By Distribution Channel

Table 26: South Asia & Pacific Market Value (US$ Million) & Volume (units) Historical Data 2018 to 2022 and Forecast 2023 to 2033 By Country

Table 27: South Asia & Pacific Market Value (US$ Million) & Volume (units) Historical Data 2018 to 2022 and Forecast 2023 to 2033 By Product Type

Table 28: South Asia & Pacific Market Value (US$ Million) & Volume (units) Historical Data 2018 to 2022 and Forecast 2023 to 2033 By Model

Table 29: South Asia & Pacific Market Value (US$ Million) & Volume (units) Historical Data 2018 to 2022 and Forecast 2023 to 2033 By End Users

Table 30: South Asia & Pacific Market Value (US$ Million) & Volume (units) Historical Data 2018 to 2022 and Forecast 2023 to 2033 By Distribution Channel

Table 31: Middle East & Africa Market Value (US$ Million) & Volume (units) Historical Data 2018 to 2022 and Forecast 2023 to 2033 By Country

Table 32: Middle East & Africa Market Value (US$ Million) & Volume (units) Historical Data 2018 to 2022 and Forecast 2023 to 2033 By Product Type

Table 33: Middle East & Africa Market Value (US$ Million) & Volume (units) Historical Data 2018 to 2022 and Forecast 2023 to 2033 By Model

Table 34: Middle East & Africa Market Value (US$ Million) & Volume (units) Historical Data 2018 to 2022 and Forecast 2023 to 2033 By End Users

Table 35: Middle East & Africa Market Value (US$ Million) & Volume (units) Historical Data 2018 to 2022 and Forecast 2023 to 2033 By End Use

List of Charts

Figure 01: Global Volume (Units) and Y-o-Y Growth Rate From 2023 to 2033

Figure 02: Global Value (US$ Million) and Y-o-Y Growth Rate From 2023 to 2033

Figure 03: Global Absolute $ Opportunity Analysis, 2023 to 2033

Figure 04: Global Share and BPS Analysis By Product Type- 2023 to 2033

Figure 05: Global Y-o-Y Growth By Product Type, 2023 to 2033

Figure 06: Global Attractiveness Analysis By Product Type, 2023 to 2033

Figure 07: Global Market Incremental $ Opportunity By Product Type, 2023 to 2033

Figure 08: Global Share and BPS Analysis By Type- 2023 to 2033

Figure 09: Global Y-o-Y Growth By Type, 2023 to 2033

Figure 10: Global Attractiveness Analysis By Type, 2023 to 2033

Figure 11: Global Market Incremental $ Opportunity By Type, 2023 to 2033

Figure 12: Global Share and BPS Analysis By Burner Type- 2023 to 2033

Figure 13: Global Y-o-Y Growth By Burner Type, 2023 to 2033

Figure 14: Global Attractiveness Analysis By Burner Type, 2023 to 2033

Figure 15: Global Market Incremental $ Opportunity By Burner Type, 2023 to 2033

Figure 16: Global Share and BPS Analysis By Application- 2023 to 2033

Figure 17: Global Y-o-Y Growth By Application, 2023 to 2033

Figure 18: Global Attractiveness Analysis By Application, 2023 to 2033

Figure19: Global Market Incremental $ Opportunity By Application, 2023 to 2033

Figure 20: Global Share and BPS Analysis By Region - 2023 to 2033

Figure 21: Global Y-o-Y Growth By Region, 2023 to 2033

Figure 22: Global Attractiveness Analysis By Region, 2023 to 2033

Figure 23: Global Market Incremental $ Opportunity By Region, 2023 to 2033

Figure 24: North America Share and BPS Analysis By Country - 2023 to 2033

Figure 25: North America Y-o-Y Growth By Country, 2023 to 2033

Figure 26: North America Attractiveness Analysis By Country, 2023 to 2033

Figure 27: North America Market Incremental $ Opportunity By Country, 2023 to 2033

Figure 28: North America Share and BPS Analysis By Product Type- 2023 to 2033

Figure 29: North America Y-o-Y Growth By Product Type, 2023 to 2033

Figure 30: North America Attractiveness Analysis By Product Type, 2023 to 2033

Figure 31: North America Share and BPS Analysis By Type- 2023 to 2033

Figure 32: North America Y-o-Y Growth By Type, 2023 to 2033

Figure 33: North America Attractiveness Analysis By Type, 2023 to 2033

Figure 34: North America Share and BPS Analysis By Burner Type- 2023 to 2033

Figure 35: North America Y-o-Y Growth By Burner Type, 2023 to 2033

Figure 36: North America Attractiveness Analysis By Burner Type, 2023 to 2033

Figure 37: North America Share and BPS Analysis By Application- 2023 to 2033

Figure 38: North America Y-o-Y Growth By Application, 2023 to 2033

Figure 39: North America Attractiveness Analysis By Application, 2023 to 2033

Figure 40: Latin America Share and BPS Analysis By Country - 2023 to 2033

Figure 41: Latin America Y-o-Y Growth By Country, 2023 to 2033

Figure 42: Latin America Attractiveness Analysis By Country, 2023 to 2033

Figure 43: Latin America Market Incremental $ Opportunity By Country, 2023 to 2033

Figure 44: Latin America Share and BPS Analysis By Product Type- 2023 to 2033

Figure 45: Latin America Y-o-Y Growth By Product Type, 2023 to 2033

Figure 46: Latin America Attractiveness Analysis By Product Type, 2023 to 2033

Figure 47: Latin America Share and BPS Analysis By Type- 2023 to 2033

Figure 48: Latin America Y-o-Y Growth By Type, 2023 to 2033

Figure 49: Latin America Attractiveness Analysis By Type, 2023 to 2033

Figure 50: Latin America Share and BPS Analysis By Burner Type- 2023 to 2033

Figure 51: Latin America Y-o-Y Growth By Burner Type, 2023 to 2033

Figure 52: Latin America Attractiveness Analysis By Burner Type, 2023 to 2033

Figure 53: Latin America Share and BPS Analysis By Application- 2023 to 2033

Figure 54: Latin America Y-o-Y Growth By Application, 2023 to 2033

Figure 55: Latin America Attractiveness Analysis By Application, 2023 to 2033

Figure 56: Europe Share and BPS Analysis By Country - 2023 to 2033

Figure 57: Europe Y-o-Y Growth By Country, 2023 to 2033

Figure 58: Europe Attractiveness Analysis By Country, 2023 to 2033

Figure 59: Europe Market Incremental $ Opportunity By Country, 2023 to 2033

Figure 60: Europe Share and BPS Analysis By Product Type- 2023 to 2033

Figure 61: Europe Y-o-Y Growth By Product Type, 2023 to 2033

Figure 62: Europe Attractiveness Analysis By Product Type, 2023 to 2033

Figure 63: Europe Share and BPS Analysis By Type- 2023 to 2033

Figure 64: Europe Y-o-Y Growth By Type, 2023 to 2033

Figure 65: Europe Attractiveness Analysis By Type, 2023 to 2033

Figure 66: Europe Share and BPS Analysis By Burner Type- 2023 to 2033

Figure 67: Europe Y-o-Y Growth By Burner Type, 2023 to 2033

Figure 68: Europe Attractiveness Analysis By Burner Type, 2023 to 2033

Figure 69: Europe Share and BPS Analysis By Application- 2023 to 2033

Figure 70: Europe Y-o-Y Growth By Application, 2023 to 2033

Figure 71: Europe Attractiveness Analysis By Application, 2023 to 2033

Figure 72: East Asia Share and BPS Analysis By Country - 2023 to 2033

Figure 73: East Asia Y-o-Y Growth By Country, 2023 to 2033

Figure 74: East Asia Attractiveness Analysis By Country, 2023 to 2033

Figure 75: East Asia Market Incremental $ Opportunity By Country, 2023 to 2033

Figure 76: East Asia Share and BPS Analysis By Product Type- 2023 to 2033

Figure 77: East Asia Y-o-Y Growth By Product Type, 2023 to 2033

Figure 78: East Asia Attractiveness Analysis By Product Type, 2023 to 2033

Figure 79: East Asia Share and BPS Analysis By Type- 2023 to 2033

Figure 80: East Asia Y-o-Y Growth By Type, 2023 to 2033

Figure 81: East Asia Attractiveness Analysis By Type, 2023 to 2033

Figure 82: East Asia Share and BPS Analysis By Burner Type- 2023 to 2033

Figure 83: East Asia Y-o-Y Growth By Burner Type, 2023 to 2033

Figure 84: East Asia Attractiveness Analysis By Burner Type, 2023 to 2033

Figure 85: East Asia Share and BPS Analysis By Application- 2023 to 2033

Figure 86: East Asia Y-o-Y Growth By Application, 2023 to 2033

Figure 87: East Asia Attractiveness Analysis By Application, 2023 to 2033

Figure 88: South Asia & Pacific Share and BPS Analysis By Country - 2023 to 2033

Figure 89: South Asia & Pacific Y-o-Y Growth By Country, 2023 to 2033

Figure 90: South Asia & Pacific Attractiveness Analysis By Country, 2023 to 2033

Figure 91: South Asia & Pacific Market Incremental $ Opportunity By Country, 2023 to 2033

Figure 92: South Asia & Pacific Share and BPS Analysis By Product Type- 2023 to 2033

Figure 93: South Asia & Pacific Y-o-Y Growth By Product Type, 2023 to 2033

Figure 94: South Asia & Pacific Attractiveness Analysis By Product Type, 2023 to 2033

Figure 95: South Asia & Pacific Share and BPS Analysis By Type- 2023 to 2033

Figure 96: South Asia & Pacific Y-o-Y Growth By Type, 2023 to 2033

Figure 97: South Asia & Pacific Attractiveness Analysis By Type, 2023 to 2033

Figure 98: South Asia & Pacific Share and BPS Analysis By Burner Type- 2023 to 2033

Figure 99: South Asia & Pacific Y-o-Y Growth By Burner Type, 2023 to 2033

Figure 100: South Asia & Pacific Attractiveness Analysis By Burner Type, 2023 to 2033

Figure 101: South Asia & Pacific Share and BPS Analysis By Application- 2023 to 2033

Figure 102: South Asia & Pacific Y-o-Y Growth By Application, 2023 to 2033

Figure 103: South Asia & Pacific Attractiveness Analysis By Application, 2023 to 2033

Figure 104: Middle East & Africa Share and BPS Analysis By Country - 2023 to 2033

Figure 105: Middle East & Africa Y-o-Y Growth By Country, 2023 to 2033

Figure 106: Middle East & Africa Attractiveness Analysis By Country, 2023 to 2033

Figure 107: Middle East & Africa Market Incremental $ Opportunity By Country, 2023 to 2033

Figure 108: Middle East & Africa Share and BPS Analysis By Product Type- 2023 to 2033

Figure 109: Middle East & Africa Y-o-Y Growth By Product Type, 2023 to 2033

Figure 110: Middle East & Africa Attractiveness Analysis By Product Type, 2023 to 2033

Figure 111: Middle East & Africa Share and BPS Analysis By Type- 2023 to 2033

Figure 112: Middle East & Africa Y-o-Y Growth By Type, 2023 to 2033

Figure 113: Middle East & Africa Attractiveness Analysis By Type, 2023 to 2033

Figure 114: Middle East & Africa Share and BPS Analysis By Burner Type- 2023 to 2033

Figure 115: Middle East & Africa Y-o-Y Growth By Burner Type, 2023 to 2033

Figure 116: Middle East & Africa Attractiveness Analysis By Burner Type, 2023 to 2033

Figure 117: Middle East & Africa Share and BPS Analysis By Application- 2023 to 2033

Figure 118: Middle East & Africa Y-o-Y Growth By Application, 2023 to 2033

Figure 119: Middle East & Africa Attractiveness Analysis By Application, 2023 to 2033

Explore Process Automation Insights

View Reports

Shawarma Grill Machine Market