Reports

- Global Locations -

Headquarters

Future Market Insights, Inc.

Christiana Corporate, 200
Continental Drive, Suite 401,
Newark, Delaware - 19713,
United States

T: +1-347-918-3531

Americas

Future Market Insights, Inc.

616 Corporate Way, Suite 2-9018,
Valley Cottage, NY 10989, United States

MEA

Future Market Insights

1602-6 Jumeirah Bay X2 Tower, Plot No: JLT-PH2-X2A,
Jumeirah Lakes Towers, Dubai,
United Arab Emirates

Europe

Future Market Insights

3rd Floor, 207 Regent Street,
W1B 3HH London
United Kingdom

T: + 44 (0) 20 8123 9659

Asia Pacific

Future Market Insights

IndiaLand Global Tech Park, Unit UG-1, Behind Grand HighStreet, Phase 1, Hinjawadi, MH, Pune – 411057, India

A Summary of Commercial Burger Grills Market Development (2023 to 2033)

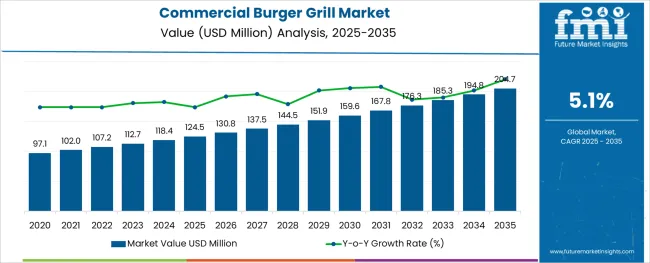
The global commercial burger grill market is projected to have a moderate-paced CAGR of 5.1% during the forecast period. The current valuation of the market is US$ 112.7 million in 2023. The market value of the commercial burger grill market is anticipated to reach a high of US$ 184.6 million by the year 2033. A historical market valuation of US$ 65.3 million has been recorded by the experts of Future Market Insights for the concerned market during the base year. This growth is supported by:

  • Commercial burger grills impart a distinctive flavor to the meat patty with the help of direct heat which is highly preferred by the urban population.
  • The preference of consumers to add authentic coal flavor to the burgers is likely to drive the sales of the coal burger grills.
  • Restaurants and food outlets are passionately adding varied tastes and flavors to their savories and this food trend is gaining quite a traction, positively impacting the market.
  • Commercial burger grills are providing high flexibility with a quick and easy solution for grilled meat lovers.
  • The rising per capita income of the population in developing countries is making them inclined towards more consumption of fast food, coupled with a surge in the millennial populace that is fond of exploring the gastronomical voyage.
  • Advancement of technology and its implication in commercial burger grills like spot-on technology, by which the grills get activated as soon as the burgers are kept on it.
  • Commercial burger grills are equipped with power saver mode and after the set time it switches to that mode, saving on electricity requirement. These features are propelling the sale of commercial burger grills in 2023.

Although the market is witnessed to have healthy growth, the expert analysts at Future Market Insights have identified that certain elements prevailing in the market are likely to curb the growth of the forum in the long run. The restraining factors identified are:

  • Grilling food or meat patties at high temperatures is associated with a chemical reaction that is harmful and is likely to exert a negative influence on the market growth through 2033.
  • Meat in its grilled form possesses a cancer-potent chemical and this health risk is expected to push away potential customers away from grilled food, which is anticipated to cut down the sale of commercial burger grills in the forthcoming years.
  • The appliance is difficult to clean and is likely to hamper the product demand during the period 2023 to 2033.
Report Attribute Details
Commercial Burger Grill Market Value (2023) US$ 112.7 million
Commercial Burger Grill Market Anticipated Value (2033) US$ 184.6 million
Commercial Burger Grill Projected Growth Rate (2023 to 2033) 5.1%

Don't pay for what you don't need

Customize your report by selecting specific countries or regions and save 30%!

Smoky Flavors Flabbergast Consumers and Flourish Market

FMI has analyzed that there is a rise in the number of food joints and fast-food restaurants across the globe, which is driving the market share for commercial burger grills. A surge in the number of quick-service restaurants, coffee shops, and cafes is bolstering the demand for continental food like sausage pepper burgers, grilled ham, her & bacon scones, and more, thereby driving food joints to purchase commercial burger grills.

Commercial burger grill manufacturers are offering user-friendly grills that cook fast and are easy to use. The demand for smart burger grills is also high in the market and consumers are relishing the smoky flavor of grilled patties in burgers, fueling market growth for the appliance.

A Contrast with the Historical Market Scenario

After analyzing the market in-depth, the experts of FMI have unveiled that the commercial burger grill market has been witnessing an unprecedented surge in the past few years. There is an approximate rise of US$ 119.2 million surge in the total market value from 2022 to 2023. The market during the period 2018 to 2023 registered a CAGR of 3.7%.

The growth of the market can be attributed to the introduction of the latest technologies like energy-efficient commercial burger grills and smart grill machines that are revolutionizing the landscape of kitchen appliances. Besides, the flourishing quick-service restaurant industry has been on a spike and has unraveled immense opportunities for the players. Reinforcement of purchasing power due to the rise in disposable income and the trend of consuming fast food by the younger generation augment the growth of the charcoal chicken grill machine and the commercial burger grill market.

In addition to that, the products can be integrated with smartphones and other connected devices, which acts as a key aspect in propelling the growth of the market in recent years.

Nandini Roy Choudhury

Principal Consultant

Talk to Analyst

Find your sweet spots for generating winning opportunities in this market.

Comparative Analysis of Adjacent Markets

Commercial Burger Grill Market:

Differentiating Aspects Commercial Burger Grill Market
CAGR 5.1%
Market Valuation in 2023 US$ 112.7 Million
Projected Market Value in 2033 US$ 184.6 Million
Drivers
  • Burgers are an ideal breakfast meal across the globe in school and college canteens, which is anticipated to fuel the growth of the commercial burger grill market through 2033.
  • The urban population is fond of grilled meat flavors due to their smoky essence and slow-cooked tenderness, bolstering sales of commercial burger grills through the forecast period.

Barbeque Grill Machine Market:

Differentiating Aspects Barbeque Grill Machine Market
CAGR 4.5%
Market Valuation in 2023 US$ 951.79 Million
Projected Market Value in 2033 US$ 1,478.09 Million
Drivers
  • Preferences of individuals to have outside gatherings and picnics are anticipated to fuel the market shares for commercial barbeque grill machines.
  • The rising disposable income of the populace across the developing economies is influencing food habits and is therefore raising the adoption of barbeque grill machines, favoring the rising consumption of meat-based food items.

Shawarma Grill Machine Market:

Differentiating Aspects Shawarma Grill Machine Market
CAGR 6.7%
Market Valuation in 2023 US$ 554.2 Million
Projected Market Value in 2033 US$ 1,060.1 Million
Drivers
  • The surge in the dine-out lifestyle fuels the consumption of Lebanese food like shawarma, elevating market shares for shawarma grill machines.
  • Smoky flavors imparted to the savory with grill machines are largely preferred by consumers, thereby bolstering sales for the machines.

Category-wise Insights

A Glance of the Influential Segments in the Commercial Burger Grill Market

Charbroilers - By Product Type

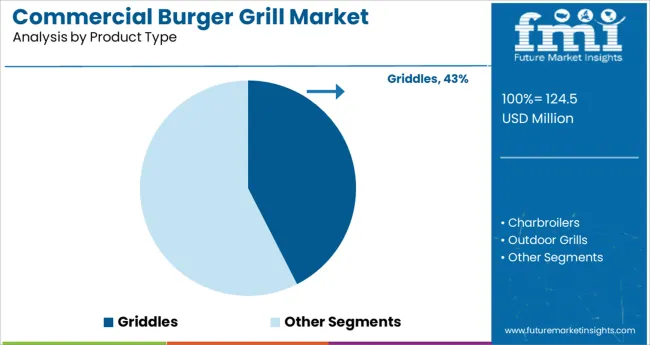
The expert analysts at FMI have identified that the charbroiler segment is likely to gain momentum and exert dominance throughout the forecast period. This product type category is expected to advance at an average-paced CAGR of 5.5% during the projection period and has recorded a historical CAGR of 4.9% during the period 2018 to 2022. The factors attributing to the growth of this segment are:

  • Charbroilers allow the grilling of a variety of food at the same time, changing the appearance of the food along with a positive impact on the flavor of the meat patties for burgers, which are highly favored by consumers.
  • It cooks more substantial qualities of food, operating on a gas flame. Commercial kitchens offer a high production level with a shorter recovery time.
  • They are ideal choices for outdoor backyard barbeques and more, coupled with targeted heat control that ensures heat is focused toward the cooking area.

Restaurant & Cafes - By End-user

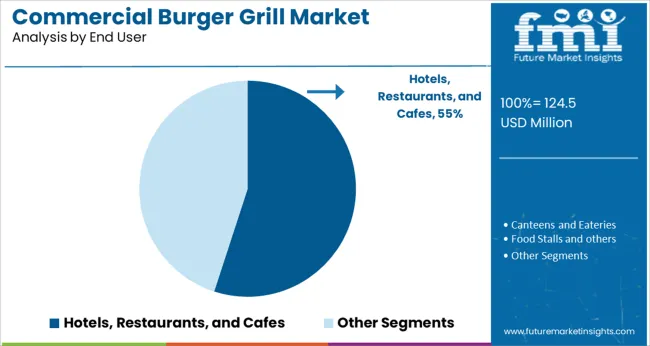
Future Market Insights have analyzed that the restaurant and café sector is likely to turn out as the domineering segment through the forecast period. It is estimated that this end-user segment is likely to register a steady pace of growth, with a 4.6% CAGR through 2033. A historical CAGR of 3.0% has been recorded by this segment during the base year. The factors contributing to the growth of this segment are as follows:
  • There is an improvement in speed and accuracy in burger production with the commercial burger grills in the restaurant sector.
  • Commercial burger grill machines can form patties quickly in restaurants and cafes with minimal fuss and are ideal for busy food outlets.
  • The consistent shape and size of the burgers that are produced by a forming machine that they get cooked evenly and look professional, which is further fueling the adoption of commercial burger grills, boosting the commercial burger grill market growth in this end-use industry.

Get the data you need at a Fraction of the cost

Personalize your report by choosing insights you need
and save 40%!

Country-wise Insights

Reduced Risk of Cross-contamination & Cleaning Up Made Simple with Commercial Burger Grills Across Countries

Country United States of America
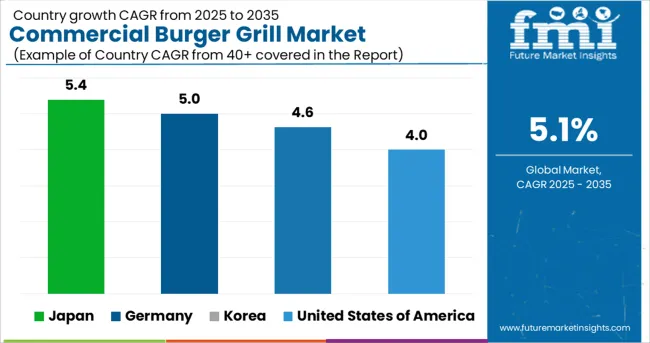
Statistics The USA commercial burger grill market is expected to be one of the fastest-growing markets for these appliances over the next decade. By the end of the forecast period, the market is projected to surpass a valuation of US$ 23.7 Million, recording an absolute growth of US$ 13.4 Million from 2022 to 2023. The market in the USA is advancing at a CAGR of 4.0%. Historical CAGR: 2.6%
Growth Propellants Factors fueling the growth of the market are as follows:
  • Presence of regional players is increasing their impression in the e-commerce and social-media platforms through promotional events and advertisements, the surging market size for commercial burger grills.
  • The calorie-conscious base of customers is inclined towards grilled food since they do not require oil or butter for grilling, thereby raising the sale of the appliance.
Country Germany
Statistics The European commercial burger grill market is expected to have substantial growth over the forecast period. Germany is projected to dominate the European region through 2033. At present, the market is progressing at a moderate pace, registering a CAGR of 5.0%, and is likely to reach a market valuation of US$ 18.6 Million by the end of 2033. An approximate growth of US$ 12.5 Million has been recorded from the base year to the current. Historical CAGR: 4.1%
Growth Propellants Factors attributing to the expansion of the market are:
  • Burgers and toast are the favorite breakfast items at colleges and school canteen, which is fostering the product demand.
  • An increasing number of coffee shops and quick-service restaurants across Germany is a key aspect contributing to the growth of the market in Europe.
Country Japan
Statistics The commercial burger grill market in Japan is expected to witness rapid growth during the projection period. An estimated CAGR of 5.4% is expected through the end of 2033. The market is likely to reach a valuation of US$ 6.6 Million by the end of 2033. An approximate surge of US$ 4.3 Million is recorded in the market value from 2022 to 2023. Historical CAGR: 3.9%
Growth Propellants Factors attributing to the growth of commercial burger grills in Japan are:
  • Burger is one of the most convenient breakfast meals and with an increase in the working population across the country, the demand for commercial burger grills to make simple breakfast things is likely to be steady.
  • The increasing income level and rising purchasing power of consumers are fueling the consumption of fast food, thereby propelling demand for the product across Japan.
Country Korea
Statistics The Korean commercial burger grill market is anticipated to progress at a CAGR of 4.63% through the forecast period.
Growth Propellants Aspects fueling the growth of the market are as follows:
  • Innovations made to the products by market players are fueling the adoption of the appliance across the end-use industry.
  • Government grants to carry out research and developmental activities for further advancing the technology to curate ease for restaurants, cafes, and household applications.

Start-up Ecosystem

Start-ups Encompass the Mainstream Strategies to Gain Considerable Market Shares

The new entrants in the commercial burger grill market are leveraging advancements in technology to launch new products and gain a competitive advantage. These firms are continually investing in research and development activities to keep themselves in tandem with the changing consumer preferences and end-use industry demands. Efforts are being made to strengthen their foothold in the forum and aid the further progression of the commercial burger grill market.

Top Start-ups to Watch For

Grilland - Chennai-based Start-up

This start-up is aspiring for enhancement of various aspects with a strong business development team working untiringly to improve the various aspects like quality, kitchen innovation, food innovation, delivery management, and more.

Char-Broil - USA-based Start-up

This start-up company introduced the SmartChef Smoker app to notify people about maintaining meat temperature, chamber temperature, and cooking time.
Competitive Landscape

Key Players Indulge in Strategic Collaborations to Upkeep with Key Trends

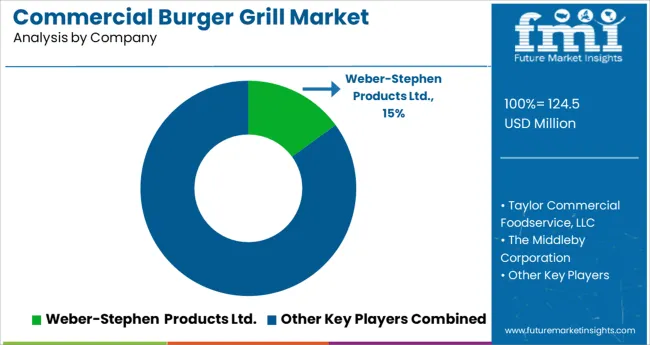
The commercial burger grill market is highly competitive and innovative in terms of products, durability, and cost of the product. The market is distinguished by the presence of international and regional players, who are increasing their impression in the e-commerce and social media platforms, through various promotional and advertising events.

The manufacturers are focusing on the launch of new products flourishing in the market and have come up with competitive strategies ad new product features in the market. For instance, Aim Engineering Industries is having customer centricity at the core as they are curating commercial burger grills, chicken grill machines, fish display counters, shawarma machine racks, and more with top-notch quality and are showcasing their product offerings through the digital catalog for further increasing their foothold and share in the commercial market.

Another prominent player, Syena Kitchenconceptz Manufacturing Pvt Ltd. is offering commercial kitchen equipment, with deep fat frying products as their top product. This firm is likely to gain considerable shares in the upcoming years.

Recent Developments

  • In January 2017, Griffin Technology introduced their ‘Connected Grills and Toasters’, which is a smart device with Bluetooth-enabled technology that can be controlled by a mobile application that offers personalized settings.
  • In December 2019, Revolution Cooking released its new 2-Slice High-Speed Commercial Grill machines, which have a touch screen that enables easy operation.

Some of the key players proliferating in the market are

  • Weber-Stephen Products Ltd.
  • The Middleby Corp.
  • DeLonghi SpA
  • The Holland Grill Company Inc.
  • Taylor Company
  • Roller Grill International
  • The Coleman Company Inc.
  • Spectrum Brands Inc.
  • Midea Group.
  • PH Peterson Co.
  • Dimplex North America Limited.

Key Segments in the Commercial Burger Grill Market

By Product Type:

  • Griddles
  • Charbroilers
  • Outdoor Grills

By Fuel:

  • Charcoal grills
  • Gas grills
  • Electric grills

By End-user:

  • Hotels, Restaurants, and Cafes
  • Canteens and Eateries
  • Food Stalls
  • Others

By Region:

  • North America
  • Latin America
  • Asia Pacific
  • Middle East and Africa (MEA)
  • Europe

Frequently Asked Questions

What is the Growth Outlook for the Commercial Burger Grill Market?

The growth outlook for the commercial burger grill market is predicted to advance at a CAGR of 5.1% from 2023 to 2033.

Which Region Leads the Commercial Burger Grill Market?

The North American region is anticipated to lead the commercial burger grill market during the forecast period.

What is the market valuation of the Commercial Burger Grill in 2023?

The market valuation of the commercial burger grill market stands at US$ 112.7 million in 2023.

How much Growth Potential does the Commercial Burger Grill hold?

The commercial burger grill market is likely to hold a valuation of US$ 184.6 million by 2033.

Which sector is the key driver in the Commercial Burger Grill Market?

The restaurants and café sector is the key driver in the commercial burger grill market.

Table of Content

1. Executive Summary | Commercial Burger Grill Market

    1.1. Global Market Outlook

    1.2. Demand-side Trends

    1.3. Supply-side Trends

    1.4. Technology Roadmap Analysis

    1.5. Analysis and Recommendations

2. Market Overview

    2.1. Market Coverage / Taxonomy

    2.2. Market Definition / Scope / Limitations

3. Market Background

    3.1. Market Dynamics

        3.1.1. Drivers

        3.1.2. Restraints

        3.1.3. Opportunity

        3.1.4. Trends

    3.2. Impact of Covid-19

        3.2.1. Demand in Optimistic Scenario

        3.2.2. Demand in Likely Scenario

        3.2.3. Demand in Conservative Scenario

    3.3. Macro Factors and Forecast Factors

    3.4. Value Chain Analysis

        3.4.1. Profit Margin Analysis

        3.4.2. Raw Product Type Suppliers

        3.4.3. Manufacturers, Wholesalers, and Distributors

        3.4.4. End Users/ Customers

    3.5. Regional Parent Market Outlook

    3.6. Production and Consumption Statistics

    3.7. Global Average Pricing Analysis Benchmark

4. Global Market Analysis 2018 to 2022 and Forecast, 2023 to 2033

    4.1. Historical Market Size Value (US$ Million) & Volume (Units) Analysis, 2018 to 2022

    4.2. Current and Future Market Size Value (US$ Million) & Volume (Units) Projections, 2023 to 2033

        4.2.1. Y-o-Y Growth Trend Analysis

        4.2.2. Absolute $ Opportunity Analysis

5. Global Market Analysis 2018 to 2022 and Forecast 2023 to 2033, By Product Type

    5.1. Introduction / Key Findings

    5.2. Historical Market Size Value (US$ Million) & Volume (Units) Analysis By Product Type, 2018 to 2022

    5.3. Current and Future Market Size Value (US$ Million) & Volume (Units) Analysis and Forecast By Product Type, 2023 to 2033

        5.3.1. Griddles

        5.3.2. Charbroilers

        5.3.3. Outdoor Grills

    5.4. Y-o-Y Growth Trend Analysis By Product Type, 2018 to 2022

    5.5. Absolute $ Opportunity Analysis By Product Type, 2023 to 2033

6. Global Market Analysis 2018 to 2022 and Forecast 2023 to 2033, By Fuel Type

    6.1. Introduction / Key Findings

    6.2. Historical Market Size Value (US$ Million) & Volume (Units) Analysis By Fuel Type, 2018 to 2022

    6.3. Current and Future Market Size Value (US$ Million) & Volume (Units) Analysis and Forecast By Fuel Type, 2023 to 2033

        6.3.1. Charcoal Grills

        6.3.2. Gas Grills

        6.3.3. Electric Grills

    6.4. Y-o-Y Growth Trend Analysis By Fuel Type, 2018 to 2022

    6.5. Absolute $ Opportunity Analysis By Fuel Type, 2023 to 2033

7. Global Market Analysis 2018 to 2022 and Forecast 2023 to 2033, By End User

    7.1. Introduction / Key Findings

    7.2. Historical Market Size Value (US$ Million) & Volume (Units) Analysis By End User, 2018 to 2022

    7.3. Current and Future Market Size Value (US$ Million) & Volume (Units) Analysis and Forecast By End User, 2023 to 2033

        7.3.1. Hotels, Restaurants, and Cafes

        7.3.2. Canteens and Eateries

        7.3.3. Food Stalls and others

    7.4. Y-o-Y Growth Trend Analysis By End User, 2018 to 2022

    7.5. Absolute $ Opportunity Analysis By End User, 2023 to 2033

8. Global Market Analysis 2018 to 2022 and Forecast 2023 to 2033, by Region

    8.1. Introduction / Key Findings

    8.2. Historical Market Size Value (US$ Million) & Volume (Units) Analysis By Region, 2018 to 2022

    8.3. Current and Future Market Size Value (US$ Million) & Volume (Units) Analysis and Forecast By Region, 2023 to 2033

        8.3.1. North America

        8.3.2. Latin America

        8.3.3. Europe

        8.3.4. East Asia

        8.3.5. South Asia

        8.3.6. Oceania

        8.3.7. Middle East and Africa (MEA)

    8.4. Market Attractiveness Analysis, by Region

9. North America Market Analysis 2018 to 2022 and Forecast 2023 to 2033, By Country

    9.1. Historical Market Size Value (US$ Million) & Volume (Units) Trend Analysis By Market Taxonomy, 2018 to 2022

    9.2. Market Size Value (US$ Million) & Volume (Units) Forecast By Market Taxonomy, 2023 to 2033

        9.2.1. By Country

            9.2.1.1. United States of America

            9.2.1.2. Canada

        9.2.2. By Product Type

        9.2.3. By Fuel Type

        9.2.4. By End User

    9.3. Market Attractiveness Analysis

        9.3.1. By Country

        9.3.2. By Product Type

        9.3.3. By Fuel Type

        9.3.4. By End User

    9.4. Key Takeaways

10. Latin America Market Analysis 2018 to 2022 and Forecast 2023 to 2033, By Country

    10.1. Historical Market Size Value (US$ Million) & Volume (Units) Trend Analysis By Market Taxonomy, 2018 to 2022

    10.2. Market Size Value (US$ Million) & Volume (Units) Forecast By Market Taxonomy, 2023 to 2033

        10.2.1. By Country

            10.2.1.1. Brazil

            10.2.1.2. Mexico

            10.2.1.3. Argentina

            10.2.1.4. Chile

            10.2.1.5. Peru

            10.2.1.6. Rest of Latin America

        10.2.2. By Product Type

        10.2.3. By Fuel Type

        10.2.4. By End User

    10.3. Market Attractiveness Analysis

        10.3.1. By Country

        10.3.2. By Product Type

        10.3.3. By Fuel Type

        10.3.4. By End User

    10.4. Key Takeaways

11. Europe Market Analysis 2018 to 2022 and Forecast 2023 to 2033, By Country

    11.1. Historical Market Size Value (US$ Million) & Volume (Units) Trend Analysis By Market Taxonomy, 2018 to 2022

    11.2. Market Size Value (US$ Million) & Volume (Units) Forecast By Market Taxonomy, 2023 to 2033

        11.2.1. By Country

            11.2.1.1. Germany

            11.2.1.2. Italy

            11.2.1.3. France

            11.2.1.4. United Kingdom

            11.2.1.5. Spain

            11.2.1.6. BENELUX

            11.2.1.7. Nordic

            11.2.1.8. Russia

            11.2.1.9. Poland

            11.2.1.10. Rest of Europe

        11.2.2. By Product Type

        11.2.3. By Fuel Type

        11.2.4. By End User

    11.3. Market Attractiveness Analysis

        11.3.1. By Country

        11.3.2. By Product Type

        11.3.3. By Fuel Type

        11.3.4. By End User

    11.4. Key Takeaways

12. East Asia Market Analysis 2018 to 2022 and Forecast 2023 to 2033, By Country

    12.1. Historical Market Size Value (US$ Million) & Volume (Units) Trend Analysis By Market Taxonomy, 2018 to 2022

    12.2. Market Size Value (US$ Million) & Volume (Units) Forecast By Market Taxonomy, 2023 to 2033

        12.2.1. By Country

            12.2.1.1. China

            12.2.1.2. Japan

            12.2.1.3. South Korea

        12.2.2. By Product Type

        12.2.3. By Fuel Type

        12.2.4. By End User

    12.3. Market Attractiveness Analysis

        12.3.1. By Country

        12.3.2. By Product Type

        12.3.3. By Fuel Type

        12.3.4. By End User

    12.4. Key Takeaways

13. South Asia Market Analysis 2018 to 2022 and Forecast 2023 to 2033, By Country

    13.1. Historical Market Size Value (US$ Million) & Volume (Units) Trend Analysis By Market Taxonomy, 2018 to 2022

    13.2. Market Size Value (US$ Million) & Volume (Units) Forecast By Market Taxonomy, 2023 to 2033

        13.2.1. By Country

            13.2.1.1. India

            13.2.1.2. Thailand

            13.2.1.3. Malaysia

            13.2.1.4. Indonesia

            13.2.1.5. Rest of South Asia

        13.2.2. By Product Type

        13.2.3. By Fuel Type

        13.2.4. By End User

    13.3. Market Attractiveness Analysis

        13.3.1. By Country

        13.3.2. By Product Type

        13.3.3. By Fuel Type

        13.3.4. By End User

    13.4. Key Takeaways

14. Oceania Market Analysis 2018 to 2022 and Forecast 2023 to 2033, By Country

    14.1. Historical Market Size Value (US$ Million) & Volume (Units) Trend Analysis By Market Taxonomy, 2018 to 2022

    14.2. Market Size Value (US$ Million) & Volume (Units) Forecast By Market Taxonomy, 2023 to 2033

        14.2.1. By Country

            14.2.1.1. Australia

            14.2.1.2. New Zealand

        14.2.2. By Product Type

        14.2.3. By Fuel Type

        14.2.4. By End User

    14.3. Market Attractiveness Analysis

        14.3.1. By Country

        14.3.2. By Product Type

        14.3.3. By Fuel Type

        14.3.4. By End User

    14.4. Key Takeaways

15. Middle East & Africa Market Analysis 2018 to 2022 and Forecast 2023 to 2033, By Country

    15.1. Historical Market Size Value (US$ Million) & Volume (Units) Trend Analysis By Market Taxonomy, 2018 to 2022

    15.2. Market Size Value (US$ Million) & Volume (Units) Forecast By Market Taxonomy, 2023 to 2033

        15.2.1. By Country

            15.2.1.1. GCC Countries

            15.2.1.2. Turkey

            15.2.1.3. Northern Africa

            15.2.1.4. South Africa

            15.2.1.5. Rest of MEA

        15.2.2. By Product Type

        15.2.3. By Fuel Type

        15.2.4. By End User

    15.3. Market Attractiveness Analysis

        15.3.1. By Country

        15.3.2. By Product Type

        15.3.3. By Fuel Type

        15.3.4. By End User

    15.4. Key Takeaways

16. Country-wise Market Analysis 

    16.1. United States (USA)

        16.1.1. Market Share Analysis, 2023

        16.1.2. By Product Type

        16.1.3. By Fuel Type

        16.1.4. By End User

    16.2. Canada

        16.2.1. Market Share Analysis, 2023

        16.2.2. By Product Type

        16.2.3. By Fuel Type

        16.2.4. By End User

    16.3. Brazil

        16.3.1. Market Share Analysis, 2023

        16.3.2. By Product Type

        16.3.3. By Fuel Type

        16.3.4. By End User

    16.4. Mexico

        16.4.1. Market Share Analysis, 2023

        16.4.2. By Product Type

        16.4.3. By Fuel Type

        16.4.4. By End User

    16.5. Germany

        16.5.1. Market Share Analysis, 2023

        16.5.2. By Product Type

        16.5.3. By Fuel Type

        16.5.4. By End User

    16.6. Italy

        16.6.1. Market Share Analysis, 2023

        16.6.2. By Product Type

        16.6.3. By Fuel Type

        16.6.4. By End User

    16.7. France

        16.7.1. Market Share Analysis, 2023

        16.7.2. By Product Type

        16.7.3. By Fuel Type

        16.7.4. By End User

    16.8. Spain

        16.8.1. Market Share Analysis, 2023

        16.8.2. By Product Type

        16.8.3. By Fuel Type

        16.8.4. By End User

    16.9. United Kingdom

        16.9.1. Market Share Analysis, 2023

        16.9.2. By Product Type

        16.9.3. By Fuel Type

        16.9.4. By End User

    16.10. Russia

        16.10.1. Market Share Analysis, 2023

        16.10.2. By Product Type

        16.10.3. By Fuel Type

        16.10.4. By End User

    16.11. China

        16.11.1. Market Share Analysis, 2023

        16.11.2. By Product Type

        16.11.3. By Fuel Type

        16.11.4. By End User

    16.12. Japan

        16.12.1. Market Share Analysis, 2023

        16.12.2. By Product Type

        16.12.3. By Fuel Type

        16.12.4. By End User

    16.13. India

        16.13.1. Market Share Analysis, 2023

        16.13.2. By Product Type

        16.13.3. By Fuel Type

        16.13.4. By End User

    16.14. GCC Countries

        16.14.1. Market Share Analysis, 2023

        16.14.2. By Product Type

        16.14.3. By Fuel Type

        16.14.4. By End User

    16.15. Australia

        16.15.1. Market Share Analysis, 2023

        16.15.2. By Product Type

        16.15.3. By Fuel Type

        16.15.4. By End User

17. Market Structure Analysis

    17.1. Competition Dashboard

    17.2. Competition Benchmarking

    17.3. Market Share Analysis of Top Players

        17.3.1. By Region

        17.3.2. By Product Portfolio

18. Competition Analysis

    18.1. Competition Deep Dive

        18.1.1. Taylor Commercial Foodservice, LLC

            18.1.1.1. Overview

            18.1.1.2. Product Portfolio

            18.1.1.3. Profitability by Market Segments (Product/Channel/Region)

            18.1.1.4. Sales Footprint

            18.1.1.5. Strategy Overview

                18.1.1.5.1. Marketing Strategy

                18.1.1.5.2. Product Strategy

                18.1.1.5.3. Channel Strategy

        18.1.2. Weber-Stephen Products Ltd.

            18.1.2.1. Overview

            18.1.2.2. Product Portfolio

            18.1.2.3. Profitability by Market Segments (Product/Channel/Region)

            18.1.2.4. Sales Footprint

            18.1.2.5. Strategy Overview

                18.1.2.5.1. Marketing Strategy

                18.1.2.5.2. Product Strategy

                18.1.2.5.3. Channel Strategy

        18.1.3. The Middleby Corporation

            18.1.3.1. Overview

            18.1.3.2. Product Portfolio

            18.1.3.3. Profitability by Market Segments (Product/Channel/Region)

            18.1.3.4. Sales Footprint

            18.1.3.5. Strategy Overview

                18.1.3.5.1. Marketing Strategy

                18.1.3.5.2. Product Strategy

                18.1.3.5.3. Channel Strategy

        18.1.4. The Holland Grill Company

            18.1.4.1. Overview

            18.1.4.2. Product Portfolio

            18.1.4.3. Profitability by Market Segments (Product/Channel/Region)

            18.1.4.4. Sales Footprint

            18.1.4.5. Strategy Overview

                18.1.4.5.1. Marketing Strategy

                18.1.4.5.2. Product Strategy

                18.1.4.5.3. Channel Strategy

        18.1.5. ROLLER GRILL INTERNATIONAL S.A.S

            18.1.5.1. Overview

            18.1.5.2. Product Portfolio

            18.1.5.3. Profitability by Market Segments (Product/Channel/Region)

            18.1.5.4. Sales Footprint

            18.1.5.5. Strategy Overview

                18.1.5.5.1. Marketing Strategy

                18.1.5.5.2. Product Strategy

                18.1.5.5.3. Channel Strategy

        18.1.6. The Coleman Company Inc.

            18.1.6.1. Overview

            18.1.6.2. Product Portfolio

            18.1.6.3. Profitability by Market Segments (Product/Channel/Region)

            18.1.6.4. Sales Footprint

            18.1.6.5. Strategy Overview

                18.1.6.5.1. Marketing Strategy

                18.1.6.5.2. Product Strategy

                18.1.6.5.3. Channel Strategy

        18.1.7. Foshan Nanhai Keyo BBQ Industry Co. Ltd.

            18.1.7.1. Overview

            18.1.7.2. Product Portfolio

            18.1.7.3. Profitability by Market Segments (Product/Channel/Region)

            18.1.7.4. Sales Footprint

            18.1.7.5. Strategy Overview

                18.1.7.5.1. Marketing Strategy

                18.1.7.5.2. Product Strategy

                18.1.7.5.3. Channel Strategy

        18.1.8. Guangzhou Jimark Food Machinery Co., Ltd.

            18.1.8.1. Overview

            18.1.8.2. Product Portfolio

            18.1.8.3. Profitability by Market Segments (Product/Channel/Region)

            18.1.8.4. Sales Footprint

            18.1.8.5. Strategy Overview

                18.1.8.5.1. Marketing Strategy

                18.1.8.5.2. Product Strategy

                18.1.8.5.3. Channel Strategy

        18.1.9. Jinan TINDO International Co., Ltd.

            18.1.9.1. Overview

            18.1.9.2. Product Portfolio

            18.1.9.3. Profitability by Market Segments (Product/Channel/Region)

            18.1.9.4. Sales Footprint

            18.1.9.5. Strategy Overview

                18.1.9.5.1. Marketing Strategy

                18.1.9.5.2. Product Strategy

                18.1.9.5.3. Channel Strategy

        18.1.10. AKSR India

            18.1.10.1. Overview

            18.1.10.2. Product Portfolio

            18.1.10.3. Profitability by Market Segments (Product/Channel/Region)

            18.1.10.4. Sales Footprint

            18.1.10.5. Strategy Overview

                18.1.10.5.1. Marketing Strategy

                18.1.10.5.2. Product Strategy

                18.1.10.5.3. Channel Strategy

19. Assumptions and Acronyms Used

20. Research Methodology

Explore Process Automation Insights

View Reports

Commercial Burger Grill Market