Smart Bottles Market Size and Share Forecast Outlook 2025 to 2035

The Smart Bottles Market is estimated to be valued at USD 192.3 million in 2025 and is projected to reach USD 613.5 million by 2035, registering a compound annual growth rate (CAGR) of 12.3% over the forecast period. Analysis of rolling CAGR over the decade reveals a dynamic growth pattern characterized by gradual acceleration and sustained momentum throughout the period. Between 2025 and 2030, the market increases from USD 192.3 million to USD 343.5 million.

The compound annual growth rate during these initial five years averages approximately 12.8%, reflecting early adoption phases and expanding consumer interest in connected packaging solutions. Yearly increments steadily rise from USD 23.7 million in 2026 to USD 38.6 million by 2030, showing consistent market acceptance and gradual penetration in the health, beverage, and consumer goods sectors. From 2030 to 2035, the market advances from USD 343.5 million to USD 613.5 million.

The rolling CAGR for this latter half is around 11.7%, slightly lower than the earlier phase but still indicative of strong and stable growth. Annual value gains increase from USD 43.7 million in 2031 to USD 67.2 million in 2035. This period reflects broader market expansion driven by technological innovation, integration with IoT platforms, and growing consumer demand for smart packaging.

The rolling CAGR analysis highlights a robust market with strong growth momentum maintained throughout the forecast period, underscoring the evolving role of smart bottle technology across various end-use applications.
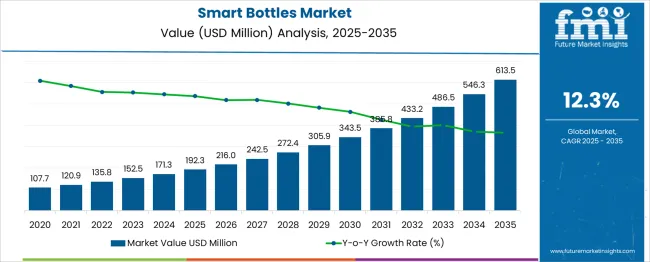
Smart Bottles Market Market Value Analysis

Quick Stats for Smart Bottles Market

  • Smart Bottles Market Value (2025): USD 192.3 million
  • Smart Bottles Market Forecast Value (2035): USD 613.5 million
  • Smart Bottles Market Forecast CAGR: 12.3%
  • Leading Segment in Smart Bottles Market in 2025: Smart Water Bottles (53.0%)
  • Key Growth Regions in Smart Bottles Market: North America, Asia-Pacific, Europe
  • Top Key Players in Smart Bottles Market: Hidrate, Inc., HydraCoach, Inc., Thermos LLC, Koninklijke Philips NV, Trago, Inc., Myhydrate, Inc., Gululu, LifeFuels, Inc., Moikit, Inc., Sippo (WaterH), Equa, Noerden, Ecomo, ionBottles Corporation, AQUAMINDER

Smart Bottles Market Key Takeaways

Metric Value
Smart Bottles Market Estimated Value in (2025 E) USD 192.3 million
Smart Bottles Market Forecast Value in (2035 F) USD 613.5 million
Forecast CAGR (2025 to 2035) 12.3%

The smart bottles market is viewed as a specialized yet steadily expanding category within its parent industries. It is estimated to account for about 1.9% of the global reusable bottles and drinkware market, driven by rising consumer interest in hydration tracking and health monitoring. Within the connected devices and Internet of Things (IoT) sector, a share of approximately 2.7% is assessed due to integration of sensors and mobile app connectivity.

In the sports and fitness equipment industry, around 2.4% is observed reflecting demand from active and health-conscious consumers. Within the smart home and personal wellness market, about 2.1% is evaluated as smart bottles become part of broader lifestyle technology ecosystems. In the environmental and sustainability product segment, a contribution of roughly 1.5% is calculated supported by reusable and eco-friendly materials.

Market growth has been influenced by consumer demand for personalized hydration data and convenience features. Innovations have focused on development of bottles with embedded sensors measuring water intake, temperature, and purity, along with app integration for reminders and tracking.

Interest has increased in designs offering modular components, wireless charging, and compatibility with fitness platforms. The North America region has been observed to lead adoption while Asia Pacific shows rapid growth due to expanding health awareness and wearable technology use. Strategic initiatives have included partnerships between smart device manufacturers and beverage companies to create co-branded products and integrated wellness solutions.

Why is the Smart Bottles Market Growing?

The smart bottles market is witnessing accelerating adoption driven by rising consumer focus on health tracking, hydration monitoring, and connected wellness devices. Growth is being enabled by the integration of sensors, mobile app connectivity, and real-time consumption data, which collectively enhance user experience and engagement.

Increasing penetration of fitness technology and smart wearables has fueled demand for auxiliary devices that support data-driven health management. In parallel, heightened environmental concerns and awareness campaigns around hydration benefits are encouraging users to shift from conventional to intelligent hydration solutions.

Tech-enabled product innovations and expanded retail visibility are further accelerating smart bottle adoption, especially across urban and fitness-centric demographics. Over the coming years, enhancements in battery life, modularity, and cross-device compatibility are expected to fuel next-generation product cycles and solidify the segment’s presence in the broader wellness and consumer electronics ecosystems.

Segmental Analysis

The smart bottles market is segmented by product type, material, connectivity, capacity, price, end use, and geographic regions. The smart bottles market is divided by product type into Smart Water Bottles, Smart Pill Bottles, and Others. The smart bottles market is classified by material into Plastic, Glass, Stainless Steel, and Others. The smart bottles market is segmented based on connectivity into Bluetooth, Wi-Fi, and NFC (Near Field Communication).

The smart bottles market is segmented by capacity into 500–1000 ml, 500 ml, and >1000 ml. The smart bottles market is segmented by price into Medium, Low, and High. The end use of the smart bottles market is segmented into Homecare Settings, Senior Care & Assisted Living Centers, and Others.

Regionally, the smart bottles industry is classified into North America, Latin America, Western Europe, Eastern Europe, Balkan & Baltic Countries, Russia & Belarus, Central Asia, East Asia, South Asia & Pacific, and the Middle East & Africa.
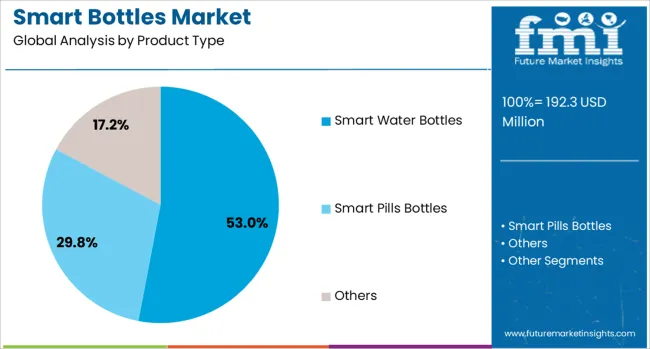
Insights into the Smart Water Bottles Product Type Segment

Smart Bottles Market Analysis By Product Type

Smart water bottles are projected to hold 53.0% of the overall market share by 2025, positioning them as the dominant product type. Their leadership is being supported by rising demand for hydration reminders, fluid intake tracking, and integration with health-monitoring platforms.

These bottles have found strong traction among athletes, office workers, and tech-savvy consumers who prioritize wellness data and goal-driven hydration. Enhanced features such as LED indicators, voice assistance, and real-time alerts have contributed to their mass-market viability.

Moreover, their compatibility with major fitness ecosystems has enabled strong ecosystem stickiness, driving repurchase behavior and platform engagement. As health personalization becomes more mainstream, smart water bottles are expected to remain the anchor of the smart hydration category.
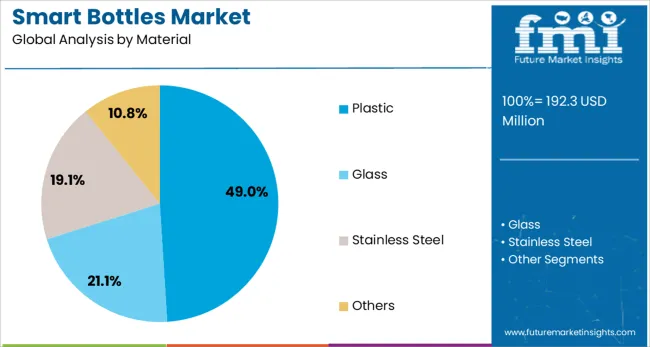
Insights into the Plastic Material Segment

Smart Bottles Market Analysis By Material

Plastic smart bottles are expected to account for 49.0% of total market revenue by 2025, making them the leading material segment. Their dominance is attributed to their affordability, design flexibility, and lightweight properties that support everyday usability.

Plastic options allow for easier sensor embedding, transparency in design, and a wide range of shape configurations, which collectively enhance product versatility. Additionally, the material’s durability under varied environmental conditions and its cost-effectiveness for mass production make it ideal for broader consumer penetration.

Sustainable variants of plastics, including BPA-free and recycled options, have further aligned with evolving environmental preferences, strengthening demand among value-conscious yet eco-aware consumers.
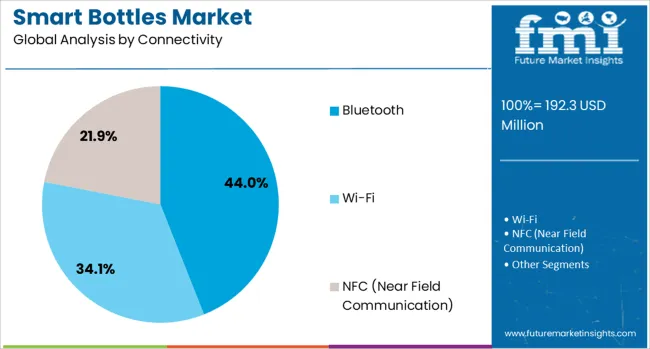
Insights into the Bluetooth Connectivity Segment

Smart Bottles Market Analysis By Connectivity

Bluetooth-enabled smart bottles are projected to contribute 44.0% of market share in 2025, making them the leading connectivity segment. This dominance is driven by the protocol’s compatibility with smartphones, wearables, and fitness apps, enabling real-time hydration tracking without constant internet access.

Bluetooth integration allows seamless syncing, battery efficiency, and local data storage, features that align well with user expectations for non-intrusive smart accessories. The protocol also facilitates firmware updates and user customization through dedicated apps, increasing consumer engagement and satisfaction.

As privacy and offline functionality gain importance, Bluetooth-enabled models are expected to retain their lead over Wi-Fi or cellular-connected alternatives in the consumer space.

What are the Drivers, Restraints, and Key Trends of the Smart Bottles Market?

The smart bottles market has been expanding steadily due to growing consumer interest in health monitoring and personalized hydration. The integration of sensors that track water consumption, temperature, and quality has been widely adopted to enhance user engagement. Connectivity features, including Bluetooth and IoT technology, have been embedded to allow real-time data synchronization with mobile applications. Growth has also been supported by rising awareness of the importance of hydration in maintaining overall wellness. Collaborations between technology developers and traditional bottle manufacturers have accelerated product innovation. Market penetration has been facilitated by expanding distribution channels and rising digital literacy across various regions.

Technological Advancements Elevating Functionality

Significant technological advancements have been made in sensor integration, enabling precise monitoring of fluid intake and environmental factors. Capacitive and optical sensors are commonly used for accurate detection of liquid levels and contamination. Temperature regulation features have been enhanced to maintain beverage freshness over extended periods. AI-powered applications have been developed to provide personalized hydration reminders based on user activity and environmental conditions. Eco-friendly, BPA-free materials have been utilized to meet consumer demand for sustainable products. These innovations have contributed to improved user experience and increased adoption across fitness, healthcare, and lifestyle markets globally.

Expanding Applications and Regional Growth

The adoption of smart bottles has been observed across diverse consumer segments, including athletes, office professionals, and older adults, with a focus on wellness maintenance. North America and Europe have emerged as key markets due to high digital penetration and health awareness. Rapid urbanization and increased health consciousness in the Asia-Pacific have driven significant market growth in countries such as China and India. Expansion into corporate wellness programs and healthcare sectors has diversified application areas. Strategic partnerships with wellness platforms and enhanced e-commerce availability have further broadened market accessibility. Regional product adaptations addressing local preferences have supported sustained growth in emerging economies.

Marketing and Consumer Engagement Strategies

Innovative marketing campaigns and consumer engagement initiatives have supported the market growth. Social media platforms and influencer collaborations have been leveraged to enhance brand visibility and communicate product benefits effectively. Personalized customer experiences have been created through interactive mobile applications and loyalty programs. Retailers have adopted omnichannel approaches combining online and offline sales channels to increase consumer touchpoints. Educational campaigns focusing on the role of hydration in health have been deployed to increase product acceptance. These strategies have facilitated stronger brand-consumer relationships and have driven repeat purchases and customer retention.

Market Challenges and Adoption Barriers

Challenges, including high product costs and technological complexity have moderated the market growth. Price sensitivity among consumers, especially in developing regions, has limited widespread adoption. The incorporation of multiple sensors and connectivity features has increased manufacturing expenses and device weight, impacting user convenience. Data privacy concerns have emerged due to the collection and transmission of personal hydration information. Technical limitations such as battery life and device durability under varying conditions have been reported. Fragmentation in platform compatibility has posed challenges to seamless integration. Manufacturers have been required to focus on cost optimization, cybersecurity, and cross-platform support to address these issues effectively.
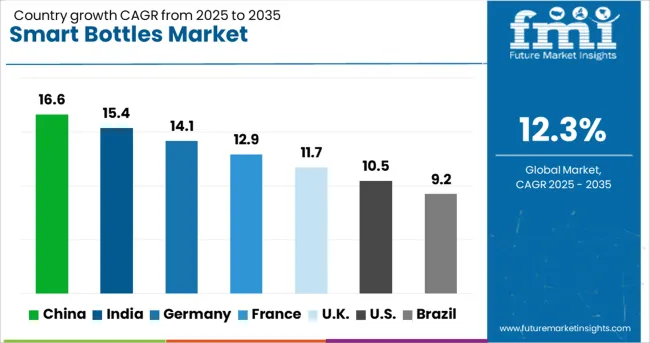
Analysis of Smart Bottles Market By Key Countries

Smart Bottles Market Cagr Analysis By Country

Country CAGR
China 16.6%
India 15.4%
Germany 14.1%
France 12.9%
UK 11.7%
USA 10.5%
Brazil 9.2%

The smart bottles market is expected to grow at a global CAGR of 12.3% between 2025 and 2035, driven by rising consumer interest in health monitoring, increasing adoption of IoT-enabled devices, and growth in fitness and wellness sectors. China leads with a 16.6% CAGR, supported by large-scale electronics manufacturing and expanding health-conscious population. India follows at 15.4%, fueled by growing fitness awareness and rising smart device penetration. Germany, at 14.1%, benefits from advanced sensor technologies and strong consumer electronics markets. The UK, projected at 11.7%, sees growth from health-focused consumers and wearable tech integration. The USA, at 10.5%, reflects steady adoption in fitness, healthcare, and lifestyle segments. This report includes insights on 40+ countries; the top markets are shown here for reference.

Growth Potential of Smart Bottles Market in China

China is forecasted to expand at a CAGR of 16.6% from 2025 to 2035 due to increasing consumer focus on hydration monitoring and health awareness. Local brands like Xiaomi and Huawei are integrating sensors and connectivity features into smart bottles, enhancing user interaction with mobile apps. The growing fitness culture in urban centers and partnerships with health platforms accelerate adoption. Production costs remain competitive due to domestic manufacturing capabilities. The rising demand from younger, tech-savvy consumers is a key growth driver.

  • Bluetooth-enabled smart bottle shipments rose by 17% in 2024.
  • Hydration tracking feature adoption increased by 15% year on year.
  • Fitness app integrations grew by 18% in 2024.

Market Dynamics of Smart Bottles in India

India is expected to witness a CAGR of 15.4% from 2025 to 2035, supported by growing health consciousness and expanding digital retail platforms. Companies such as Havells and Noise have launched smart bottles with temperature control and hydration alert systems. Increased smartphone penetration and rising fitness trends among urban populations stimulate demand. Affordability and localized product features remain essential to capturing the market. Rapid growth in e-commerce channels has enabled broader access to innovative smart hydration solutions.
  • Temperature control smart bottle sales increased by 16% in 2024.
  • E-commerce sales of smart bottles grew by 15% year on year.
  • Hydration reminder feature uptake rose by 14% in 2024.

Smart Bottles Market Expansion Outlook in Germany

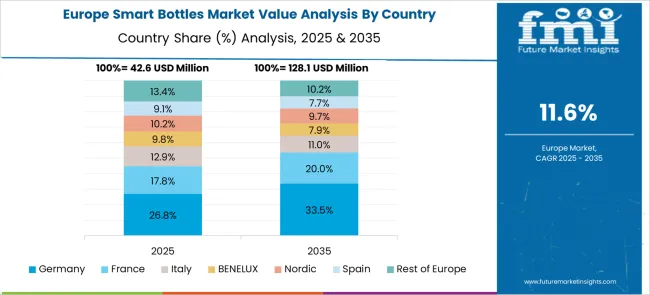
Smart Bottles Market Europe Country Market Share Analysis, 2025 & 2035

Germany is poised for a CAGR of 14.1% between 2025 and 2035, with consumers prioritizing sustainability alongside technology. Brands such as VIVREAL emphasize smart bottles made from recyclable materials equipped with precise hydration sensors. Integration with health tracking and smart home systems further enhances appeal. The market targets environmentally conscious and tech-savvy customers willing to invest in durable and premium products. Strong distribution through health stores and specialty retailers supports market penetration.

  • Sales of eco-friendly smart bottles increased by 13% in 2024.
  • Hydration sensor-equipped product shipments grew by 14% year on year.
  • Smart home system integrations rose by 12% in 2024.

Consumer Behavior Analysis for Smart Bottles in the United Kingdom

The United Kingdom is expected to see a CAGR of 11.7% from 2025 to 2035, driven by wellness trends and the popularity of connected lifestyle devices. Leading players like Equa and HidrateSpark focus on app-enabled smart bottles that offer customizable hydration plans. Corporate wellness initiatives and an aging population increase demand. Emphasis on sustainable materials and product design aesthetics influences purchase decisions. Retail strategies blend online platforms and experiential stores to enhance consumer engagement.
  • App-connected smart bottle sales rose by 12% in 2024.
  • Corporate wellness program influence grew by 11% year on year.
  • Sustainable material use increased by 10% in 2024.

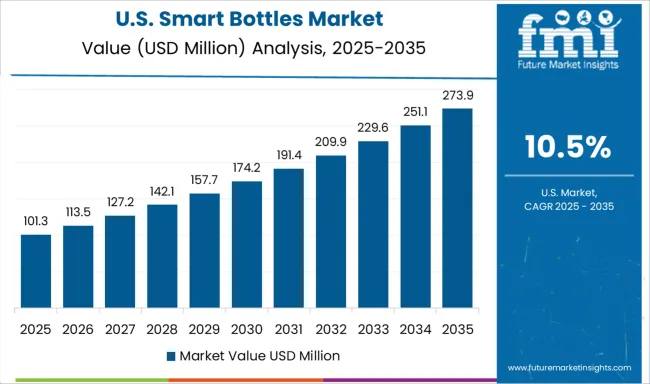
United States Smart Bottles Market Growth Forecast

Smart Bottles Market Country Value Analysis

The United States is anticipated to grow at a CAGR of 10.5% from 2025 to 2035, fueled by high consumer adoption of fitness and wellness technologies. Brands like Hidrate and Thermos lead with smart bottles featuring temperature regulation and hydration reminders synced with mobile applications. Distribution through specialty retailers and online channels widens market reach. Social media marketing and influencer endorsements play a vital role in brand visibility. Demand is primarily driven by active lifestyle consumers focused on health optimization.
  • Temperature regulation smart bottle sales increased by 13% in 2024.
  • Online retail revenue grew by 14% year on year.
  • Social media campaigns boosted market growth by 15% in 2024.

Competitive Landscape of Smart Bottles Market

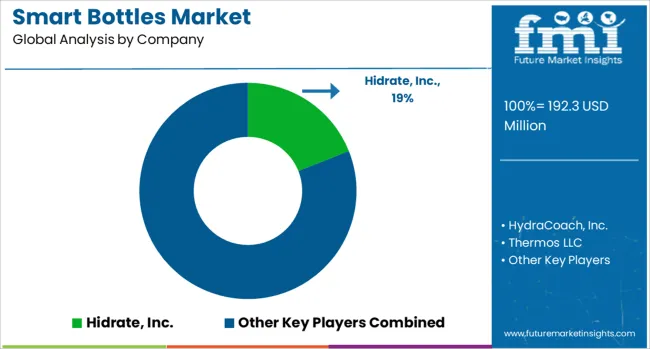
Smart Bottles Market Analysis By Company

The smart bottles market is driven by technology-focused companies and consumer goods brands developing hydration products with integrated sensors, Bluetooth connectivity, and app-based tracking features. Hidrate, Inc. and HydraCoach, Inc. are pioneers offering bottles that monitor water intake and provide real-time reminders to improve hydration habits.

Thermos LLC combines traditional insulated bottle expertise with smart technology, targeting health-conscious consumers. Koninklijke Philips NV extends its wellness portfolio with smart hydration solutions designed for seamless integration with personal health ecosystems.

Trago, Inc. and Myhydrate, Inc. develop connected bottles with customizable LED reminders and smartphone apps for hydration tracking. Gululu targets younger demographics by combining smart bottles with gamified hydration encouragement features. LifeFuels, Inc. offers modular bottles that track hydration and provide nutrient delivery options through custom fuel pods. Moikit, Inc., Sippo (WaterH), and Equa focus on sleek design and usability, emphasizing durability and battery life.

Noerden and Ecomo deliver eco-friendly smart bottles with health monitoring sensors, while ionBottles Corporation and AQUAMINDER integrate UV-C sterilization with smart features for enhanced water safety. Key strategies include continuous innovation in sensor accuracy, expanding app functionality for health data integration, and broadening distribution channels through e-commerce and retail partnerships. Entry barriers include technology development costs, user privacy considerations, and the need for seamless hardware-software integration to ensure reliable consumer experience.

Key Developments in Smart Bottles Market

  • In August 2024, Temp X launched a Kickstarter campaign for its innovative smart water bottle, designed with sustainability and convenience in mind. The bottle features advanced hydration tracking and is poised to revolutionize how people stay hydrated on the go.
  • In March 2024, Water.IO introduced a smart hydration product comprising a smart bottle and the Water.io app. The bottle features LED lights and vibration reminders, helping users maintain optimal hydration levels throughout the day.

Scope of the Report

Item Value
Quantitative Units USD 192.3 Million
Product Type Smart Water Bottles, Smart Pills Bottles, and Others
Material Plastic, Glass, Stainless Steel, and Others
Connectivity Bluetooth, Wi-Fi, and NFC (Near Field Communication)
Capacity 500–1000 ml, 500 ml, and >1000 ml
Price Medium, Low, and High
End Use Homecare Settings, Senior Care & Assisted Living Centers, and Others
Regions Covered North America, Europe, Asia-Pacific, Latin America, Middle East & Africa
Country Covered United States, Canada, Germany, France, United Kingdom, China, Japan, India, Brazil, South Africa
Key Companies Profiled Hidrate, Inc., HydraCoach, Inc., Thermos LLC, Koninklijke Philips NV, Trago, Inc., Myhydrate, Inc., Gululu, LifeFuels, Inc., Moikit, Inc., Sippo (WaterH), Equa, Noerden, Ecomo, ionBottles Corporation, and AQUAMINDER
Additional Attributes Dollar sales by material type and distribution channel, demand dynamics across hydration tracking, temperature control, and connected fitness integration, regional trends in adoption across North America, Europe, and Asia-Pacific, innovation in IoT-enabled sensors, mobile app connectivity, and self-cleaning technologies, environmental impact of production materials and end-of-life disposal, and emerging use cases in personalized hydration plans, corporate wellness programs, and athletic performance monitoring.

Smart Bottles Market by Segments

Product Type:

  • Smart Water Bottles
  • Smart Pills Bottles
  • Others

Material:

  • Plastic
  • Glass
  • Stainless Steel
  • Others

Connectivity:

  • Bluetooth
  • Wi-Fi
  • NFC (Near Field Communication)

Capacity:

  • 500–1000 ml
  • 500 ml
  • >1000 ml

Price:

  • Medium
  • Low
  • High

Region:

  • North America
    • USA
    • Canada
    • Mexico
  • Latin America
    • Brazil
    • Chile
    • Rest of Latin America
  • Western Europe
    • Germany
    • UK
    • Italy
    • Spain
    • France
    • Nordic
    • BENELUX
    • Rest of Western Europe
  • Eastern Europe
    • Russia
    • Poland
    • Hungary
    • Balkan & Baltic
    • Rest of Eastern Europe
  • East Asia
    • China
    • Japan
    • South Korea
  • South Asia and Pacific
    • India
    • ASEAN
    • Australia & New Zealand
    • Rest of South Asia and Pacific
  • Middle East & Africa
    • Kingdom of Saudi Arabia
    • Other GCC Countries
    • Turkiye
    • South Africa
    • Other African Union
    • Rest of Middle East & Africa

Table of Content

  1. Executive Summary
    • Global Market Outlook
    • Demand-side Trends
    • Supply-side Trends
    • Technology Roadmap Analysis
    • Analysis and Recommendations
  2. Market Overview
    • Market Coverage / Taxonomy
    • Market Definition / Scope / Limitations
  3. Market Background
    • Market Dynamics
      • Drivers
      • Restraints
      • Opportunity
      • Trends
    • Scenario Forecast
      • Demand in Optimistic Scenario
      • Demand in Likely Scenario
      • Demand in Conservative Scenario
    • Opportunity Map Analysis
    • Product Life Cycle Analysis
    • Supply Chain Analysis
    • Investment Feasibility Matrix
    • Value Chain Analysis
    • PESTLE and Porter’s Analysis
    • Regulatory Landscape
    • Regional Parent Market Outlook
    • Production and Consumption Statistics
    • Import and Export Statistics
  4. Global Smart Bottles Market Analysis 2020-2024 and Forecast, 2025-2035
    • Historical Market Size Value (USD Mn) Analysis, 2020-2024
    • Current and Future Market Size Value (USD Mn) Projections, 2025-2035
      • Y-o-Y Growth Trend Analysis
      • Absolute $ Opportunity Analysis
  5. Global Smart Bottles Market Pricing Analysis 2020-2024 and Forecast 2025-2035
  6. Global Smart Bottles Market Analysis 2020-2024 and Forecast 2025-2035, By Product Type
    • Introduction / Key Findings
    • Historical Market Size Value (USD Mn) Analysis By Product Type , 2020-2024
    • Current and Future Market Size Value (USD Mn) Analysis and Forecast By Product Type , 2025-2035
      • Smart Water Bottles
      • Smart Pills Bottles
      • Others
    • Y-o-Y Growth Trend Analysis By Product Type , 2020-2024
    • Absolute $ Opportunity Analysis By Product Type , 2025-2035
  7. Global Smart Bottles Market Analysis 2020-2024 and Forecast 2025-2035, By Material
    • Introduction / Key Findings
    • Historical Market Size Value (USD Mn) Analysis By Material, 2020-2024
    • Current and Future Market Size Value (USD Mn) Analysis and Forecast By Material, 2025-2035
      • Plastic
      • Glass
      • Stainless Steel
      • Others
    • Y-o-Y Growth Trend Analysis By Material, 2020-2024
    • Absolute $ Opportunity Analysis By Material, 2025-2035
  8. Global Smart Bottles Market Analysis 2020-2024 and Forecast 2025-2035, By Connectivity
    • Introduction / Key Findings
    • Historical Market Size Value (USD Mn) Analysis By Connectivity, 2020-2024
    • Current and Future Market Size Value (USD Mn) Analysis and Forecast By Connectivity, 2025-2035
      • Bluetooth
      • Wi-Fi
      • NFC (Near Field Communication)
    • Y-o-Y Growth Trend Analysis By Connectivity, 2020-2024
    • Absolute $ Opportunity Analysis By Connectivity, 2025-2035
  9. Global Smart Bottles Market Analysis 2020-2024 and Forecast 2025-2035, By Capacity
    • Introduction / Key Findings
    • Historical Market Size Value (USD Mn) Analysis By Capacity, 2020-2024
    • Current and Future Market Size Value (USD Mn) Analysis and Forecast By Capacity, 2025-2035
      • 500-1000 ml
      • 500 ml
      • >1000 ml
    • Y-o-Y Growth Trend Analysis By Capacity, 2020-2024
    • Absolute $ Opportunity Analysis By Capacity, 2025-2035
  10. Global Smart Bottles Market Analysis 2020-2024 and Forecast 2025-2035, By Price
    • Introduction / Key Findings
    • Historical Market Size Value (USD Mn) Analysis By Price, 2020-2024
    • Current and Future Market Size Value (USD Mn) Analysis and Forecast By Price, 2025-2035
      • Medium
      • Low
      • High
    • Y-o-Y Growth Trend Analysis By Price, 2020-2024
    • Absolute $ Opportunity Analysis By Price, 2025-2035
  11. Global Smart Bottles Market Analysis 2020-2024 and Forecast 2025-2035, By End Use
    • Introduction / Key Findings
    • Historical Market Size Value (USD Mn) Analysis By End Use, 2020-2024
    • Current and Future Market Size Value (USD Mn) Analysis and Forecast By End Use, 2025-2035
      • Homecare Settings
      • Senior Care & Assisted Living Centers
      • Others
    • Y-o-Y Growth Trend Analysis By End Use, 2020-2024
    • Absolute $ Opportunity Analysis By End Use, 2025-2035
  12. Global Smart Bottles Market Analysis 2020-2024 and Forecast 2025-2035, By Region
    • Introduction
    • Historical Market Size Value (USD Mn) Analysis By Region, 2020-2024
    • Current Market Size Value (USD Mn) Analysis and Forecast By Region, 2025-2035
      • North America
      • Latin America
      • Western Europe
      • Eastern Europe
      • East Asia
      • South Asia and Pacific
      • Middle East & Africa
    • Market Attractiveness Analysis By Region
  13. North America Smart Bottles Market Analysis 2020-2024 and Forecast 2025-2035, By Country
    • Historical Market Size Value (USD Mn) Trend Analysis By Market Taxonomy, 2020-2024
    • Market Size Value (USD Mn) Forecast By Market Taxonomy, 2025-2035
      • By Country
        • USA
        • Canada
        • Mexico
      • By Product Type
      • By Material
      • By Connectivity
      • By Capacity
      • By Price
      • By End Use
    • Market Attractiveness Analysis
      • By Country
      • By Product Type
      • By Material
      • By Connectivity
      • By Capacity
      • By Price
      • By End Use
    • Key Takeaways
  14. Latin America Smart Bottles Market Analysis 2020-2024 and Forecast 2025-2035, By Country
    • Historical Market Size Value (USD Mn) Trend Analysis By Market Taxonomy, 2020-2024
    • Market Size Value (USD Mn) Forecast By Market Taxonomy, 2025-2035
      • By Country
        • Brazil
        • Chile
        • Rest of Latin America
      • By Product Type
      • By Material
      • By Connectivity
      • By Capacity
      • By Price
      • By End Use
    • Market Attractiveness Analysis
      • By Country
      • By Product Type
      • By Material
      • By Connectivity
      • By Capacity
      • By Price
      • By End Use
    • Key Takeaways
  15. Western Europe Smart Bottles Market Analysis 2020-2024 and Forecast 2025-2035, By Country
    • Historical Market Size Value (USD Mn) Trend Analysis By Market Taxonomy, 2020-2024
    • Market Size Value (USD Mn) Forecast By Market Taxonomy, 2025-2035
      • By Country
        • Germany
        • UK
        • Italy
        • Spain
        • France
        • Nordic
        • BENELUX
        • Rest of Western Europe
      • By Product Type
      • By Material
      • By Connectivity
      • By Capacity
      • By Price
      • By End Use
    • Market Attractiveness Analysis
      • By Country
      • By Product Type
      • By Material
      • By Connectivity
      • By Capacity
      • By Price
      • By End Use
    • Key Takeaways
  16. Eastern Europe Smart Bottles Market Analysis 2020-2024 and Forecast 2025-2035, By Country
    • Historical Market Size Value (USD Mn) Trend Analysis By Market Taxonomy, 2020-2024
    • Market Size Value (USD Mn) Forecast By Market Taxonomy, 2025-2035
      • By Country
        • Russia
        • Poland
        • Hungary
        • Balkan & Baltic
        • Rest of Eastern Europe
      • By Product Type
      • By Material
      • By Connectivity
      • By Capacity
      • By Price
      • By End Use
    • Market Attractiveness Analysis
      • By Country
      • By Product Type
      • By Material
      • By Connectivity
      • By Capacity
      • By Price
      • By End Use
    • Key Takeaways
  17. East Asia Smart Bottles Market Analysis 2020-2024 and Forecast 2025-2035, By Country
    • Historical Market Size Value (USD Mn) Trend Analysis By Market Taxonomy, 2020-2024
    • Market Size Value (USD Mn) Forecast By Market Taxonomy, 2025-2035
      • By Country
        • China
        • Japan
        • South Korea
      • By Product Type
      • By Material
      • By Connectivity
      • By Capacity
      • By Price
      • By End Use
    • Market Attractiveness Analysis
      • By Country
      • By Product Type
      • By Material
      • By Connectivity
      • By Capacity
      • By Price
      • By End Use
    • Key Takeaways
  18. South Asia and Pacific Smart Bottles Market Analysis 2020-2024 and Forecast 2025-2035, By Country
    • Historical Market Size Value (USD Mn) Trend Analysis By Market Taxonomy, 2020-2024
    • Market Size Value (USD Mn) Forecast By Market Taxonomy, 2025-2035
      • By Country
        • India
        • ASEAN
        • Australia & New Zealand
        • Rest of South Asia and Pacific
      • By Product Type
      • By Material
      • By Connectivity
      • By Capacity
      • By Price
      • By End Use
    • Market Attractiveness Analysis
      • By Country
      • By Product Type
      • By Material
      • By Connectivity
      • By Capacity
      • By Price
      • By End Use
    • Key Takeaways
  19. Middle East & Africa Smart Bottles Market Analysis 2020-2024 and Forecast 2025-2035, By Country
    • Historical Market Size Value (USD Mn) Trend Analysis By Market Taxonomy, 2020-2024
    • Market Size Value (USD Mn) Forecast By Market Taxonomy, 2025-2035
      • By Country
        • Kingdom of Saudi Arabia
        • Other GCC Countries
        • Turkiye
        • South Africa
        • Other African Union
        • Rest of Middle East & Africa
      • By Product Type
      • By Material
      • By Connectivity
      • By Capacity
      • By Price
      • By End Use
    • Market Attractiveness Analysis
      • By Country
      • By Product Type
      • By Material
      • By Connectivity
      • By Capacity
      • By Price
      • By End Use
    • Key Takeaways
  20. Key Countries Smart Bottles Market Analysis
    • USA
      • Pricing Analysis
      • Market Share Analysis, 2024
        • By Product Type
        • By Material
        • By Connectivity
        • By Capacity
        • By Price
        • By End Use
    • Canada
      • Pricing Analysis
      • Market Share Analysis, 2024
        • By Product Type
        • By Material
        • By Connectivity
        • By Capacity
        • By Price
        • By End Use
    • Mexico
      • Pricing Analysis
      • Market Share Analysis, 2024
        • By Product Type
        • By Material
        • By Connectivity
        • By Capacity
        • By Price
        • By End Use
    • Brazil
      • Pricing Analysis
      • Market Share Analysis, 2024
        • By Product Type
        • By Material
        • By Connectivity
        • By Capacity
        • By Price
        • By End Use
    • Chile
      • Pricing Analysis
      • Market Share Analysis, 2024
        • By Product Type
        • By Material
        • By Connectivity
        • By Capacity
        • By Price
        • By End Use
    • Germany
      • Pricing Analysis
      • Market Share Analysis, 2024
        • By Product Type
        • By Material
        • By Connectivity
        • By Capacity
        • By Price
        • By End Use
    • UK
      • Pricing Analysis
      • Market Share Analysis, 2024
        • By Product Type
        • By Material
        • By Connectivity
        • By Capacity
        • By Price
        • By End Use
    • Italy
      • Pricing Analysis
      • Market Share Analysis, 2024
        • By Product Type
        • By Material
        • By Connectivity
        • By Capacity
        • By Price
        • By End Use
    • Spain
      • Pricing Analysis
      • Market Share Analysis, 2024
        • By Product Type
        • By Material
        • By Connectivity
        • By Capacity
        • By Price
        • By End Use
    • France
      • Pricing Analysis
      • Market Share Analysis, 2024
        • By Product Type
        • By Material
        • By Connectivity
        • By Capacity
        • By Price
        • By End Use
    • India
      • Pricing Analysis
      • Market Share Analysis, 2024
        • By Product Type
        • By Material
        • By Connectivity
        • By Capacity
        • By Price
        • By End Use
    • ASEAN
      • Pricing Analysis
      • Market Share Analysis, 2024
        • By Product Type
        • By Material
        • By Connectivity
        • By Capacity
        • By Price
        • By End Use
    • Australia & New Zealand
      • Pricing Analysis
      • Market Share Analysis, 2024
        • By Product Type
        • By Material
        • By Connectivity
        • By Capacity
        • By Price
        • By End Use
    • China
      • Pricing Analysis
      • Market Share Analysis, 2024
        • By Product Type
        • By Material
        • By Connectivity
        • By Capacity
        • By Price
        • By End Use
    • Japan
      • Pricing Analysis
      • Market Share Analysis, 2024
        • By Product Type
        • By Material
        • By Connectivity
        • By Capacity
        • By Price
        • By End Use
    • South Korea
      • Pricing Analysis
      • Market Share Analysis, 2024
        • By Product Type
        • By Material
        • By Connectivity
        • By Capacity
        • By Price
        • By End Use
    • Russia
      • Pricing Analysis
      • Market Share Analysis, 2024
        • By Product Type
        • By Material
        • By Connectivity
        • By Capacity
        • By Price
        • By End Use
    • Poland
      • Pricing Analysis
      • Market Share Analysis, 2024
        • By Product Type
        • By Material
        • By Connectivity
        • By Capacity
        • By Price
        • By End Use
    • Hungary
      • Pricing Analysis
      • Market Share Analysis, 2024
        • By Product Type
        • By Material
        • By Connectivity
        • By Capacity
        • By Price
        • By End Use
    • Kingdom of Saudi Arabia
      • Pricing Analysis
      • Market Share Analysis, 2024
        • By Product Type
        • By Material
        • By Connectivity
        • By Capacity
        • By Price
        • By End Use
    • Turkiye
      • Pricing Analysis
      • Market Share Analysis, 2024
        • By Product Type
        • By Material
        • By Connectivity
        • By Capacity
        • By Price
        • By End Use
    • South Africa
      • Pricing Analysis
      • Market Share Analysis, 2024
        • By Product Type
        • By Material
        • By Connectivity
        • By Capacity
        • By Price
        • By End Use
  21. Market Structure Analysis
    • Competition Dashboard
    • Competition Benchmarking
    • Market Share Analysis of Top Players
      • By Regional
      • By Product Type
      • By Material
      • By Connectivity
      • By Capacity
      • By Price
      • By End Use
  22. Competition Analysis
    • Competition Deep Dive
      • Hidrate, Inc.
        • Overview
        • Product Portfolio
        • Profitability by Market Segments (Product/Age /Sales Channel/Region)
        • Sales Footprint
        • Strategy Overview
          • Marketing Strategy
          • Product Strategy
          • Channel Strategy
      • HydraCoach, Inc.
      • Thermos LLC
      • Koninklijke Philips NV
      • Trago, Inc.
      • Myhydrate, Inc.
      • Gululu
      • LifeFuels, Inc.
      • Moikit, Inc.
      • Sippo (WaterH)
      • Equa
      • Noerden
      • Ecomo
      • ionBottles Corporation
      • AQUAMINDER
  23. Assumptions & Acronyms Used
  24. Research Methodology

List of Tables

  • Table 1: Global Smart Bottles Market Value (USD Mn) Forecast by Region, 2020-2035
  • Table 2: Global Smart Bottles Market Value (USD Mn) Forecast by Product Type , 2020-2035
  • Table 3: Global Smart Bottles Market Value (USD Mn) Forecast by Material, 2020-2035
  • Table 4: Global Smart Bottles Market Value (USD Mn) Forecast by Connectivity, 2020-2035
  • Table 5: Global Smart Bottles Market Value (USD Mn) Forecast by Capacity, 2020-2035
  • Table 6: Global Smart Bottles Market Value (USD Mn) Forecast by Price, 2020-2035
  • Table 7: Global Smart Bottles Market Value (USD Mn) Forecast by End Use, 2020-2035
  • Table 8: North America Smart Bottles Market Value (USD Mn) Forecast by Country, 2020-2035
  • Table 9: North America Smart Bottles Market Value (USD Mn) Forecast by Product Type , 2020-2035
  • Table 10: North America Smart Bottles Market Value (USD Mn) Forecast by Material, 2020-2035
  • Table 11: North America Smart Bottles Market Value (USD Mn) Forecast by Connectivity, 2020-2035
  • Table 12: North America Smart Bottles Market Value (USD Mn) Forecast by Capacity, 2020-2035
  • Table 13: North America Smart Bottles Market Value (USD Mn) Forecast by Price, 2020-2035
  • Table 14: North America Smart Bottles Market Value (USD Mn) Forecast by End Use, 2020-2035
  • Table 15: Latin America Smart Bottles Market Value (USD Mn) Forecast by Country, 2020-2035
  • Table 16: Latin America Smart Bottles Market Value (USD Mn) Forecast by Product Type , 2020-2035
  • Table 17: Latin America Smart Bottles Market Value (USD Mn) Forecast by Material, 2020-2035
  • Table 18: Latin America Smart Bottles Market Value (USD Mn) Forecast by Connectivity, 2020-2035
  • Table 19: Latin America Smart Bottles Market Value (USD Mn) Forecast by Capacity, 2020-2035
  • Table 20: Latin America Smart Bottles Market Value (USD Mn) Forecast by Price, 2020-2035
  • Table 21: Latin America Smart Bottles Market Value (USD Mn) Forecast by End Use, 2020-2035
  • Table 22: Western Europe Smart Bottles Market Value (USD Mn) Forecast by Country, 2020-2035
  • Table 23: Western Europe Smart Bottles Market Value (USD Mn) Forecast by Product Type , 2020-2035
  • Table 24: Western Europe Smart Bottles Market Value (USD Mn) Forecast by Material, 2020-2035
  • Table 25: Western Europe Smart Bottles Market Value (USD Mn) Forecast by Connectivity, 2020-2035
  • Table 26: Western Europe Smart Bottles Market Value (USD Mn) Forecast by Capacity, 2020-2035
  • Table 27: Western Europe Smart Bottles Market Value (USD Mn) Forecast by Price, 2020-2035
  • Table 28: Western Europe Smart Bottles Market Value (USD Mn) Forecast by End Use, 2020-2035
  • Table 29: Eastern Europe Smart Bottles Market Value (USD Mn) Forecast by Country, 2020-2035
  • Table 30: Eastern Europe Smart Bottles Market Value (USD Mn) Forecast by Product Type , 2020-2035
  • Table 31: Eastern Europe Smart Bottles Market Value (USD Mn) Forecast by Material, 2020-2035
  • Table 32: Eastern Europe Smart Bottles Market Value (USD Mn) Forecast by Connectivity, 2020-2035
  • Table 33: Eastern Europe Smart Bottles Market Value (USD Mn) Forecast by Capacity, 2020-2035
  • Table 34: Eastern Europe Smart Bottles Market Value (USD Mn) Forecast by Price, 2020-2035
  • Table 35: Eastern Europe Smart Bottles Market Value (USD Mn) Forecast by End Use, 2020-2035
  • Table 36: East Asia Smart Bottles Market Value (USD Mn) Forecast by Country, 2020-2035
  • Table 37: East Asia Smart Bottles Market Value (USD Mn) Forecast by Product Type , 2020-2035
  • Table 38: East Asia Smart Bottles Market Value (USD Mn) Forecast by Material, 2020-2035
  • Table 39: East Asia Smart Bottles Market Value (USD Mn) Forecast by Connectivity, 2020-2035
  • Table 40: East Asia Smart Bottles Market Value (USD Mn) Forecast by Capacity, 2020-2035
  • Table 41: East Asia Smart Bottles Market Value (USD Mn) Forecast by Price, 2020-2035
  • Table 42: East Asia Smart Bottles Market Value (USD Mn) Forecast by End Use, 2020-2035
  • Table 43: South Asia and Pacific Smart Bottles Market Value (USD Mn) Forecast by Country, 2020-2035
  • Table 44: South Asia and Pacific Smart Bottles Market Value (USD Mn) Forecast by Product Type , 2020-2035
  • Table 45: South Asia and Pacific Smart Bottles Market Value (USD Mn) Forecast by Material, 2020-2035
  • Table 46: South Asia and Pacific Smart Bottles Market Value (USD Mn) Forecast by Connectivity, 2020-2035
  • Table 47: South Asia and Pacific Smart Bottles Market Value (USD Mn) Forecast by Capacity, 2020-2035
  • Table 48: South Asia and Pacific Smart Bottles Market Value (USD Mn) Forecast by Price, 2020-2035
  • Table 49: South Asia and Pacific Smart Bottles Market Value (USD Mn) Forecast by End Use, 2020-2035
  • Table 50: Middle East & Africa Smart Bottles Market Value (USD Mn) Forecast by Country, 2020-2035
  • Table 51: Middle East & Africa Smart Bottles Market Value (USD Mn) Forecast by Product Type , 2020-2035
  • Table 52: Middle East & Africa Smart Bottles Market Value (USD Mn) Forecast by Material, 2020-2035
  • Table 53: Middle East & Africa Smart Bottles Market Value (USD Mn) Forecast by Connectivity, 2020-2035
  • Table 54: Middle East & Africa Smart Bottles Market Value (USD Mn) Forecast by Capacity, 2020-2035
  • Table 55: Middle East & Africa Smart Bottles Market Value (USD Mn) Forecast by Price, 2020-2035
  • Table 56: Middle East & Africa Smart Bottles Market Value (USD Mn) Forecast by End Use, 2020-2035

List of Figures

  • Figure 1: Global Smart Bottles Market Pricing Analysis
  • Figure 2: Global Smart Bottles Market Value (USD Mn) Forecast 2020–2035
  • Figure 3: Global Smart Bottles Market Value (USD Mn) Share and BPS Analysis by Region, 2025 and 2035
  • Figure 4: Global Smart Bottles Market Y-o-Y Growth Comparison by Region, 2025–2035
  • Figure 5: Global Smart Bottles Market Attractiveness Analysis by Region
  • Figure 6: North America Smart Bottles Market Incremental Dollar Opportunity, 2025–2035
  • Figure 7: Latin America Smart Bottles Market Incremental Dollar Opportunity, 2025–2035
  • Figure 8: Western Europe Smart Bottles Market Incremental Dollar Opportunity, 2025–2035
  • Figure 9: Eastern Europe Smart Bottles Market Incremental Dollar Opportunity, 2025–2035
  • Figure 10: East Asia Smart Bottles Market Incremental Dollar Opportunity, 2025–2035
  • Figure 11: South Asia and Pacific Smart Bottles Market Incremental Dollar Opportunity, 2025–2035
  • Figure 12: Middle East & Africa Smart Bottles Market Incremental Dollar Opportunity, 2025–2035
  • Figure 13: North America Smart Bottles Market Value Share and BPS Analysis by Country, 2025 and 2035
  • Figure 14: Latin America Smart Bottles Market Value Share and BPS Analysis by Country, 2025 and 2035
  • Figure 15: Western Europe Smart Bottles Market Value Share and BPS Analysis by Country, 2025 and 2035
  • Figure 16: Eastern Europe Smart Bottles Market Value Share and BPS Analysis by Country, 2025 and 2035
  • Figure 17: East Asia Smart Bottles Market Value Share and BPS Analysis by Country, 2025 and 2035
  • Figure 18: South Asia and Pacific Smart Bottles Market Value Share and BPS Analysis by Country, 2025 and 2035
  • Figure 19: Middle East & Africa Smart Bottles Market Value Share and BPS Analysis by Country, 2025 and 2035
  • Figure 20: Global Smart Bottles Market – Tier Structure Analysis
  • Figure 21: Global Smart Bottles Market – Company Share Analysis

Frequently Asked Questions

How big is the smart bottles market in 2025?

The global smart bottles market is estimated to be valued at USD 192.3 million in 2025.

What will be the size of smart bottles market in 2035?

The market size for the smart bottles market is projected to reach USD 613.5 million by 2035.

How much will be the smart bottles market growth between 2025 and 2035?

The smart bottles market is expected to grow at a 12.3% CAGR between 2025 and 2035.

What are the key product types in the smart bottles market?

The key product types in smart bottles market are smart water bottles, smart pills bottles and others.

Which material segment to contribute significant share in the smart bottles market in 2025?

In terms of material, plastic segment to command 49.0% share in the smart bottles market in 2025.

Explore Similar Insights

Future Market Insights

Smart Bottles Market