Smart Water Monitoring Market Size and Share Forecast Outlook 2025 to 2035

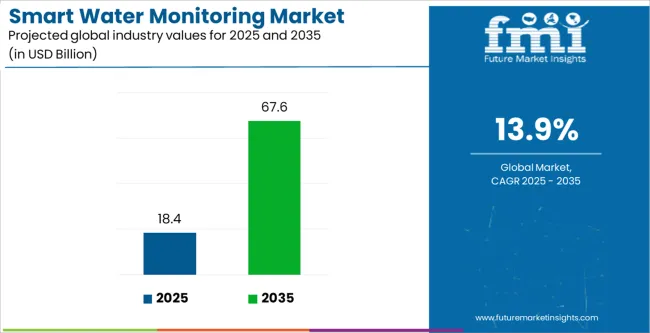
The Smart Water Monitoring Market is estimated to be valued at USD 18.4 billion in 2025 and is projected to reach USD 67.6 billion by 2035, registering a compound annual growth rate (CAGR) of 13.9% over the forecast period.
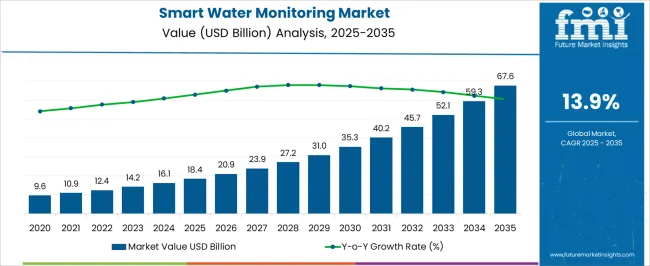
Quick Stats for Smart Water Monitoring Market

  • Smart Water Monitoring Market Value (2025): USD 18.4 billion
  • Smart Water Monitoring Market Forecast Value (2035): USD 67.6 billion
  • Smart Water Monitoring Market Forecast CAGR: 13.9%
  • Leading Segment in Smart Water Monitoring Market in 2025: Quantitative Monitoring (54.6%)
  • Key Growth Regions in Smart Water Monitoring Market: North America, Asia-Pacific, Europe
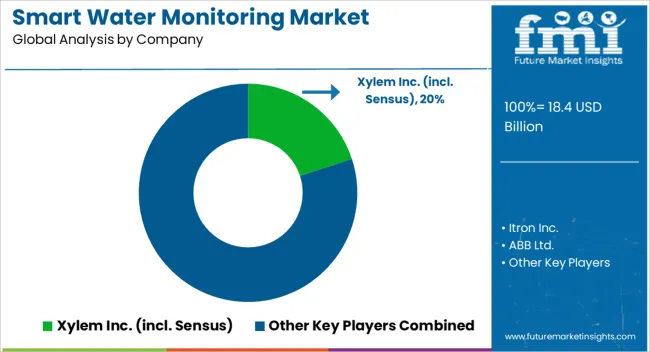
  • Top Key Players in Smart Water Monitoring Market: Xylem Inc. (incl. Sensus), Itron Inc., ABB Ltd., ABB Ltd., Schneider Electric SE (+AVEVA)

Smart Water Monitoring Market Key Takeaways

MetricValue
Smart Water Monitoring Market Estimated Value in (2025 E)USD 18.4 billion
Smart Water Monitoring Market Forecast Value in (2035 F)USD 67.6 billion
Forecast CAGR (2025 to 2035)13.9%

Why is the Smart Water Monitoring Market Growing?

Market Overview:

The Smart Water Monitoring market is advancing rapidly as industries and municipalities prioritize water efficiency, regulatory compliance, and sustainability goals. Growing concerns over water scarcity and the pressing need to reduce losses across distribution networks have accelerated the deployment of intelligent monitoring systems. The current market landscape is characterized by an increased focus on integrating IoT, cloud computing, and data analytics into water management systems, allowing stakeholders to track consumption patterns, detect leaks in real time, and optimize distribution.

Rising government initiatives for sustainable water use and investments in smart city infrastructure are further enhancing adoption. The future outlook suggests strong growth momentum, as utilities and industries alike are expected to embrace digital technologies for resource optimization.

With water conservation gaining prominence in both developed and emerging regions, the market is positioned to benefit from long-term demand The ability of smart monitoring systems to deliver cost savings, improve decision-making, and ensure regulatory adherence is creating significant opportunities for continued expansion across sectors.

Segmental Analysis:

The smart water monitoring market is segmented by type, component, end user, and geographic regions. By type, smart water monitoring market is divided into Quantitative Monitoring and Qualitative Monitoring. In terms of component, smart water monitoring market is classified into Hardware, Software, and Services. Based on end user, smart water monitoring market is segmented into Industrial, Residential, Commercial, and Corporate. Regionally, the smart water monitoring industry is classified into North America, Latin America, Western Europe, Eastern Europe, Balkan & Baltic Countries, Russia & Belarus, Central Asia, East Asia, South Asia & Pacific, and the Middle East & Africa.
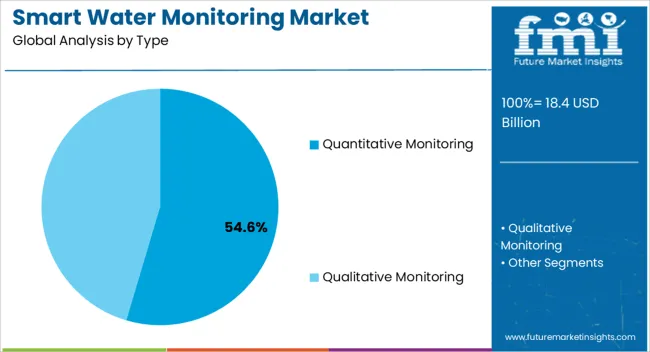
Insights into the Quantitative Monitoring Segment

The quantitative monitoring type is projected to account for 54.60% of the Smart Water Monitoring market revenue in 2025, making it the leading segment. This dominance is being attributed to the rising importance of accurate and real-time measurement of water usage, which is essential for both industrial and municipal applications.

Quantitative monitoring allows utilities and enterprises to track consumption patterns, identify inefficiencies, and take corrective actions based on data-driven insights. The growth of this segment has been reinforced by the increasing use of IoT-enabled sensors and meters that transmit continuous data, enabling faster detection of anomalies such as leaks and unauthorized consumption.

As water scarcity continues to intensify, the ability to measure and manage every drop has become critical, further boosting demand for quantitative monitoring solutions Additionally, stricter regulatory frameworks and sustainability goals across multiple regions have created pressure on industries and municipalities to adopt advanced monitoring systems that can deliver transparency and accountability in water management practices.
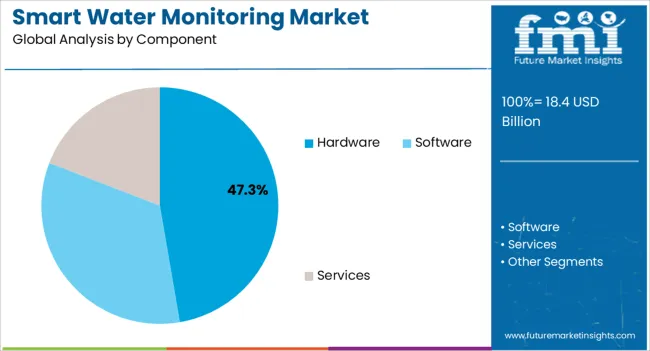
Insights into the Hardware Segment

The hardware component is expected to capture 47.30% of the overall Smart Water Monitoring market revenue in 2025, emerging as the dominant component segment. This leadership is being driven by the critical role that physical devices such as sensors, meters, transmitters, and data loggers play in collecting accurate water-related information. Hardware adoption has been accelerated by advancements in low-power devices and miniaturized sensors, which have enabled cost-effective deployments at scale.

The growing demand for robust and durable monitoring devices capable of withstanding harsh environmental conditions has further supported this segment’s expansion. Hardware remains a fundamental enabler of smart monitoring systems, as reliable data collection is the first step toward analytics and decision-making.

Moreover, the rapid modernization of water infrastructure, particularly in industrial and urban utilities, has required large-scale installations of smart meters and flow sensors With demand for real-time water management rising, hardware continues to hold a strong position, supported by ongoing innovation in device efficiency and network connectivity.
Insights into the Industrial Segment

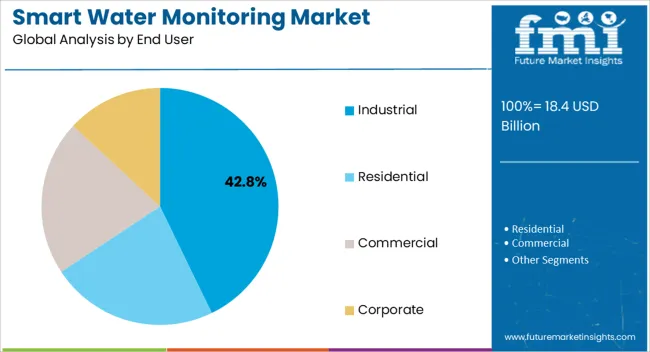
The industrial end-user segment is anticipated to hold 42.80% of the Smart Water Monitoring market revenue in 2025, making it the largest contributor by end use. This dominance is being driven by the high water consumption levels across industries such as manufacturing, energy, mining, and food and beverages, which necessitate precise monitoring and management. Industrial users are increasingly adopting smart water monitoring solutions to ensure regulatory compliance, reduce operational costs, and optimize water usage in production processes.

The ability of these systems to detect leaks, manage wastewater, and provide detailed consumption analytics has strengthened their appeal in industrial operations. Rising environmental regulations have also compelled industries to adopt sustainable practices, further boosting adoption of smart monitoring technologies.

With growing emphasis on corporate sustainability and operational efficiency, industries are investing in advanced systems that not only conserve water but also enhance productivity This segment’s leadership is expected to persist as industries continue to face increasing scrutiny over their environmental footprint and resource management practices.

Market Overview

Smart Water Monitoring Market Overview

Water has always been a crucial part of our lives, and due to pollution and contamination this critical element in terms of safe drinking water is replenishing. Nowadays, due to global warming, water quality and quantity monitoring in real time has become a challenge, and the growing population is left with limited water resources. Hence, there is a critical need for developing better methodologies for smart water monitoring (quality and quantity parameters) in real time. Smart Water Monitoring is such a solution which facilitates the monitoring of water quality, and helps in providing safe water to the population across globe. Smart Water Monitoring market is expected to have a potential growth during the forecast period, because of the daily requirement for control of quality and quantity through smart water monitoring techniques in future years. Smart Water Monitoring is not only limited to large water plants and water utilities, but is also used at residential and corporate levels. Moreover, the focus towards conserving water provides better opportunities to Smart Water Monitoring market. And practice of purifying the water before its usage is growing, which in turn is driving the market for Smart Water Monitoring in the forecast period. With such an increasing inclination towards using safe water, the market for Smart Water Monitoring solutions is expected to have substantial growth opportunity over the forecast period promoting the growth of Smart Water Monitoring Market.
Analysis of Smart Water Monitoring Market By Key Countries

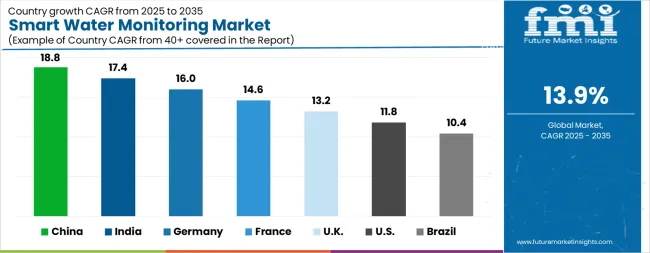
CountryCAGR
China18.8%
India17.4%
Germany16.0%
France14.6%
U.K.13.2%
U.S.11.8%
Brazil10.4%
China7.0%
India6.5%
Germany6.0%
France5.5%
U.K.4.9%
U.S.4.4%
Brazil3.9%

Country-wise Analysis

The Smart Water Monitoring Market is expected to register a CAGR of 13.9% during the forecast period, exhibiting varied country level momentum. China leads with the highest CAGR of 18.8%, followed by India at 17.4%. Developed markets such as Germany, France, and the U.K. continue to expand steadily, while the U.S. is likely to grow at consistent rates. Brazil posts the lowest CAGR at 3.9%, yet still underscores a broadly positive trajectory for the global Smart Water Monitoring Market. In 2024, Germany held a dominant revenue in the Western Europe market and is expected to grow with a CAGR of 16.0%. The U.S. Smart Water Monitoring Market is estimated to be valued at USD 6.7 billion in 2025 and is anticipated to reach a valuation of USD 20.6 billion by 2035. Sales are projected to rise at a CAGR of 11.8% over the forecast period between 2025 and 2035. While Japan and South Korea markets are estimated to be valued at USD 941.9 million and USD 584.1 million respectively in 2025.
Key Players in the Smart Water Monitoring Market

  • Xylem Inc. (incl. Sensus)
  • Itron Inc.
  • ABB Ltd.
  • ABB Ltd.
  • Schneider Electric SE (+AVEVA)

Scope of the Report

ItemValue
Quantitative UnitsUSD 18.4 Billion
TypeQuantitative Monitoring and Qualitative Monitoring
ComponentHardware, Software, and Services
End UserIndustrial, Residential, Commercial, and Corporate
Regions CoveredNorth America, Europe, Asia-Pacific, Latin America, Middle East & Africa
Country CoveredUnited States, Canada, Germany, France, United Kingdom, China, Japan, India, Brazil, South Africa
Key Companies ProfiledXylem Inc. (incl. Sensus), Itron Inc., ABB Ltd., ABB Ltd., and Schneider Electric SE (+AVEVA)

Smart Water Monitoring Market by Segments

Type:

  • Quantitative Monitoring
  • Qualitative Monitoring

Component:

  • Hardware
  • Software
  • Services

End User:

  • Industrial
  • Residential
  • Commercial
  • Corporate

Region:

  • North America
    • U.S.
    • Canada
    • Mexico
  • Latin America
    • Brazil
    • Chile
    • Rest of Latin America
  • Western Europe
    • Germany
    • U.K.
    • Italy
    • Spain
    • France
    • Nordic
    • BENELUX
    • Rest of Western Europe
  • Eastern Europe
    • Russia
    • Poland
    • Hungary
    • Balkan & Baltic
    • Rest of Eastern Europe
  • East Asia
    • China
    • Japan
    • South Korea
  • South Asia and Pacific
    • India
    • ASEAN
    • Australia & New Zealand
    • Rest of South Asia and Pacific
  • Middle East & Africa
    • Kingdom of Saudi Arabia
    • Other GCC Countries
    • Turkiye
    • South Africa
    • Other African Union
    • Rest of Middle East & Africa

Table of Content

  1. Executive Summary
    • Global Market Outlook
    • Demand-side Trends
    • Supply-side Trends
    • Technology Roadmap Analysis
    • Analysis and Recommendations
  2. Market Overview
    • Market Coverage / Taxonomy
    • Market Definition / Scope / Limitations
  3. Market Background
    • Market Dynamics
      • Drivers
      • Restraints
      • Opportunity
      • Trends
    • Scenario Forecast
      • Demand in Optimistic Scenario
      • Demand in Likely Scenario
      • Demand in Conservative Scenario
    • Opportunity Map Analysis
    • Product Life Cycle Analysis
    • Supply Chain Analysis
    • Investment Feasibility Matrix
    • Value Chain Analysis
    • PESTLE and Porter’s Analysis
    • Regulatory Landscape
    • Regional Parent Market Outlook
    • Production and Consumption Statistics
    • Import and Export Statistics
  4. Global Smart Water Monitoring Market Analysis 2020-2024 and Forecast, 2025-2035
    • Historical Market Size Value (USD Mn) Analysis, 2020-2024
    • Current and Future Market Size Value (USD Mn) Projections, 2025-2035
      • Y-o-Y Growth Trend Analysis
      • Absolute $ Opportunity Analysis
  5. Global Smart Water Monitoring Market Pricing Analysis 2020-2024 and Forecast 2025-2035
  6. Global Smart Water Monitoring Market Analysis 2020-2024 and Forecast 2025-2035, By Type
    • Introduction / Key Findings
    • Historical Market Size Value (USD Mn) Analysis By Type , 2020-2024
    • Current and Future Market Size Value (USD Mn) Analysis and Forecast By Type , 2025-2035
      • Quantitative Monitoring
      • Qualitative Monitoring
    • Y-o-Y Growth Trend Analysis By Type , 2020-2024
    • Absolute $ Opportunity Analysis By Type , 2025-2035
  7. Global Smart Water Monitoring Market Analysis 2020-2024 and Forecast 2025-2035, By Component
    • Introduction / Key Findings
    • Historical Market Size Value (USD Mn) Analysis By Component, 2020-2024
    • Current and Future Market Size Value (USD Mn) Analysis and Forecast By Component, 2025-2035
      • Hardware
        • Sensors
        • Other Monitoring Devices
      • Software
      • Services
    • Y-o-Y Growth Trend Analysis By Component, 2020-2024
    • Absolute $ Opportunity Analysis By Component, 2025-2035
  8. Global Smart Water Monitoring Market Analysis 2020-2024 and Forecast 2025-2035, By End User
    • Introduction / Key Findings
    • Historical Market Size Value (USD Mn) Analysis By End User, 2020-2024
    • Current and Future Market Size Value (USD Mn) Analysis and Forecast By End User, 2025-2035
      • Industrial
      • Residential
      • Commercial
      • Corporate
    • Y-o-Y Growth Trend Analysis By End User, 2020-2024
    • Absolute $ Opportunity Analysis By End User, 2025-2035
  9. Global Smart Water Monitoring Market Analysis 2020-2024 and Forecast 2025-2035, By Region
    • Introduction
    • Historical Market Size Value (USD Mn) Analysis By Region, 2020-2024
    • Current Market Size Value (USD Mn) Analysis and Forecast By Region, 2025-2035
      • North America
      • Latin America
      • Western Europe
      • Eastern Europe
      • East Asia
      • South Asia and Pacific
      • Middle East & Africa
    • Market Attractiveness Analysis By Region
  10. North America Smart Water Monitoring Market Analysis 2020-2024 and Forecast 2025-2035, By Country
    • Historical Market Size Value (USD Mn) Trend Analysis By Market Taxonomy, 2020-2024
    • Market Size Value (USD Mn) Forecast By Market Taxonomy, 2025-2035
      • By Country
        • U.S.
        • Canada
        • Mexico
      • By Type
      • By Component
      • By End User
    • Market Attractiveness Analysis
      • By Country
      • By Type
      • By Component
      • By End User
    • Key Takeaways
  11. Latin America Smart Water Monitoring Market Analysis 2020-2024 and Forecast 2025-2035, By Country
    • Historical Market Size Value (USD Mn) Trend Analysis By Market Taxonomy, 2020-2024
    • Market Size Value (USD Mn) Forecast By Market Taxonomy, 2025-2035
      • By Country
        • Brazil
        • Chile
        • Rest of Latin America
      • By Type
      • By Component
      • By End User
    • Market Attractiveness Analysis
      • By Country
      • By Type
      • By Component
      • By End User
    • Key Takeaways
  12. Western Europe Smart Water Monitoring Market Analysis 2020-2024 and Forecast 2025-2035, By Country
    • Historical Market Size Value (USD Mn) Trend Analysis By Market Taxonomy, 2020-2024
    • Market Size Value (USD Mn) Forecast By Market Taxonomy, 2025-2035
      • By Country
        • Germany
        • U.K.
        • Italy
        • Spain
        • France
        • Nordic
        • BENELUX
        • Rest of Western Europe
      • By Type
      • By Component
      • By End User
    • Market Attractiveness Analysis
      • By Country
      • By Type
      • By Component
      • By End User
    • Key Takeaways
  13. Eastern Europe Smart Water Monitoring Market Analysis 2020-2024 and Forecast 2025-2035, By Country
    • Historical Market Size Value (USD Mn) Trend Analysis By Market Taxonomy, 2020-2024
    • Market Size Value (USD Mn) Forecast By Market Taxonomy, 2025-2035
      • By Country
        • Russia
        • Poland
        • Hungary
        • Balkan & Baltic
        • Rest of Eastern Europe
      • By Type
      • By Component
      • By End User
    • Market Attractiveness Analysis
      • By Country
      • By Type
      • By Component
      • By End User
    • Key Takeaways
  14. East Asia Smart Water Monitoring Market Analysis 2020-2024 and Forecast 2025-2035, By Country
    • Historical Market Size Value (USD Mn) Trend Analysis By Market Taxonomy, 2020-2024
    • Market Size Value (USD Mn) Forecast By Market Taxonomy, 2025-2035
      • By Country
        • China
        • Japan
        • South Korea
      • By Type
      • By Component
      • By End User
    • Market Attractiveness Analysis
      • By Country
      • By Type
      • By Component
      • By End User
    • Key Takeaways
  15. South Asia and Pacific Smart Water Monitoring Market Analysis 2020-2024 and Forecast 2025-2035, By Country
    • Historical Market Size Value (USD Mn) Trend Analysis By Market Taxonomy, 2020-2024
    • Market Size Value (USD Mn) Forecast By Market Taxonomy, 2025-2035
      • By Country
        • India
        • ASEAN
        • Australia & New Zealand
        • Rest of South Asia and Pacific
      • By Type
      • By Component
      • By End User
    • Market Attractiveness Analysis
      • By Country
      • By Type
      • By Component
      • By End User
    • Key Takeaways
  16. Middle East & Africa Smart Water Monitoring Market Analysis 2020-2024 and Forecast 2025-2035, By Country
    • Historical Market Size Value (USD Mn) Trend Analysis By Market Taxonomy, 2020-2024
    • Market Size Value (USD Mn) Forecast By Market Taxonomy, 2025-2035
      • By Country
        • Kingdom of Saudi Arabia
        • Other GCC Countries
        • Turkiye
        • South Africa
        • Other African Union
        • Rest of Middle East & Africa
      • By Type
      • By Component
      • By End User
    • Market Attractiveness Analysis
      • By Country
      • By Type
      • By Component
      • By End User
    • Key Takeaways
  17. Key Countries Smart Water Monitoring Market Analysis
    • U.S.
      • Pricing Analysis
      • Market Share Analysis, 2024
        • By Type
        • By Component
        • By End User
    • Canada
      • Pricing Analysis
      • Market Share Analysis, 2024
        • By Type
        • By Component
        • By End User
    • Mexico
      • Pricing Analysis
      • Market Share Analysis, 2024
        • By Type
        • By Component
        • By End User
    • Brazil
      • Pricing Analysis
      • Market Share Analysis, 2024
        • By Type
        • By Component
        • By End User
    • Chile
      • Pricing Analysis
      • Market Share Analysis, 2024
        • By Type
        • By Component
        • By End User
    • Germany
      • Pricing Analysis
      • Market Share Analysis, 2024
        • By Type
        • By Component
        • By End User
    • U.K.
      • Pricing Analysis
      • Market Share Analysis, 2024
        • By Type
        • By Component
        • By End User
    • Italy
      • Pricing Analysis
      • Market Share Analysis, 2024
        • By Type
        • By Component
        • By End User
    • Spain
      • Pricing Analysis
      • Market Share Analysis, 2024
        • By Type
        • By Component
        • By End User
    • France
      • Pricing Analysis
      • Market Share Analysis, 2024
        • By Type
        • By Component
        • By End User
    • India
      • Pricing Analysis
      • Market Share Analysis, 2024
        • By Type
        • By Component
        • By End User
    • ASEAN
      • Pricing Analysis
      • Market Share Analysis, 2024
        • By Type
        • By Component
        • By End User
    • Australia & New Zealand
      • Pricing Analysis
      • Market Share Analysis, 2024
        • By Type
        • By Component
        • By End User
    • China
      • Pricing Analysis
      • Market Share Analysis, 2024
        • By Type
        • By Component
        • By End User
    • Japan
      • Pricing Analysis
      • Market Share Analysis, 2024
        • By Type
        • By Component
        • By End User
    • South Korea
      • Pricing Analysis
      • Market Share Analysis, 2024
        • By Type
        • By Component
        • By End User
    • Russia
      • Pricing Analysis
      • Market Share Analysis, 2024
        • By Type
        • By Component
        • By End User
    • Poland
      • Pricing Analysis
      • Market Share Analysis, 2024
        • By Type
        • By Component
        • By End User
    • Hungary
      • Pricing Analysis
      • Market Share Analysis, 2024
        • By Type
        • By Component
        • By End User
    • Kingdom of Saudi Arabia
      • Pricing Analysis
      • Market Share Analysis, 2024
        • By Type
        • By Component
        • By End User
    • Turkiye
      • Pricing Analysis
      • Market Share Analysis, 2024
        • By Type
        • By Component
        • By End User
    • South Africa
      • Pricing Analysis
      • Market Share Analysis, 2024
        • By Type
        • By Component
        • By End User
  18. Market Structure Analysis
    • Competition Dashboard
    • Competition Benchmarking
    • Market Share Analysis of Top Players
      • By Regional
      • By Type
      • By Component
      • By End User
  19. Competition Analysis
    • Competition Deep Dive
      • Xylem Inc. (incl. Sensus)
        • Overview
        • Product Portfolio
        • Profitability by Market Segments (Product/Age /Sales Channel/Region)
        • Sales Footprint
        • Strategy Overview
          • Marketing Strategy
          • Product Strategy
          • Channel Strategy
      • Itron Inc.
      • ABB Ltd.
      • ABB Ltd.
      • Schneider Electric SE (+AVEVA)
  20. Assumptions & Acronyms Used
  21. Research Methodology

List of Tables

  • Table 1: Global Smart Water Monitoring Market Value (USD Mn) Forecast by Region, 2020-2035
  • Table 2: Global Smart Water Monitoring Market Value (USD Mn) Forecast by Type , 2020-2035
  • Table 3: Global Smart Water Monitoring Market Value (USD Mn) Forecast by Component, 2020-2035
  • Table 4: Global Smart Water Monitoring Market Value (USD Mn) Forecast by End User, 2020-2035
  • Table 5: North America Smart Water Monitoring Market Value (USD Mn) Forecast by Country, 2020-2035
  • Table 6: North America Smart Water Monitoring Market Value (USD Mn) Forecast by Type , 2020-2035
  • Table 7: North America Smart Water Monitoring Market Value (USD Mn) Forecast by Component, 2020-2035
  • Table 8: North America Smart Water Monitoring Market Value (USD Mn) Forecast by End User, 2020-2035
  • Table 9: Latin America Smart Water Monitoring Market Value (USD Mn) Forecast by Country, 2020-2035
  • Table 10: Latin America Smart Water Monitoring Market Value (USD Mn) Forecast by Type , 2020-2035
  • Table 11: Latin America Smart Water Monitoring Market Value (USD Mn) Forecast by Component, 2020-2035
  • Table 12: Latin America Smart Water Monitoring Market Value (USD Mn) Forecast by End User, 2020-2035
  • Table 13: Western Europe Smart Water Monitoring Market Value (USD Mn) Forecast by Country, 2020-2035
  • Table 14: Western Europe Smart Water Monitoring Market Value (USD Mn) Forecast by Type , 2020-2035
  • Table 15: Western Europe Smart Water Monitoring Market Value (USD Mn) Forecast by Component, 2020-2035
  • Table 16: Western Europe Smart Water Monitoring Market Value (USD Mn) Forecast by End User, 2020-2035
  • Table 17: Eastern Europe Smart Water Monitoring Market Value (USD Mn) Forecast by Country, 2020-2035
  • Table 18: Eastern Europe Smart Water Monitoring Market Value (USD Mn) Forecast by Type , 2020-2035
  • Table 19: Eastern Europe Smart Water Monitoring Market Value (USD Mn) Forecast by Component, 2020-2035
  • Table 20: Eastern Europe Smart Water Monitoring Market Value (USD Mn) Forecast by End User, 2020-2035
  • Table 21: East Asia Smart Water Monitoring Market Value (USD Mn) Forecast by Country, 2020-2035
  • Table 22: East Asia Smart Water Monitoring Market Value (USD Mn) Forecast by Type , 2020-2035
  • Table 23: East Asia Smart Water Monitoring Market Value (USD Mn) Forecast by Component, 2020-2035
  • Table 24: East Asia Smart Water Monitoring Market Value (USD Mn) Forecast by End User, 2020-2035
  • Table 25: South Asia and Pacific Smart Water Monitoring Market Value (USD Mn) Forecast by Country, 2020-2035
  • Table 26: South Asia and Pacific Smart Water Monitoring Market Value (USD Mn) Forecast by Type , 2020-2035
  • Table 27: South Asia and Pacific Smart Water Monitoring Market Value (USD Mn) Forecast by Component, 2020-2035
  • Table 28: South Asia and Pacific Smart Water Monitoring Market Value (USD Mn) Forecast by End User, 2020-2035
  • Table 29: Middle East & Africa Smart Water Monitoring Market Value (USD Mn) Forecast by Country, 2020-2035
  • Table 30: Middle East & Africa Smart Water Monitoring Market Value (USD Mn) Forecast by Type , 2020-2035
  • Table 31: Middle East & Africa Smart Water Monitoring Market Value (USD Mn) Forecast by Component, 2020-2035
  • Table 32: Middle East & Africa Smart Water Monitoring Market Value (USD Mn) Forecast by End User, 2020-2035

List of Figures

  • Figure 1: Global Smart Water Monitoring Market Pricing Analysis
  • Figure 2: Global Smart Water Monitoring Market Value (USD Mn) Forecast 2020–2035
  • Figure 3: Global Smart Water Monitoring Market Value Share and BPS Analysis by Type , 2025 and 2035
  • Figure 4: Global Smart Water Monitoring Market Y-o-Y Growth Comparison by Type , 2025–2035
  • Figure 5: Global Smart Water Monitoring Market Attractiveness Analysis by Type
  • Figure 6: Global Smart Water Monitoring Market Value Share and BPS Analysis by Component, 2025 and 2035
  • Figure 7: Global Smart Water Monitoring Market Y-o-Y Growth Comparison by Component, 2025–2035
  • Figure 8: Global Smart Water Monitoring Market Attractiveness Analysis by Component
  • Figure 9: Global Smart Water Monitoring Market Value Share and BPS Analysis by End User, 2025 and 2035
  • Figure 10: Global Smart Water Monitoring Market Y-o-Y Growth Comparison by End User, 2025–2035
  • Figure 11: Global Smart Water Monitoring Market Attractiveness Analysis by End User
  • Figure 12: Global Smart Water Monitoring Market Value (USD Mn) Share and BPS Analysis by Region, 2025 and 2035
  • Figure 13: Global Smart Water Monitoring Market Y-o-Y Growth Comparison by Region, 2025–2035
  • Figure 14: Global Smart Water Monitoring Market Attractiveness Analysis by Region
  • Figure 15: North America Smart Water Monitoring Market Incremental Dollar Opportunity, 2025–2035
  • Figure 16: Latin America Smart Water Monitoring Market Incremental Dollar Opportunity, 2025–2035
  • Figure 17: Western Europe Smart Water Monitoring Market Incremental Dollar Opportunity, 2025–2035
  • Figure 18: Eastern Europe Smart Water Monitoring Market Incremental Dollar Opportunity, 2025–2035
  • Figure 19: East Asia Smart Water Monitoring Market Incremental Dollar Opportunity, 2025–2035
  • Figure 20: South Asia and Pacific Smart Water Monitoring Market Incremental Dollar Opportunity, 2025–2035
  • Figure 21: Middle East & Africa Smart Water Monitoring Market Incremental Dollar Opportunity, 2025–2035
  • Figure 22: North America Smart Water Monitoring Market Value Share and BPS Analysis by Country, 2025 and 2035
  • Figure 23: North America Smart Water Monitoring Market Value Share and BPS Analysis by Type , 2025 and 2035
  • Figure 24: North America Smart Water Monitoring Market Y-o-Y Growth Comparison by Type , 2025–2035
  • Figure 25: North America Smart Water Monitoring Market Attractiveness Analysis by Type
  • Figure 26: North America Smart Water Monitoring Market Value Share and BPS Analysis by Component, 2025 and 2035
  • Figure 27: North America Smart Water Monitoring Market Y-o-Y Growth Comparison by Component, 2025–2035
  • Figure 28: North America Smart Water Monitoring Market Attractiveness Analysis by Component
  • Figure 29: North America Smart Water Monitoring Market Value Share and BPS Analysis by End User, 2025 and 2035
  • Figure 30: North America Smart Water Monitoring Market Y-o-Y Growth Comparison by End User, 2025–2035
  • Figure 31: North America Smart Water Monitoring Market Attractiveness Analysis by End User
  • Figure 32: Latin America Smart Water Monitoring Market Value Share and BPS Analysis by Country, 2025 and 2035
  • Figure 33: Latin America Smart Water Monitoring Market Value Share and BPS Analysis by Type , 2025 and 2035
  • Figure 34: Latin America Smart Water Monitoring Market Y-o-Y Growth Comparison by Type , 2025–2035
  • Figure 35: Latin America Smart Water Monitoring Market Attractiveness Analysis by Type
  • Figure 36: Latin America Smart Water Monitoring Market Value Share and BPS Analysis by Component, 2025 and 2035
  • Figure 37: Latin America Smart Water Monitoring Market Y-o-Y Growth Comparison by Component, 2025–2035
  • Figure 38: Latin America Smart Water Monitoring Market Attractiveness Analysis by Component
  • Figure 39: Latin America Smart Water Monitoring Market Value Share and BPS Analysis by End User, 2025 and 2035
  • Figure 40: Latin America Smart Water Monitoring Market Y-o-Y Growth Comparison by End User, 2025–2035
  • Figure 41: Latin America Smart Water Monitoring Market Attractiveness Analysis by End User
  • Figure 42: Western Europe Smart Water Monitoring Market Value Share and BPS Analysis by Country, 2025 and 2035
  • Figure 43: Western Europe Smart Water Monitoring Market Value Share and BPS Analysis by Type , 2025 and 2035
  • Figure 44: Western Europe Smart Water Monitoring Market Y-o-Y Growth Comparison by Type , 2025–2035
  • Figure 45: Western Europe Smart Water Monitoring Market Attractiveness Analysis by Type
  • Figure 46: Western Europe Smart Water Monitoring Market Value Share and BPS Analysis by Component, 2025 and 2035
  • Figure 47: Western Europe Smart Water Monitoring Market Y-o-Y Growth Comparison by Component, 2025–2035
  • Figure 48: Western Europe Smart Water Monitoring Market Attractiveness Analysis by Component
  • Figure 49: Western Europe Smart Water Monitoring Market Value Share and BPS Analysis by End User, 2025 and 2035
  • Figure 50: Western Europe Smart Water Monitoring Market Y-o-Y Growth Comparison by End User, 2025–2035
  • Figure 51: Western Europe Smart Water Monitoring Market Attractiveness Analysis by End User
  • Figure 52: Eastern Europe Smart Water Monitoring Market Value Share and BPS Analysis by Country, 2025 and 2035
  • Figure 53: Eastern Europe Smart Water Monitoring Market Value Share and BPS Analysis by Type , 2025 and 2035
  • Figure 54: Eastern Europe Smart Water Monitoring Market Y-o-Y Growth Comparison by Type , 2025–2035
  • Figure 55: Eastern Europe Smart Water Monitoring Market Attractiveness Analysis by Type
  • Figure 56: Eastern Europe Smart Water Monitoring Market Value Share and BPS Analysis by Component, 2025 and 2035
  • Figure 57: Eastern Europe Smart Water Monitoring Market Y-o-Y Growth Comparison by Component, 2025–2035
  • Figure 58: Eastern Europe Smart Water Monitoring Market Attractiveness Analysis by Component
  • Figure 59: Eastern Europe Smart Water Monitoring Market Value Share and BPS Analysis by End User, 2025 and 2035
  • Figure 60: Eastern Europe Smart Water Monitoring Market Y-o-Y Growth Comparison by End User, 2025–2035
  • Figure 61: Eastern Europe Smart Water Monitoring Market Attractiveness Analysis by End User
  • Figure 62: East Asia Smart Water Monitoring Market Value Share and BPS Analysis by Country, 2025 and 2035
  • Figure 63: East Asia Smart Water Monitoring Market Value Share and BPS Analysis by Type , 2025 and 2035
  • Figure 64: East Asia Smart Water Monitoring Market Y-o-Y Growth Comparison by Type , 2025–2035
  • Figure 65: East Asia Smart Water Monitoring Market Attractiveness Analysis by Type
  • Figure 66: East Asia Smart Water Monitoring Market Value Share and BPS Analysis by Component, 2025 and 2035
  • Figure 67: East Asia Smart Water Monitoring Market Y-o-Y Growth Comparison by Component, 2025–2035
  • Figure 68: East Asia Smart Water Monitoring Market Attractiveness Analysis by Component
  • Figure 69: East Asia Smart Water Monitoring Market Value Share and BPS Analysis by End User, 2025 and 2035
  • Figure 70: East Asia Smart Water Monitoring Market Y-o-Y Growth Comparison by End User, 2025–2035
  • Figure 71: East Asia Smart Water Monitoring Market Attractiveness Analysis by End User
  • Figure 72: South Asia and Pacific Smart Water Monitoring Market Value Share and BPS Analysis by Country, 2025 and 2035
  • Figure 73: South Asia and Pacific Smart Water Monitoring Market Value Share and BPS Analysis by Type , 2025 and 2035
  • Figure 74: South Asia and Pacific Smart Water Monitoring Market Y-o-Y Growth Comparison by Type , 2025–2035
  • Figure 75: South Asia and Pacific Smart Water Monitoring Market Attractiveness Analysis by Type
  • Figure 76: South Asia and Pacific Smart Water Monitoring Market Value Share and BPS Analysis by Component, 2025 and 2035
  • Figure 77: South Asia and Pacific Smart Water Monitoring Market Y-o-Y Growth Comparison by Component, 2025–2035
  • Figure 78: South Asia and Pacific Smart Water Monitoring Market Attractiveness Analysis by Component
  • Figure 79: South Asia and Pacific Smart Water Monitoring Market Value Share and BPS Analysis by End User, 2025 and 2035
  • Figure 80: South Asia and Pacific Smart Water Monitoring Market Y-o-Y Growth Comparison by End User, 2025–2035
  • Figure 81: South Asia and Pacific Smart Water Monitoring Market Attractiveness Analysis by End User
  • Figure 82: Middle East & Africa Smart Water Monitoring Market Value Share and BPS Analysis by Country, 2025 and 2035
  • Figure 83: Middle East & Africa Smart Water Monitoring Market Value Share and BPS Analysis by Type , 2025 and 2035
  • Figure 84: Middle East & Africa Smart Water Monitoring Market Y-o-Y Growth Comparison by Type , 2025–2035
  • Figure 85: Middle East & Africa Smart Water Monitoring Market Attractiveness Analysis by Type
  • Figure 86: Middle East & Africa Smart Water Monitoring Market Value Share and BPS Analysis by Component, 2025 and 2035
  • Figure 87: Middle East & Africa Smart Water Monitoring Market Y-o-Y Growth Comparison by Component, 2025–2035
  • Figure 88: Middle East & Africa Smart Water Monitoring Market Attractiveness Analysis by Component
  • Figure 89: Middle East & Africa Smart Water Monitoring Market Value Share and BPS Analysis by End User, 2025 and 2035
  • Figure 90: Middle East & Africa Smart Water Monitoring Market Y-o-Y Growth Comparison by End User, 2025–2035
  • Figure 91: Middle East & Africa Smart Water Monitoring Market Attractiveness Analysis by End User
  • Figure 92: Global Smart Water Monitoring Market – Tier Structure Analysis
  • Figure 93: Global Smart Water Monitoring Market – Company Share Analysis

Frequently Asked Questions

How big is the smart water monitoring market in 2025?

The global smart water monitoring market is estimated to be valued at USD 18.4 billion in 2025.

What will be the size of smart water monitoring market in 2035?

The market size for the smart water monitoring market is projected to reach USD 67.6 billion by 2035.

How much will be the smart water monitoring market growth between 2025 and 2035?

The smart water monitoring market is expected to grow at a 13.9% CAGR between 2025 and 2035.

What are the key product types in the smart water monitoring market?

The key product types in smart water monitoring market are quantitative monitoring and qualitative monitoring.

Which component segment to contribute significant share in the smart water monitoring market in 2025?

In terms of component, hardware segment to command 47.3% share in the smart water monitoring market in 2025.

Explore Similar Insights

Future Market Insights

Smart Water Monitoring Market

Chat With

MaRIA

Hi There, I am MaRIA, Your Market Research Intelligence Assistant. How may I help you?