Smart Welding Monitoring Solution Market Forecast and Outlook 2025 to 2035

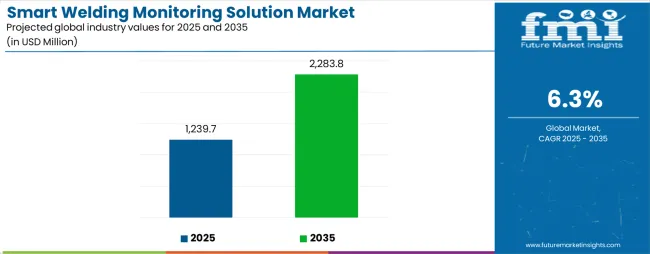
The smart welding monitoring solution market is set to grow from USD 1,239.7 million in 2025 to USD 2,283.8 million by 2035, reflecting a CAGR of 6.3%. The market demonstrates clear phases of acceleration and deceleration shaped by adoption patterns, technological improvements, and regional deployment. From 2025 to 2028, growth accelerates as manufacturers in automotive, shipbuilding, aerospace, and heavy machinery adopt smart monitoring solutions to improve weld quality, reduce defects, and increase operational efficiency. Early adoption is supported by integration with digital manufacturing systems and real-time analytics, producing a sharp upward trend in the market curve.
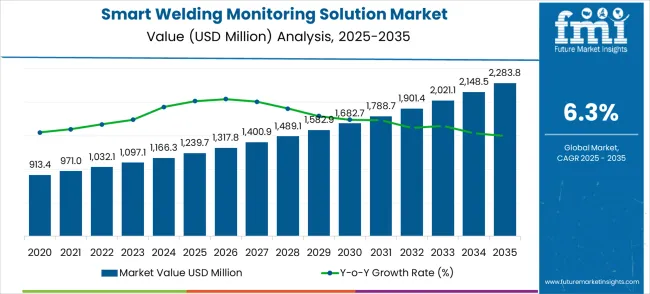
Smart Welding Monitoring Solution Market Market Value Analysis

Quick Stats for Smart Welding Monitoring Solution Market

  • Smart Welding Monitoring Solution Market Value (2025): USD 1,239.7 million
  • Smart Welding Monitoring Solution Market Forecast Value (2035): USD 2,283.8 million
  • Smart Welding Monitoring Solution Market Forecast CAGR: 6.3%
  • Leading Solution Type in Smart Welding Monitoring Solution Market: Real-Time Monitoring Systems (47.0%)
  • Leading Application in Smart Welding Monitoring Solution Market: Automotive (42.0%)
  • Key Growth Regions in Smart Welding Monitoring Solution Market: China, India, and Germany
  • Top Key Players in Smart Welding Monitoring Solution Market: Framatome, SmartWeld, Lincoln Electric, Computer Weld Technology (CWT), Lorch, Megmeet, Cavitar, Novarc Technologies, Fronius, VITRONIC, ESAB, KUKA, DAIHEN Corporation, Xiris Automation, Precitec GmbH, TWI Ltd

Smart Welding Monitoring Solution Market Industry Value Analysis

Between 2028 and 2032, growth decelerates slightly as early adopters reach full-scale deployment, with incremental expansion coming from system upgrades, replacements, and adoption in mid-sized industrial operations. The pace moderates but remains positive as the technology becomes more widespread. From 2032 to 2035, acceleration resumes with investment from emerging regions and new industrial players. Enhancements such as AI-driven analytics, cloud-based monitoring, and predictive maintenance boost adoption. The acceleration and deceleration pattern illustrates a market that experiences initial rapid growth, a mid-period stabilization, and renewed expansion in the latter phase, providing a roadmap for manufacturers to align production, technology development, and market deployment strategies over the decade.

Recent innovations include real-time monitoring systems, AI-driven defect detection, and IoT-enabled process control. Manufacturers are introducing modular, wireless, and cloud-connected solutions to improve traceability and efficiency. Expansion into automated production lines, remote inspection, and smart factories is driving adoption. Collaborations between solution providers and industrial OEMs enable customized monitoring systems for accuracy, process optimization, and quality assurance, supporting consistent market growth worldwide.

The market for smart welding monitoring solutions is distributed across automotive manufacturing (35%), heavy machinery and construction equipment (25%), shipbuilding and marine fabrication (15%), aerospace and defense manufacturing (12%), and specialized industrial applications such as oil and gas pipelines (13%). Automotive manufacturing leads adoption due to the demand for consistent weld quality, reduced defects, and automation integration. Heavy machinery and construction equipment manufacturers deploy monitoring solutions to ensure structural integrity in high-stress components. Shipbuilding and marine fabrication rely on these systems for corrosion-resistant and precision welds, while aerospace and defense industries implement them for safety-critical assemblies. Specialty industrial applications focus on pipeline, pressure vessel, and energy infrastructure welding quality.

Smart Welding Monitoring Solution Market Key Takeaways

Metric Value
Market Value (2025) USD 1,239.7 million
Market Forecast Value (2035) USD 2,283.8 million
Forecast CAGR (2025 to 2035) 6.3%

Why is the Smart Welding Monitoring Solution Market Growing?

Market expansion is being supported by the rapid advancement of industrial automation across developing economies and the corresponding need for intelligent monitoring systems for welding quality assurance in manufacturing facilities. Modern welding operations require precise process monitoring and defect detection to ensure optimal product quality and operational efficiency. The superior monitoring capabilities and real-time analysis characteristics of smart welding monitoring solutions make them essential systems in demanding manufacturing environments where welding quality is critical.

The growing emphasis on quality control and operational efficiency is driving demand for advanced monitoring technologies from certified manufacturers with proven track records of reliability and accuracy. Manufacturing operators are increasingly investing in high-quality monitoring systems that offer real-time analysis and predictive maintenance capabilities over extended production periods. Quality standards and industry certifications are establishing performance benchmarks that favor precision-engineered smart welding monitoring solutions with advanced analytical capabilities.

Segmental Analysis

The market is segmented by solution type, application, and region. By solution type, the market is divided into real-time monitoring systems, IoT-integrated platforms, welding management software, and others. Based on application, the market is categorized into automotive, aerospace, construction, shipbuilding, energy sector, and others. Regionally, the market is divided into North America, Europe, East Asia, South Asia & Pacific, Latin America, and Middle East & Africa.
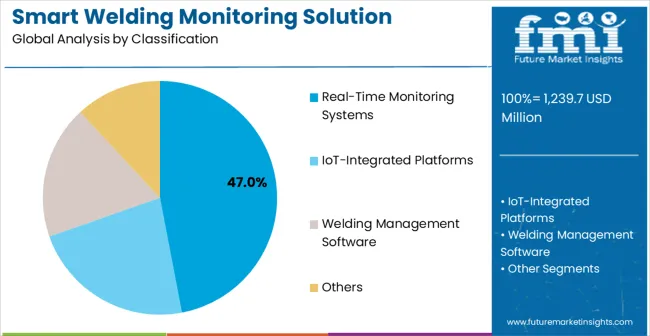
By Solution Type, Real-Time Monitoring Systems Segment Accounts for 47% Market Share

Smart Welding Monitoring Solution Market Analysis By Classification

Real-time monitoring systems are projected to account for 47% of the smart welding monitoring solution market in 2025. This leading share is supported by the increasing demand for immediate quality feedback in manufacturing applications and growing requirements for continuous process monitoring. Real-time monitoring systems provide instantaneous weld quality assessment and process optimization, making them the preferred choice for automotive production lines, aerospace manufacturing, and critical infrastructure applications. The segment benefits from technological advancements that have improved the accuracy and responsiveness of real-time monitoring systems while reducing implementation complexity.

Modern real-time monitoring systems incorporate advanced sensors, high-speed data processing, and sophisticated algorithms that enable immediate defect detection and process adjustment. These innovations have significantly improved welding quality while reducing total cost of ownership through prevention of defective welds and elimination of rework costs. The automotive and aerospace sectors particularly drive demand for real-time monitoring solutions, as these industries require absolute quality assurance to maintain product integrity and comply with stringent safety standards.
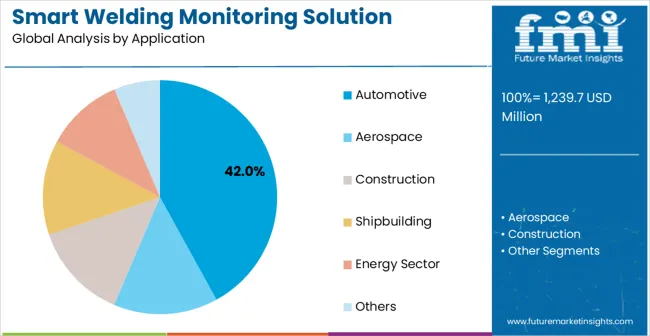
By Application, Automotive Segment Accounts for 42% Market Share

Smart Welding Monitoring Solution Market Analysis By Application

Automotive applications are expected to represent 42% of smart welding monitoring solution demand in 2025. This dominant share reflects the critical role of welding quality in automotive manufacturing and the need for robust monitoring solutions capable of ensuring consistent weld quality in high-volume production environments. Automotive manufacturing facilities require effective and reliable monitoring systems for body-in-white assembly, chassis welding, and component fabrication. The segment benefits from ongoing expansion of automotive production in developing countries and increasing quality requirements demanding enhanced monitoring systems in vehicle manufacturing facilities.

Automotive manufacturing operations demand exceptional monitoring performance to ensure vehicle safety and regulatory compliance. These applications require systems capable of handling high production speeds, multiple welding processes, and continuous operation in demanding manufacturing conditions. The growing emphasis on automotive safety standards, particularly in electric vehicle manufacturing and lightweight material applications, drives consistent demand for high-performance welding monitoring solutions. Emerging markets in Asia-Pacific, Latin America, and European regions contribute significantly to market growth as automotive manufacturers invest in modern monitoring technologies to improve production quality and efficiency.

What are the Drivers, Restraints, and Key Trends of the Smart Welding Monitoring Solution Market?

The smart welding monitoring solution market is advancing rapidly due to increasing manufacturing automation and growing recognition of quality control technology importance. The market faces challenges including high system integration costs, need for specialized technical expertise, and varying monitoring requirements across different welding applications. Standardization efforts and certification programs continue to influence technology quality and market development patterns.

Integration of Artificial Intelligence and Machine Learning Technologies

The growing deployment of AI-powered analysis systems and machine learning algorithms is enabling predictive quality assessment and automated process optimization capabilities in smart welding monitoring installations. Advanced analytics and intelligent decision-making systems provide continuous learning from welding data while optimizing process parameters and extending equipment performance. These technologies are particularly valuable for complex manufacturing facilities that require adaptive monitoring performance and minimal human intervention.

Development of Cloud-Connected and Industry 4.0 Compatible Solutions

Modern monitoring solution manufacturers are incorporating cloud connectivity and Industry 4.0 integration technologies that enable remote monitoring capabilities while facilitating data analytics and process optimization through connected manufacturing systems. Integration of edge computing and advanced communication protocols enables comprehensive data management and significant operational insights compared to traditional standalone monitoring systems. Advanced software platforms and connectivity solutions also support development of more integrated and scalable monitoring architectures for demanding industrial environments.
Analysis of Smart Welding Monitoring Solution Market by Key Country

Smart Welding Monitoring Solution Market Cagr Analysis By Country

Country CAGR (2025-2035)
China 8.5%
India 7.9%
Germany 7.2%
Brazil 6.6%
United States 6.0%
United Kingdom 5.4%
Japan 4.7%

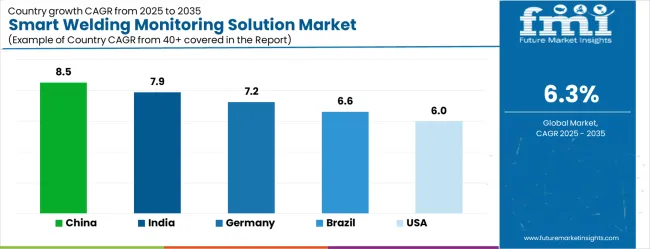
The smart welding monitoring solution market is growing rapidly, with China leading at an 8.5% CAGR through 2035, driven by massive manufacturing automation expansion, industrial digitalization programs, and smart factory development. India follows at 7.9%, supported by rising manufacturing investments and increasing adoption of automated quality control systems in welding operations. Germany records strong growth at 7.2%, emphasizing precision engineering, Industry 4.0 implementation, and advanced manufacturing capabilities. Brazil grows steadily at 6.6%, integrating smart monitoring systems into expanding automotive and industrial manufacturing facilities. The United States shows moderate growth at 6.0%, focusing on technology innovation and manufacturing modernization improvements. The United Kingdom maintains steady expansion at 5.4%, supported by industrial automation programs. Japan demonstrates stable growth at 4.7%, emphasizing technological innovation and manufacturing excellence.

The report covers an in-depth analysis of 40+ countries, Top-performing countries are highlighted below.

Growth Analysis of Smart Welding Monitoring Solution Market in China

The market for smart welding monitoring solutions in China is expanding at a CAGR of 8.5%, above the global average. Growth is driven by automated welding adoption in automotive, shipbuilding, and industrial equipment sectors. Advanced monitoring systems provide real-time defect detection, improve process control, and boost production efficiency. Industrial clusters and high-tech manufacturing zones integrate IoT-enabled welding systems to optimize throughput. Pilot programs demonstrate reduced rework and improved material handling. Suppliers focus on scalability, predictive maintenance, and software integration for high-volume production. Collaboration with research institutions advances sensor technology and monitoring algorithms, enabling reliable operation in demanding manufacturing conditions.

  • Automotive production lines achieve higher weld consistency with real-time monitoring.
  • Shipbuilding operations reduce defects and downtime through automated systems.
  • Pilot implementations improve workflow efficiency and material utilization.

Market Forecast of Smart Welding Monitoring Solution Market in India

India is expected to grow at a CAGR of 7.9%, above the global average. Growth is fueled by adoption in construction equipment, automotive, and industrial fabrication industries. Smart monitoring systems track weld quality, reduce scrap, and automate maintenance schedules. Industrial hubs deploy these solutions for both large-scale and small-scale production facilities. Pilot installations show increased efficiency, fewer defects, and faster cycle times. Suppliers provide cost-effective, precise systems suitable for high-volume manufacturing. Public-private partnerships enhance skill development and technology adoption, supporting wider implementation across regional industrial clusters.
  • Construction and automotive sectors achieve lower scrap rates with monitoring.
  • Pilot installations demonstrate improved workflow consistency.
  • Industrial hubs integrate predictive maintenance to increase operational uptime.

Deployment Trends of Smart Welding Monitoring Solution Market in Germany

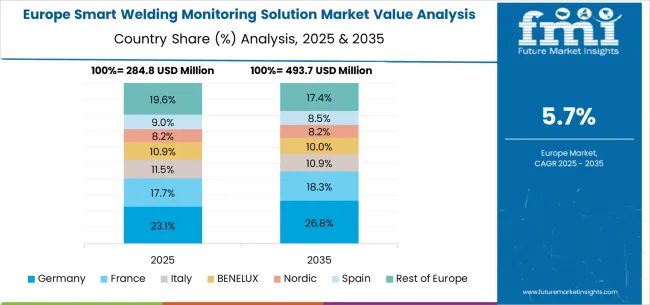
Smart Welding Monitoring Solution Market Europe Country Market Share Analysis, 2025 & 2035

Germany grows at a CAGR of 7.2%, above the global average. Growth is driven by automotive, aerospace, and industrial equipment sectors requiring high-accuracy welding processes. Smart monitoring solutions are applied for real-time quality checks, defect detection, and process optimization. Suppliers provide energy-efficient systems with precise controls and long-term reliability. Industrial collaborations improve defect detection algorithms and sensor performance. Pilot installations reduce material waste and increase production throughput. Regulatory requirements for safety and quality drive adoption in high-value manufacturing lines.

  • Aerospace and automotive facilities achieve higher weld precision with monitoring.
  • Pilot programs reduce material waste and improve output.
  • Industrial collaborations enhance sensor reliability and detection accuracy.

Future Outlook of Smart Welding Monitoring Solution Market in Brazil

The Brazilian market grows at a CAGR of 6.6%, slightly above the global average. Adoption is supported by shipbuilding, automotive, and industrial fabrication industries. Smart monitoring solutions improve weld quality, process efficiency, and reduce downtime. Industrial clusters integrate these systems to increase throughput and maintain consistent production. Suppliers offer durable solutions suitable for tropical conditions and high-volume manufacturing. Pilot projects demonstrate enhanced precision and reduced operational delays. Local training programs and distributor support improve deployment efficiency, while regional research initiatives refine sensor accuracy and analytics for welding operations.
  • Shipbuilding and automotive sectors improve weld accuracy with monitoring.
  • Pilot installations validate consistent output and reduced downtime.
  • Analytics and sensor improvements strengthen defect detection capability.

Growth Forecast of Smart Welding Monitoring Solution Market in the United States

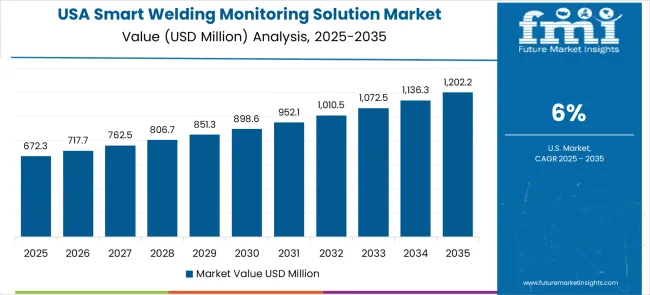
Smart Welding Monitoring Solution Market Country Value Analysis

The United States grows at a CAGR of 6.0%, slightly below the global average. Growth is moderated by mature infrastructure and existing adoption of automated welding systems. Smart monitoring solutions are applied in automotive, aerospace, and industrial sectors to reduce defects and improve productivity. Suppliers provide high-reliability systems with precise control and predictive maintenance features. Pilot projects show fewer defects, higher throughput, and optimized resource use. Industrial hubs implement monitoring across multiple production lines for better operational performance. R&D continues to refine sensor accuracy, process analytics, and energy efficiency.

  • Automotive and aerospace production reduces defects with monitoring solutions.
  • Pilot programs improve throughput and workflow consistency.
  • Multi-line integration enhances overall production performance.

Smart Welding Monitoring Solution Market Outlook in the United Kingdom

The UK market grows at a CAGR of 5.4%, below the global average. Slower adoption is due to limited expansion of manufacturing facilities and reliance on imported technology. Systems are used in automotive, shipbuilding, and specialized industrial operations. Suppliers provide reliable, precise machines that integrate with existing production lines. Pilot installations demonstrate higher weld quality, reduced rework, and improved operational efficiency. Industrial clusters gradually deploy monitoring solutions, focusing on high-value production and research applications. Training programs help operators achieve optimal system performance.
  • Automotive workshops improve weld quality and reduce rework with monitoring.
  • Pilot projects demonstrate better line efficiency and consistency.
  • Research facilities adopt monitoring for precision manufacturing tasks.

Regional Analysis of Smart Welding Monitoring Solution Market in Japan

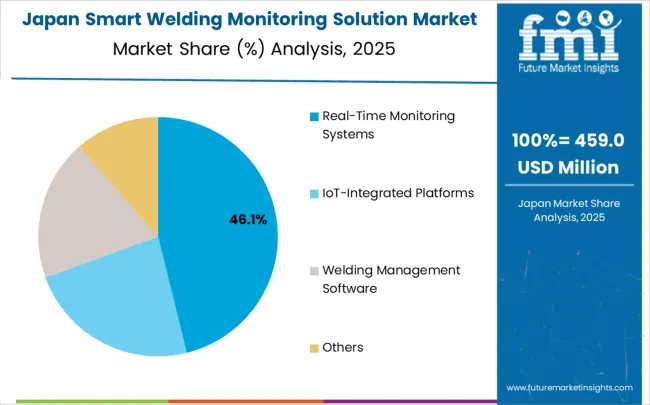
Smart Welding Monitoring Solution Market Japan Market Share Analysis By Classification

Japan grows at a CAGR of 4.7%, below the global average. Slower growth results from a mature industrial sector and limited new adoption. Smart monitoring solutions are applied in automotive, electronics, and industrial production for process improvement. Suppliers provide durable, precise systems suitable for high-value applications. Pilot programs show improved weld consistency and reduced downtime. Industrial clusters integrate monitoring solutions into automated lines for better workflow. R&D initiatives continue to enhance sensor accuracy, process analytics, and operational reliability in demanding environments.
  • Electronics and automotive production benefit from consistent weld quality.
  • Pilot installations reduce downtime and enhance efficiency.
  • Automated production lines integrate monitoring systems to improve workflow.

Competitive Landscape of Smart Welding Monitoring Solution Market

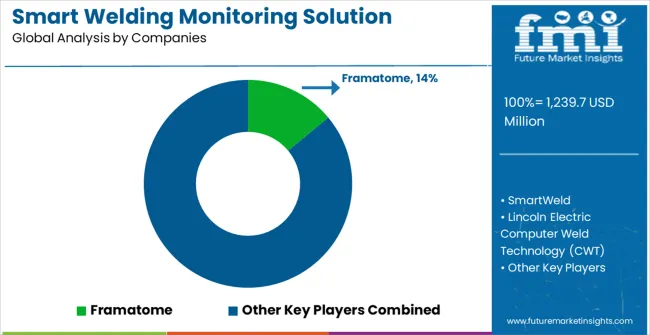
Smart Welding Monitoring Solution Market Analysis By Company

The smart welding monitoring solution market is defined by competition among established industrial automation manufacturers, specialized welding technology companies, and emerging IoT solution providers. Companies are investing in advanced sensor technologies, artificial intelligence integration, standardized quality systems, and technical support capabilities to deliver reliable, intelligent, and cost-effective monitoring solutions. Strategic partnerships, technological advancement, and geographic expansion are central to strengthening product portfolios and market presence.

Framatome, operating globally, offers comprehensive welding monitoring solutions with focus on precision measurement, reliability, and technical support services. SmartWeld, specialized provider, delivers innovative monitoring systems with emphasis on real-time analysis and application integration capabilities. Lincoln Electric, multinational manufacturer, provides advanced monitoring technologies with focus on welding process optimization and system integration. Computer Weld Technology (CWT) offers comprehensive monitoring solutions with standardized procedures and technical service support.

Lorch provides industrial welding monitoring systems with emphasis on advanced technology and technical expertise. Megmeet delivers specialized monitoring equipment with focus on high-performance industrial applications. Cavitar, Novarc Technologies, Fronius offer comprehensive monitoring technologies for demanding manufacturing environments with established development and service capabilities.

VITRONIC, ESAB, KUKA, DAIHEN Corporation, Xiris Automation, Precitec GmbH, and TWI Ltd provide advanced monitoring systems with global manufacturing capabilities, regional service networks, and specialized expertise across industrial automation and welding technology sectors.

Global Smart Welding Monitoring Solution Market - Stakeholder Contribution Framework

The smart welding monitoring solution market underpins manufacturing quality excellence, industrial automation advancement, production efficiency optimization, and Industry 4.0 implementation. With automation mandates, stricter quality requirements, and demand for real-time monitoring systems, the sector must balance cost competitiveness, technology reliability, and integration capabilities. Coordinated contributions from governments, industry bodies, OEMs/technology integrators, suppliers, and investors will accelerate the transition toward AI-powered, cloud-connected, and digitally integrated smart welding monitoring systems.

How Governments Could Spur Market Growth and Adoption

  • Manufacturing Modernization Incentives: Provide subsidies or tax credits for manufacturers upgrading to smart or AI-integrated welding monitoring solutions.
  • Quality Standards: Enforce stringent manufacturing quality, safety compliance, and automation standards, boosting demand in automotive, aerospace, and industrial sectors.
  • Industry 4.0 Programs: Embed smart monitoring technologies into manufacturing digitalization initiatives, smart factory projects, and industrial automation enhancement programs.
  • Trade Facilitation: Lower tariffs for importing high-tech sensors and monitoring components while supporting local exports of integrated monitoring systems.
  • Innovation Mandates: Recognize advanced and intelligent monitoring solutions within national manufacturing competitiveness and industrial development frameworks.

How Industry Bodies Could Support Market Development

  • Standardization & Certification: Develop harmonized guidelines for monitoring accuracy, integration protocols, and safety compliance testing procedures.
  • Training & Workforce Development: Create curricula for system operation, data analysis, and advanced monitoring technologies to reduce skill shortages.
  • Global Recognition: Position regional manufacturers as leaders in intelligent and digitally integrated welding monitoring solutions.
  • Policy Advocacy: Engage with manufacturing regulators to shape favorable procurement policies and inclusion of smart monitoring in industry standards.

How OEMs and Technology Integrators Could Strengthen the Ecosystem

  • Technology Integration: Embed AI analytics, cloud connectivity, and predictive maintenance into welding monitoring systems.
  • Partnerships: Collaborate with automotive manufacturers, aerospace companies, and industrial fabricators to design application-specific monitoring configurations.
  • Product Innovation: Advance real-time analysis capabilities, IoT integration, and enhanced sensor technologies.
  • Comprehensive Solutions: Bundle monitoring systems with complete welding automation platforms, offering end-to-end manufacturing effectiveness.

How Suppliers Could Navigate the Market Evolution

  • Advanced Components: Provide high-precision sensors, AI processors, and connectivity-enabling components to extend monitoring capabilities.
  • Localized Manufacturing: Establish regional production facilities to reduce logistics costs and lead times.
  • Portfolio Diversification: Expand into specialty monitoring components, industry-specific solutions, and cloud-based analytics platforms.
  • Customer Engagement: Build trust via technology traceability, performance guarantees, and comprehensive technical service excellence.

How Investors and Financial Enablers Could Unlock Value

  • Infrastructure Financing: Fund monitoring technology facilities, regional service centers, and production plants in high-growth manufacturing markets.
  • Innovation Finance: Channel technology-linked capital toward AI-powered and cloud-connected welding monitoring solutions.
  • M&A and Consolidation: Back cross-border mergers to integrate fragmented regional players into scalable global technology suppliers.
  • Technology Funding: Support startups developing advanced analytics software, IoT integration platforms, or specialized monitoring applications.
  • Risk Management Tools: Provide insurance and hedging products against technology cost volatility and market fluctuation risks.

Key Players in the Smart Welding Monitoring Solution Market

  • Framatome
  • SmartWeld
  • Lincoln Electric
  • Computer Weld Technology (CWT)
  • Lorch
  • Megmeet
  • Cavitar
  • Novarc Technologies
  • Fronius
  • VITRONIC
  • ESAB
  • KUKA
  • DAIHEN Corporation
  • Xiris Automation
  • Precitec GmbH
  • TWI Ltd

Scope of the Report

Item Value
Quantitative Units USD 1,239.7 million
Solution Type Real-Time Monitoring Systems, IoT-Integrated Platforms, Welding Management Software, Others
Application Automotive, Aerospace, Construction, Shipbuilding, Energy Sector, Others
Regions Covered North America, Europe, East Asia, South Asia & Pacific, Latin America, Middle East & Africa
Country Covered United States, Germany, India, China, United Kingdom, Japan, Brazil, and other 40+ countries
Key Companies Profiled Framatome, SmartWeld, Lincoln Electric, Computer Weld Technology (CWT), Lorch, Megmeet, Cavitar, Novarc Technologies, Fronius, VITRONIC, ESAB, KUKA, DAIHEN Corporation, Xiris Automation, Precitec GmbH, TWI Ltd
Additional Attributes Dollar sales by solution type and application segments, regional demand trends across North America, Europe, and Asia-Pacific, competitive landscape with established manufacturers and emerging technology suppliers, buyer preferences for real-time versus predictive monitoring systems, integration with industrial IoT and Industry 4.0 technologies, innovations in sensor technology and artificial intelligence for enhanced accuracy and predictive capabilities, and adoption of cloud-connected monitoring solutions with embedded analytics and remote monitoring capabilities for improved operational efficiency.

Smart Welding Monitoring Solution Market by Segments

Solution Type:

  • Real-Time Monitoring Systems
  • IoT-Integrated Platforms
  • Welding Management Software
  • Others

Application:

  • Automotive
  • Aerospace
  • Construction
  • Shipbuilding
  • Energy Sector
  • Others

Region:

  • North America
    • United States
    • Canada
    • Mexico
  • Europe
    • Germany
    • United Kingdom
    • France
    • Italy
    • Spain
    • Nordic
    • BENELUX
    • Rest of Europe
  • East Asia
    • China
    • Japan
    • South Korea
  • South Asia & Pacific
    • India
    • ASEAN
    • Australia & New Zealand
    • Rest of South Asia & Pacific
  • Latin America
    • Brazil
    • Chile
    • Rest of Latin America
  • Middle East & Africa
    • Kingdom of Saudi Arabia
    • Other GCC Countries
    • Turkey
    • South Africa
    • Other African Union
    • Rest of Middle East & Africa

Table of Content

  1. Executive Summary
    • Global Market Outlook
    • Demand to side Trends
    • Supply to side Trends
    • Technology Roadmap Analysis
    • Analysis and Recommendations
  2. Market Overview
    • Market Coverage / Taxonomy
    • Market Definition / Scope / Limitations
  3. Market Background
    • Market Dynamics
      • Drivers
      • Restraints
      • Opportunity
      • Trends
    • Scenario Forecast
      • Demand in Optimistic Scenario
      • Demand in Likely Scenario
      • Demand in Conservative Scenario
    • Opportunity Map Analysis
    • Product Life Cycle Analysis
    • Supply Chain Analysis
    • Investment Feasibility Matrix
    • Value Chain Analysis
    • PESTLE and Porter’s Analysis
    • Regulatory Landscape
    • Regional Parent Market Outlook
    • Production and Consumption Statistics
    • Import and Export Statistics
  4. Global Market Analysis 2020 to 2024 and Forecast, 2025 to 2035
    • Historical Market Size Value (USD Million) Analysis, 2020 to 2024
    • Current and Future Market Size Value (USD Million) Projections, 2025 to 2035
      • Y to o to Y Growth Trend Analysis
      • Absolute $ Opportunity Analysis
  5. Global Market Pricing Analysis 2020 to 2024 and Forecast 2025 to 2035
  6. Global Market Analysis 2020 to 2024 and Forecast 2025 to 2035, By Classification
    • Introduction / Key Findings
    • Historical Market Size Value (USD Million) Analysis By Classification , 2020 to 2024
    • Current and Future Market Size Value (USD Million) Analysis and Forecast By Classification , 2025 to 2035
      • Real-Time Monitoring Systems
      • IoT-Integrated Platforms
      • Welding Management Software
      • Others
    • Y to o to Y Growth Trend Analysis By Classification , 2020 to 2024
    • Absolute $ Opportunity Analysis By Classification , 2025 to 2035
  7. Global Market Analysis 2020 to 2024 and Forecast 2025 to 2035, By Application
    • Introduction / Key Findings
    • Historical Market Size Value (USD Million) Analysis By Application, 2020 to 2024
    • Current and Future Market Size Value (USD Million) Analysis and Forecast By Application, 2025 to 2035
      • Automotive
      • Aerospace
      • Construction
      • Shipbuilding
      • Energy Sector
      • Others
    • Y to o to Y Growth Trend Analysis By Application, 2020 to 2024
    • Absolute $ Opportunity Analysis By Application, 2025 to 2035
  8. Global Market Analysis 2020 to 2024 and Forecast 2025 to 2035, By Region
    • Introduction
    • Historical Market Size Value (USD Million) Analysis By Region, 2020 to 2024
    • Current Market Size Value (USD Million) Analysis and Forecast By Region, 2025 to 2035
      • North America
      • Latin America
      • Western Europe
      • Eastern Europe
      • East Asia
      • South Asia and Pacific
      • Middle East & Africa
    • Market Attractiveness Analysis By Region
  9. North America Market Analysis 2020 to 2024 and Forecast 2025 to 2035, By Country
    • Historical Market Size Value (USD Million) Trend Analysis By Market Taxonomy, 2020 to 2024
    • Market Size Value (USD Million) Forecast By Market Taxonomy, 2025 to 2035
      • By Country
        • USA
        • Canada
        • Mexico
      • By Classification
      • By Application
    • Market Attractiveness Analysis
      • By Country
      • By Classification
      • By Application
    • Key Takeaways
  10. Latin America Market Analysis 2020 to 2024 and Forecast 2025 to 2035, By Country
    • Historical Market Size Value (USD Million) Trend Analysis By Market Taxonomy, 2020 to 2024
    • Market Size Value (USD Million) Forecast By Market Taxonomy, 2025 to 2035
      • By Country
        • Brazil
        • Chile
        • Rest of Latin America
      • By Classification
      • By Application
    • Market Attractiveness Analysis
      • By Country
      • By Classification
      • By Application
    • Key Takeaways
  11. Western Europe Market Analysis 2020 to 2024 and Forecast 2025 to 2035, By Country
    • Historical Market Size Value (USD Million) Trend Analysis By Market Taxonomy, 2020 to 2024
    • Market Size Value (USD Million) Forecast By Market Taxonomy, 2025 to 2035
      • By Country
        • Germany
        • UK
        • Italy
        • Spain
        • France
        • Nordic
        • BENELUX
        • Rest of Western Europe
      • By Classification
      • By Application
    • Market Attractiveness Analysis
      • By Country
      • By Classification
      • By Application
    • Key Takeaways
  12. Eastern Europe Market Analysis 2020 to 2024 and Forecast 2025 to 2035, By Country
    • Historical Market Size Value (USD Million) Trend Analysis By Market Taxonomy, 2020 to 2024
    • Market Size Value (USD Million) Forecast By Market Taxonomy, 2025 to 2035
      • By Country
        • Russia
        • Poland
        • Hungary
        • Balkan & Baltic
        • Rest of Eastern Europe
      • By Classification
      • By Application
    • Market Attractiveness Analysis
      • By Country
      • By Classification
      • By Application
    • Key Takeaways
  13. East Asia Market Analysis 2020 to 2024 and Forecast 2025 to 2035, By Country
    • Historical Market Size Value (USD Million) Trend Analysis By Market Taxonomy, 2020 to 2024
    • Market Size Value (USD Million) Forecast By Market Taxonomy, 2025 to 2035
      • By Country
        • China
        • Japan
        • South Korea
      • By Classification
      • By Application
    • Market Attractiveness Analysis
      • By Country
      • By Classification
      • By Application
    • Key Takeaways
  14. South Asia and Pacific Market Analysis 2020 to 2024 and Forecast 2025 to 2035, By Country
    • Historical Market Size Value (USD Million) Trend Analysis By Market Taxonomy, 2020 to 2024
    • Market Size Value (USD Million) Forecast By Market Taxonomy, 2025 to 2035
      • By Country
        • India
        • ASEAN
        • Australia & New Zealand
        • Rest of South Asia and Pacific
      • By Classification
      • By Application
    • Market Attractiveness Analysis
      • By Country
      • By Classification
      • By Application
    • Key Takeaways
  15. Middle East & Africa Market Analysis 2020 to 2024 and Forecast 2025 to 2035, By Country
    • Historical Market Size Value (USD Million) Trend Analysis By Market Taxonomy, 2020 to 2024
    • Market Size Value (USD Million) Forecast By Market Taxonomy, 2025 to 2035
      • By Country
        • Kingdom of Saudi Arabia
        • Other GCC Countries
        • Turkiye
        • South Africa
        • Other African Union
        • Rest of Middle East & Africa
      • By Classification
      • By Application
    • Market Attractiveness Analysis
      • By Country
      • By Classification
      • By Application
    • Key Takeaways
  16. Key Countries Market Analysis
    • USA
      • Pricing Analysis
      • Market Share Analysis, 2024
        • By Classification
        • By Application
    • Canada
      • Pricing Analysis
      • Market Share Analysis, 2024
        • By Classification
        • By Application
    • Mexico
      • Pricing Analysis
      • Market Share Analysis, 2024
        • By Classification
        • By Application
    • Brazil
      • Pricing Analysis
      • Market Share Analysis, 2024
        • By Classification
        • By Application
    • Chile
      • Pricing Analysis
      • Market Share Analysis, 2024
        • By Classification
        • By Application
    • Germany
      • Pricing Analysis
      • Market Share Analysis, 2024
        • By Classification
        • By Application
    • UK
      • Pricing Analysis
      • Market Share Analysis, 2024
        • By Classification
        • By Application
    • Italy
      • Pricing Analysis
      • Market Share Analysis, 2024
        • By Classification
        • By Application
    • Spain
      • Pricing Analysis
      • Market Share Analysis, 2024
        • By Classification
        • By Application
    • France
      • Pricing Analysis
      • Market Share Analysis, 2024
        • By Classification
        • By Application
    • India
      • Pricing Analysis
      • Market Share Analysis, 2024
        • By Classification
        • By Application
    • ASEAN
      • Pricing Analysis
      • Market Share Analysis, 2024
        • By Classification
        • By Application
    • Australia & New Zealand
      • Pricing Analysis
      • Market Share Analysis, 2024
        • By Classification
        • By Application
    • China
      • Pricing Analysis
      • Market Share Analysis, 2024
        • By Classification
        • By Application
    • Japan
      • Pricing Analysis
      • Market Share Analysis, 2024
        • By Classification
        • By Application
    • South Korea
      • Pricing Analysis
      • Market Share Analysis, 2024
        • By Classification
        • By Application
    • Russia
      • Pricing Analysis
      • Market Share Analysis, 2024
        • By Classification
        • By Application
    • Poland
      • Pricing Analysis
      • Market Share Analysis, 2024
        • By Classification
        • By Application
    • Hungary
      • Pricing Analysis
      • Market Share Analysis, 2024
        • By Classification
        • By Application
    • Kingdom of Saudi Arabia
      • Pricing Analysis
      • Market Share Analysis, 2024
        • By Classification
        • By Application
    • Turkiye
      • Pricing Analysis
      • Market Share Analysis, 2024
        • By Classification
        • By Application
    • South Africa
      • Pricing Analysis
      • Market Share Analysis, 2024
        • By Classification
        • By Application
  17. Market Structure Analysis
    • Competition Dashboard
    • Competition Benchmarking
    • Market Share Analysis of Top Players
      • By Regional
      • By Classification
      • By Application
  18. Competition Analysis
    • Competition Deep Dive
      • Framatome
        • Overview
        • Product Portfolio
        • Profitability by Market Segments (Product/Age /Sales Channel/Region)
        • Sales Footprint
        • Strategy Overview
          • Marketing Strategy
          • Product Strategy
          • Channel Strategy
      • SmartWeld
      • Lincoln Electric Computer Weld Technology (CWT)
      • Lorch
      • Megmeet
      • Cavitar
      • Novarc Technologies
      • Fronius
      • VITRONIC
      • ESAB
      • KUKA
      • DAIHEN Corporation
      • Xiris Automation
      • Precitec GmbH
      • TWI Ltd
  19. Assumptions & Acronyms Used
  20. Research Methodology

List of Tables

  • Table 1: Global Market Value (USD Million) Forecast by Region, 2020 to 2035
  • Table 2: Global Market Value (USD Million) Forecast by Classification , 2020 to 2035
  • Table 3: Global Market Value (USD Million) Forecast by Application, 2020 to 2035
  • Table 4: North America Market Value (USD Million) Forecast by Country, 2020 to 2035
  • Table 5: North America Market Value (USD Million) Forecast by Classification , 2020 to 2035
  • Table 6: North America Market Value (USD Million) Forecast by Application, 2020 to 2035
  • Table 7: Latin America Market Value (USD Million) Forecast by Country, 2020 to 2035
  • Table 8: Latin America Market Value (USD Million) Forecast by Classification , 2020 to 2035
  • Table 9: Latin America Market Value (USD Million) Forecast by Application, 2020 to 2035
  • Table 10: Western Europe Market Value (USD Million) Forecast by Country, 2020 to 2035
  • Table 11: Western Europe Market Value (USD Million) Forecast by Classification , 2020 to 2035
  • Table 12: Western Europe Market Value (USD Million) Forecast by Application, 2020 to 2035
  • Table 13: Eastern Europe Market Value (USD Million) Forecast by Country, 2020 to 2035
  • Table 14: Eastern Europe Market Value (USD Million) Forecast by Classification , 2020 to 2035
  • Table 15: Eastern Europe Market Value (USD Million) Forecast by Application, 2020 to 2035
  • Table 16: East Asia Market Value (USD Million) Forecast by Country, 2020 to 2035
  • Table 17: East Asia Market Value (USD Million) Forecast by Classification , 2020 to 2035
  • Table 18: East Asia Market Value (USD Million) Forecast by Application, 2020 to 2035
  • Table 19: South Asia and Pacific Market Value (USD Million) Forecast by Country, 2020 to 2035
  • Table 20: South Asia and Pacific Market Value (USD Million) Forecast by Classification , 2020 to 2035
  • Table 21: South Asia and Pacific Market Value (USD Million) Forecast by Application, 2020 to 2035
  • Table 22: Middle East & Africa Market Value (USD Million) Forecast by Country, 2020 to 2035
  • Table 23: Middle East & Africa Market Value (USD Million) Forecast by Classification , 2020 to 2035
  • Table 24: Middle East & Africa Market Value (USD Million) Forecast by Application, 2020 to 2035

List of Figures

  • Figure 1: Global Market Pricing Analysis
  • Figure 2: Global Market Value (USD Million) Forecast 2020-2035
  • Figure 3: Global Market Value Share and BPS Analysis by Classification , 2025 and 2035
  • Figure 4: Global Market Y to o to Y Growth Comparison by Classification , 2025-2035
  • Figure 5: Global Market Attractiveness Analysis by Classification
  • Figure 6: Global Market Value Share and BPS Analysis by Application, 2025 and 2035
  • Figure 7: Global Market Y to o to Y Growth Comparison by Application, 2025-2035
  • Figure 8: Global Market Attractiveness Analysis by Application
  • Figure 9: Global Market Value (USD Million) Share and BPS Analysis by Region, 2025 and 2035
  • Figure 10: Global Market Y to o to Y Growth Comparison by Region, 2025-2035
  • Figure 11: Global Market Attractiveness Analysis by Region
  • Figure 12: North America Market Incremental Dollar Opportunity, 2025-2035
  • Figure 13: Latin America Market Incremental Dollar Opportunity, 2025-2035
  • Figure 14: Western Europe Market Incremental Dollar Opportunity, 2025-2035
  • Figure 15: Eastern Europe Market Incremental Dollar Opportunity, 2025-2035
  • Figure 16: East Asia Market Incremental Dollar Opportunity, 2025-2035
  • Figure 17: South Asia and Pacific Market Incremental Dollar Opportunity, 2025-2035
  • Figure 18: Middle East & Africa Market Incremental Dollar Opportunity, 2025-2035
  • Figure 19: North America Market Value Share and BPS Analysis by Country, 2025 and 2035
  • Figure 20: North America Market Value Share and BPS Analysis by Classification , 2025 and 2035
  • Figure 21: North America Market Y to o to Y Growth Comparison by Classification , 2025-2035
  • Figure 22: North America Market Attractiveness Analysis by Classification
  • Figure 23: North America Market Value Share and BPS Analysis by Application, 2025 and 2035
  • Figure 24: North America Market Y to o to Y Growth Comparison by Application, 2025-2035
  • Figure 25: North America Market Attractiveness Analysis by Application
  • Figure 26: Latin America Market Value Share and BPS Analysis by Country, 2025 and 2035
  • Figure 27: Latin America Market Value Share and BPS Analysis by Classification , 2025 and 2035
  • Figure 28: Latin America Market Y to o to Y Growth Comparison by Classification , 2025-2035
  • Figure 29: Latin America Market Attractiveness Analysis by Classification
  • Figure 30: Latin America Market Value Share and BPS Analysis by Application, 2025 and 2035
  • Figure 31: Latin America Market Y to o to Y Growth Comparison by Application, 2025-2035
  • Figure 32: Latin America Market Attractiveness Analysis by Application
  • Figure 33: Western Europe Market Value Share and BPS Analysis by Country, 2025 and 2035
  • Figure 34: Western Europe Market Value Share and BPS Analysis by Classification , 2025 and 2035
  • Figure 35: Western Europe Market Y to o to Y Growth Comparison by Classification , 2025-2035
  • Figure 36: Western Europe Market Attractiveness Analysis by Classification
  • Figure 37: Western Europe Market Value Share and BPS Analysis by Application, 2025 and 2035
  • Figure 38: Western Europe Market Y to o to Y Growth Comparison by Application, 2025-2035
  • Figure 39: Western Europe Market Attractiveness Analysis by Application
  • Figure 40: Eastern Europe Market Value Share and BPS Analysis by Country, 2025 and 2035
  • Figure 41: Eastern Europe Market Value Share and BPS Analysis by Classification , 2025 and 2035
  • Figure 42: Eastern Europe Market Y to o to Y Growth Comparison by Classification , 2025-2035
  • Figure 43: Eastern Europe Market Attractiveness Analysis by Classification
  • Figure 44: Eastern Europe Market Value Share and BPS Analysis by Application, 2025 and 2035
  • Figure 45: Eastern Europe Market Y to o to Y Growth Comparison by Application, 2025-2035
  • Figure 46: Eastern Europe Market Attractiveness Analysis by Application
  • Figure 47: East Asia Market Value Share and BPS Analysis by Country, 2025 and 2035
  • Figure 48: East Asia Market Value Share and BPS Analysis by Classification , 2025 and 2035
  • Figure 49: East Asia Market Y to o to Y Growth Comparison by Classification , 2025-2035
  • Figure 50: East Asia Market Attractiveness Analysis by Classification
  • Figure 51: East Asia Market Value Share and BPS Analysis by Application, 2025 and 2035
  • Figure 52: East Asia Market Y to o to Y Growth Comparison by Application, 2025-2035
  • Figure 53: East Asia Market Attractiveness Analysis by Application
  • Figure 54: South Asia and Pacific Market Value Share and BPS Analysis by Country, 2025 and 2035
  • Figure 55: South Asia and Pacific Market Value Share and BPS Analysis by Classification , 2025 and 2035
  • Figure 56: South Asia and Pacific Market Y to o to Y Growth Comparison by Classification , 2025-2035
  • Figure 57: South Asia and Pacific Market Attractiveness Analysis by Classification
  • Figure 58: South Asia and Pacific Market Value Share and BPS Analysis by Application, 2025 and 2035
  • Figure 59: South Asia and Pacific Market Y to o to Y Growth Comparison by Application, 2025-2035
  • Figure 60: South Asia and Pacific Market Attractiveness Analysis by Application
  • Figure 61: Middle East & Africa Market Value Share and BPS Analysis by Country, 2025 and 2035
  • Figure 62: Middle East & Africa Market Value Share and BPS Analysis by Classification , 2025 and 2035
  • Figure 63: Middle East & Africa Market Y to o to Y Growth Comparison by Classification , 2025-2035
  • Figure 64: Middle East & Africa Market Attractiveness Analysis by Classification
  • Figure 65: Middle East & Africa Market Value Share and BPS Analysis by Application, 2025 and 2035
  • Figure 66: Middle East & Africa Market Y to o to Y Growth Comparison by Application, 2025-2035
  • Figure 67: Middle East & Africa Market Attractiveness Analysis by Application
  • Figure 68: Global Market - Tier Structure Analysis
  • Figure 69: Global Market - Company Share Analysis

Frequently Asked Questions

How big is the cleanroom and lab surface contamination control products market in 2025?

The global cleanroom and lab surface contamination control products market is estimated to be valued at USD 1,056.4 million in 2025.

What will be the size of cleanroom and lab surface contamination control products market in 2035?

The market size for the cleanroom and lab surface contamination control products market is projected to reach USD 1,519.2 million by 2035.

How much will be the cleanroom and lab surface contamination control products market growth between 2025 and 2035?

The cleanroom and lab surface contamination control products market is expected to grow at a 3.7% CAGR between 2025 and 2035.

What are the key product types in the cleanroom and lab surface contamination control products market?

The key product types in cleanroom and lab surface contamination control products market are sticky/tacky mats, cleanroom flooring systems and others.

Which application segment to contribute significant share in the cleanroom and lab surface contamination control products market in 2025?

In terms of application, semiconductors and electronics segment to command 35.0% share in the cleanroom and lab surface contamination control products market in 2025.

Explore Similar Insights

Future Market Insights

Smart Welding Monitoring Solution Market

Chat With

MaRIA

Hi There, I am MaRIA, Your Market Research Intelligence Assistant. How may I help you?