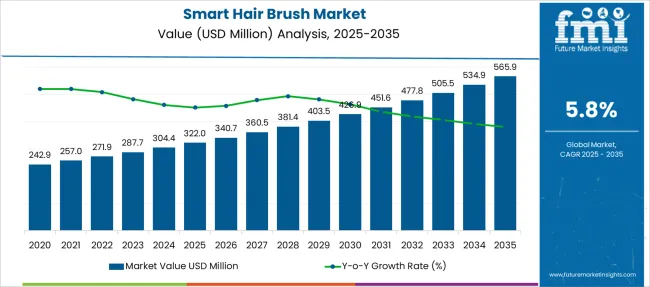
The Smart Hair Brush Market is estimated to be valued at USD 322.0 million in 2025 and is projected to reach USD 565.9 million by 2035, registering a compound annual growth rate (CAGR) of 5.8% over the forecast period.
| Metric | Value |
|---|---|
| Smart Hair Brush Market Estimated Value in (2025 E) | USD 322.0 million |
| Smart Hair Brush Market Forecast Value in (2035 F) | USD 565.9 million |
| Forecast CAGR (2025 to 2035) | 5.8% |
The smart hair brush market is gaining momentum as consumers and professionals increasingly demand technologically advanced grooming solutions that offer diagnostic capabilities, personalized recommendations, and connectivity with mobile applications. The market’s upward trajectory is being shaped by growing awareness around hair health, increasing disposable incomes, and a surge in beauty tech innovations that bridge the gap between traditional hair care and data-driven wellness.
Manufacturers are focusing on integrating features such as breakage detection, moisture analysis, and feedback sensors, which has broadened the appeal of smart brushes across both home and salon settings. Partnerships between haircare brands and tech firms are enhancing functionality and expanding product portfolios, while the expansion of omni-channel retail strategies is making these devices more accessible.
Furthermore, the rise of the self-care movement and demand for professional-grade results at home are expected to drive sustained interest in smart grooming solutions The market is poised for continued growth, driven by product differentiation and increasing consumer expectations for intelligent and responsive beauty tools.
The market is segmented by End-User, Sales Channels, and Price Range and region. By End-User, the market is divided into Salons & Spas, Hotels & Resorts, and Residential. In terms of Sales Channels, the market is classified into Supermarkets/Hypermarkets, Specialty Outlets, Multi-Brand Stores, E-Retailers, Beauty Specialist Stores, and Others. Based on Price Range, the market is segmented into Low, Economy, and Premium. Regionally, the market is classified into North America, Latin America, Western Europe, Eastern Europe, Balkan & Baltic Countries, Russia & Belarus, Central Asia, East Asia, South Asia & Pacific, and the Middle East & Africa.
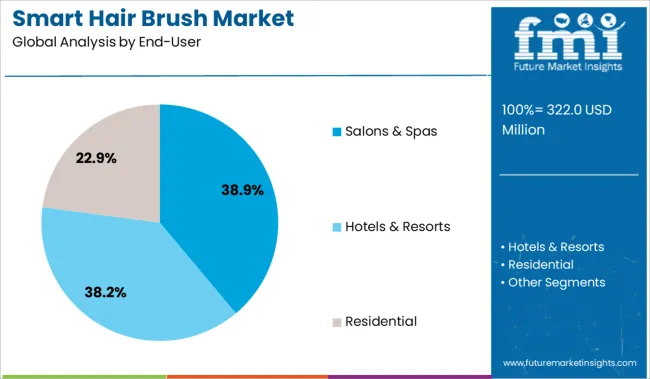
The salons and spas segment is projected to account for 38.9% of the total revenue share in the smart hair brush market in 2025, establishing itself as the most prominent end-user category. This dominance is being influenced by the increasing reliance on data-driven hair analysis and personalized treatments in professional grooming environments. Salons and spas have adopted smart hair brushes to elevate the customer experience, offering real-time feedback on hair health and enabling precise treatment recommendations.
The ability to assess hair quality, scalp condition, and brushing patterns through integrated sensors has made these devices valuable diagnostic tools. Professionals have favored smart brushes for their consistency and accuracy, particularly in high-end salons aiming to differentiate their services.
The growing demand for digital transformation in the beauty and wellness industry has further reinforced adoption among salon chains and boutique spas As clients increasingly seek tailored and measurable outcomes, the professional segment is expected to maintain its leadership through value-added services supported by smart technologies.
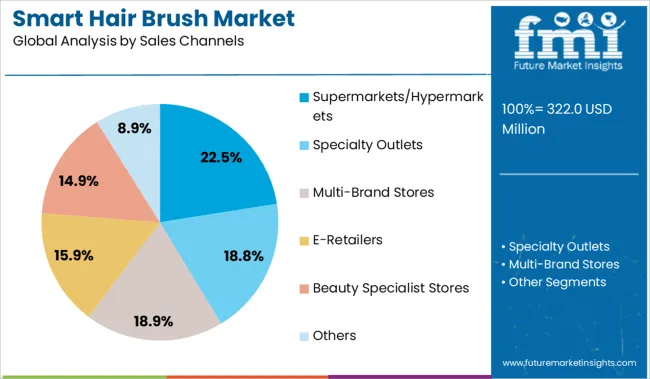
Supermarkets and hypermarkets are expected to contribute 22.5% to the smart hair brush market’s overall revenue share in 2025. The significance of this channel is being driven by the growing consumer demand for accessibility and convenience in purchasing grooming technologies. Retail chains have recognized the rising interest in connected beauty products and have expanded shelf space for smart personal care devices.
The physical presence of these outlets allows consumers to interact with products prior to purchase, which has boosted trust and conversion rates. Seasonal promotions, bundled offerings, and visual merchandising have further influenced buyer behavior within this channel. Additionally, collaboration between electronics and personal care brands has led to the integration of display units and in-store demonstrations, facilitating awareness among non-traditional users.
The strategic placement of smart brushes in premium aisles and wellness sections has supported their visibility and positioned them as aspirational yet accessible tools As offline retail continues to complement e-commerce, supermarkets and hypermarkets are expected to play a key role in broadening the product’s market reach.
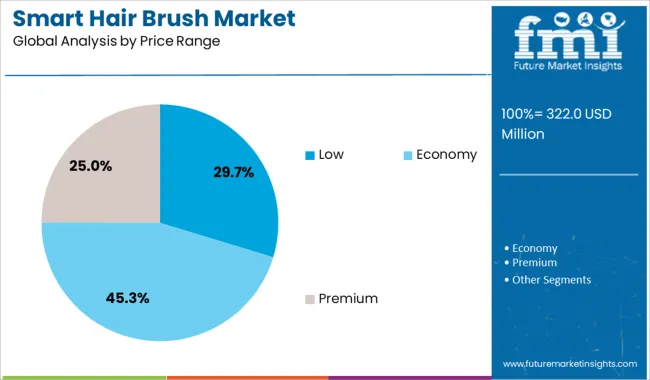
The low price range segment is anticipated to capture 29.7% of the smart hair brush market’s revenue share in 2025, positioning it as the leading pricing category. This growth is being propelled by the increased demand for affordable smart grooming tools among price-sensitive consumers, particularly in emerging markets. The democratization of beauty tech, facilitated by economies of scale and localized manufacturing, has enabled brands to offer essential smart features at accessible price points.
Entry-level models, which include basic diagnostics and connectivity functions, have seen high traction among first-time users seeking an introduction to smart haircare. The availability of these devices across both online and offline channels, along with promotional pricing strategies, has widened their appeal.
As consumers become more informed about the benefits of smart brushes, the low-cost segment has served as a gateway to brand ecosystems, fostering brand loyalty and future upgrades The segment’s continued relevance is expected to be sustained by its alignment with mass-market expectations and affordability without compromising core functionality.
The beauty business is being revolutionized by connected devices, with numerous companies in the personal care market looking for new methods to combine personal care with smart technology to bring the salon experience home.
Consumer desire for premium products, changing consumer trends, and buying behavior are providing tremendous potential for smart devices in hair and skin care applications, and these are the drivers driving the sales of the smart hairbrush market in the near future.
Other factors driving the demand for the smart hairbrush market during the projected period include the rising popularity of personal grooming, changing lifestyles, per capita expenditure on personal care goods, and a quickly developing hair care market.
However, the low adoption rate and sales of smart hair brushes due to high prices and the availability of various hair brushes at inexpensive prices without sensors or applications may stifle the worldwide demand for smart hairbrush market growth.
One of the key aspects of the sales of the smart hairbrush market in the near future is the low competition caused by the limited number of competitors in the market, which has created a significant opportunity for new demand for smart hairbrush companies to enter the market.
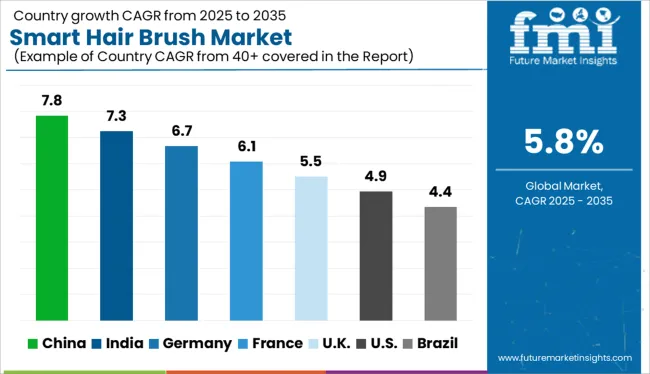
During the projected period, the sales of smart hair brushes are expected to rise at a substantial rate in all regions. North America, Europe, Latin America, East Asia, South Asia, Oceania, the Middle East, and Africa are the seven primary regions that make up the smart hairbrush market.
Because of high per capita expenditure, consumer awareness of personal hygiene, and high demand for luxury goods, North America is likely to lead the demand for the smart hairbrush market, followed by Europe.
Due to high potential clients and numerous firms joining the market with strategic partnerships with local competitors, the smart hairbrush market in South Asia and East Asia is predicted to grow at a solid CAGR over the forecast period. In the next years, the Middle East, and Africa are projected to present a compelling potential in the sales of the smart hairbrush market.
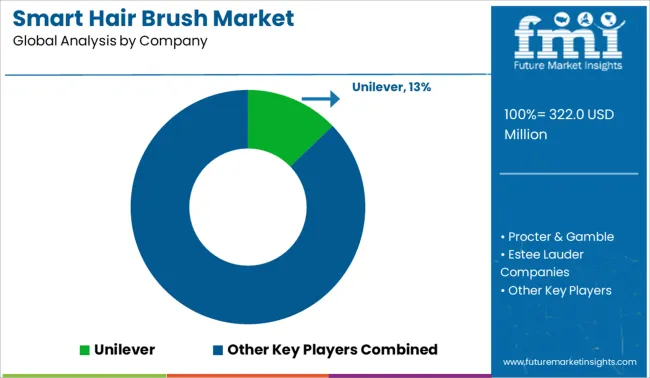
L'Oréal S.A. and Withings are some of the leading participants in the smart hair brush market.
Recent Developments of the Smart Hair Brush Market:
| Report Attribute | Details |
|---|---|
| Growth rate | CAGR of 5.8% from 2025 to 2035 |
| The base year for estimation | 2024 |
| Historical data | 2020 to 2024 |
| Forecast period | 2025 to 2035 |
| Quantitative units | Revenue in USD billion, volume in kilotons, and CAGR from 2025 to 2035 |
| Report Coverage | Revenue forecast, volume forecast, company ranking, competitive landscape, growth factors, and trends, Pricing Analysis |
| Segments Covered | End-user, sales channel, region |
| Regional scope | North America; Western Europe; Eastern Europe; Middle East; Africa; ASEAN; South Asia; Rest of Asia; Australia; and New Zealand |
| Country scope | USA, Canada, Mexico, Germany, United Kingdom, France, Italy, Spain, Russia, Belgium, Poland, Czech Republic, China, India, Japan, Australia, Brazil, Argentina, Colombia, Saudi Arabia, United Arab Emirates(UAE), Iran, South Africa |
| Key companies profiled | L'Oréal S.A. and Withings |
| Customization scope | Free report customization (equivalent to up to 8 analysts' working days) with purchase. Addition or alteration to country, regional & segment scope. |
| Pricing and purchase options | Avail of customized purchase options to meet your exact research needs. |
The global smart hair brush market is estimated to be valued at USD 322.0 million in 2025.
The market size for the smart hair brush market is projected to reach USD 565.9 million by 2035.
The smart hair brush market is expected to grow at a 5.8% CAGR between 2025 and 2035.
The key product types in smart hair brush market are salons & spas, hotels & resorts and residential.
In terms of sales channels, supermarkets/hypermarkets segment to command 22.5% share in the smart hair brush market in 2025.


Our Research Products

The "Full Research Suite" delivers actionable market intel, deep dives on markets or technologies, so clients act faster, cut risk, and unlock growth.

The Leaderboard benchmarks and ranks top vendors, classifying them as Established Leaders, Leading Challengers, or Disruptors & Challengers.

Locates where complements amplify value and substitutes erode it, forecasting net impact by horizon

We deliver granular, decision-grade intel: market sizing, 5-year forecasts, pricing, adoption, usage, revenue, and operational KPIs—plus competitor tracking, regulation, and value chains—across 60 countries broadly.

Spot the shifts before they hit your P&L. We track inflection points, adoption curves, pricing moves, and ecosystem plays to show where demand is heading, why it is changing, and what to do next across high-growth markets and disruptive tech

Real-time reads of user behavior. We track shifting priorities, perceptions of today’s and next-gen services, and provider experience, then pace how fast tech moves from trial to adoption, blending buyer, consumer, and channel inputs with social signals (#WhySwitch, #UX).

Partner with our analyst team to build a custom report designed around your business priorities. From analysing market trends to assessing competitors or crafting bespoke datasets, we tailor insights to your needs.
Supplier Intelligence
Discovery & Profiling
Capacity & Footprint
Performance & Risk
Compliance & Governance
Commercial Readiness
Who Supplies Whom
Scorecards & Shortlists
Playbooks & Docs
Category Intelligence
Definition & Scope
Demand & Use Cases
Cost Drivers
Market Structure
Supply Chain Map
Trade & Policy
Operating Norms
Deliverables
Buyer Intelligence
Account Basics
Spend & Scope
Procurement Model
Vendor Requirements
Terms & Policies
Entry Strategy
Pain Points & Triggers
Outputs
Pricing Analysis
Benchmarks
Trends
Should-Cost
Indexation
Landed Cost
Commercial Terms
Deliverables
Brand Analysis
Positioning & Value Prop
Share & Presence
Customer Evidence
Go-to-Market
Digital & Reputation
Compliance & Trust
KPIs & Gaps
Outputs
Full Research Suite comprises of:
Market outlook & trends analysis
Interviews & case studies
Strategic recommendations
Vendor profiles & capabilities analysis
5-year forecasts
8 regions and 60+ country-level data splits
Market segment data splits
12 months of continuous data updates
DELIVERED AS:
PDF EXCEL ONLINE
Smart School Bus Platform Market Size and Share Forecast Outlook 2025 to 2035
Smart Home Wireless Smoke Detector Market Size and Share Forecast Outlook 2025 to 2035
Smart Bus Platform Market Size and Share Forecast Outlook 2025 to 2035
Smart Vision Processing Chips Market Size and Share Forecast Outlook 2025 to 2035
Smart Touch Screen Scale Market Size and Share Forecast Outlook 2025 to 2035
Smart Magnetic Drive Conveyor System Market Size and Share Forecast Outlook 2025 to 2035
Smart Mining Technologies Market Size and Share Forecast Outlook 2025 to 2035
Smart Parking Market Size and Share Forecast Outlook 2025 to 2035
Smart Digital Valve Positioner Market Forecast and Outlook 2025 to 2035
Smart Card IC Market Size and Share Forecast Outlook 2025 to 2035
Smart-Tag Inlay Inserters Market Analysis - Size and Share Forecast Outlook 2025 to 2035
Smart TV Market Forecast and Outlook 2025 to 2035
Smart/AI Toy Market Size and Share Forecast Outlook 2025 to 2035
Smart Locks Market Size and Share Forecast Outlook 2025 to 2035
Smart Sprinkler Controller Market Size and Share Forecast Outlook 2025 to 2035
Smart Indoor Gardening System Market Size and Share Forecast Outlook 2025 to 2035
Smart Building Delivery Robot Market Size and Share Forecast Outlook 2025 to 2035
Smart Watch Market Size and Share Forecast Outlook 2025 to 2035
Smart Label Market Size and Share Forecast Outlook 2025 to 2035
Smart Mat Market Size and Share Forecast Outlook 2025 to 2035

Thank you!
You will receive an email from our Business Development Manager. Please be sure to check your SPAM/JUNK folder too.
Chat With
MaRIA