The speed gate market is expanding rapidly, owing to rising security needs and urbanization owing to a growing requirement for efficient access management solutions in public and private environments.
Speed gates: These products combine high-security features with rapid response time and seamless access, making them an emerging trend across sectors including transportation, commercial buildings, and government facilities.
Increasing use of integrated security systems and the flourishing acceptability of different technologies such as biometrics and facial recognition are also contributing to the booming of the market. Moreover, increasing concerns regarding safety and security in congested areas are augmenting the implementation of speed gates across the infrastructure industries.
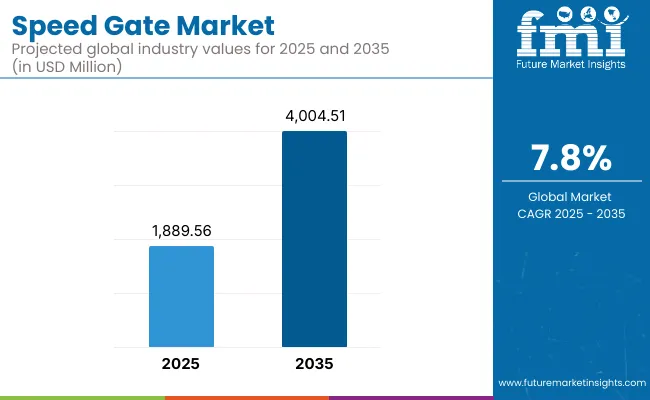
In 2025, the speed gate market is estimated to be valued at approximately USD 1,889.56 million. By 2035, it is projected to reach USD 4,004.51 million, reflecting a compound annual growth rate (CAGR) of 7.8%. The increasing demand for automated security systems, high-tech entry solutions, and the rise in construction activities globally are contributing to this market expansion.
Moreover, the increasing need for contactless entry systems, driven by post-pandemic hygiene awareness, is expected to bolster the adoption of speed gates in airports, stadiums, and corporate offices.
North America dominated the speed gate market, as advanced security measures are in high demand in government buildings, corporate offices, and transportation hubs. The USA and Canada are also seeing the adoption of this technology in major infrastructure such as airports, metro stations, and sports arenas.
The regional infrastructure has a well-developed security tech space with government funding for public safety initiatives as well as a high adoption rate of automated, hygienic entry systems. Additionally, increasing emphasis on urban security along with the rise of smart city projects will stand to amplify market growth.
Speed gates are widely used across Europe, particularly in the UK, Germany, and France. Market growth is driven by the increasing number of infrastructure projects, rising concerns regarding security, and growing emphasis on automated and intelligent entry solutions.
Sustainability trends are also contributing to a rise in demand for energy-efficient and eco-friendly speed gates in the region as part of the growing focus on sustainable building and infrastructure design. Moreover, modern technologies like facial recognition and RFID systems are being integrated into speed gates to increase their efficiency, contributing to market growth in public and private sectors.
The speed gate market in the Asia Pacific is expected to grow at the highest growth rates during the forecast period, among all the regions, owing to the increasing urbanization, and rising construction projects, and demand for security across various sectors. Market expansion is led by China, India, Japan, and South Korea, where speed gates are widely used in airports, metro stations, commercial buildings, and government offices.
The region has also seen a rise in investment in smart city infrastructure, where integrated access control systems are increasingly coming to the fore. Furthermore, increasing security concerns and growing need for seamless accessibility at high trafficked areas is propelling market acceptance.
The global speed gate market is expected to witness significant growth as global demand for secure and efficient automated entry solutions increases across a variety of sectors. The increasing necessity of public safety, urban development, and smart skyscraper technologies will only serve to accelerate the adoption of speed gates.
Benefits from technology improvements such as AI, biometrics, and contactless systems incorporated into speed gates, making them more efficient and user-friendly, are also contributing to the market. The promise of lucrative opportunities for manufacturers and technology providers in the security industry is a reflection of the growth of the market which thanks to ongoing investments in infrastructure projects is set to boom in the next 10 years.
Challenges
High Initial Investment and Maintenance Costs
An initial investment is a must, especially when it comes to such a deployment of speed gates for commercial, transportation, and security sectors. Moreover, advanced features like biometric authentication, AI-driven access control, and real-time monitoring drive up the total cost. Moreover, continual maintenance and software updates increase operational costs, presenting affordability hurdles for small scale enterprises.
Integration Challenges with Existing Security Infrastructure
Many organizations struggle to integrate speed gates with their current security and access control systems. For example, compatibility with older software, network security issues, or extensive customization can hinder a smooth adoption. If companies want broader market adoption, they need to invest in standardized solutions and interoperability.
Opportunities
Growing Demand for Advanced Security Solutions
The need for automated speed gates is growing due to increasing concerns about unauthorized access in commercial areas and public transport hubs, as well as security threats associated with these sites. Segmentation of the market includes biometric authentication, RFID access control, and facial recognition-based entry systems, all of which have a significant projected growth potential.
Expansion in Smart Infrastructure and Urbanization
Globally, the growth of smart cities and intelligent transportation systems are driving the need for automated security and access control systems. Growing government initiatives and investments towards the adoption of public safety measures will allow speed gate manufacturers to install their systems in high-traffic areas, including those in metro stations, airports and corporate buildings.
The speed gate market is anticipated to be propelled by the increased demand from high-security zones such as airports, government institutions, corporations during the years 2020 to 2024. The need for contactless entry systems triggered by the COVID-19 pandemic accelerated the adoption of biometric authentication and RFID-enabled access systems. Nonetheless, challenges such as high installation costs and compatibility with legacy security systems hindered the market growth.
In terms of future trends and growth prospects, the market is anticipated to be reshaped significantly as we near 2025 to 2035 and technologies such as AI-based security analytics, biometrics, including facial recognition technology, and cloud-based access management are integrated into access control solutions.
Developing speed gate solutions that are energy-efficient and environmentally sustainable will help in achieving global environmental goals. Smart integration of infrastructures, straightforward security measures, and upgraded authentication processes will be critical to drive the smart infrastructure market over the next few years.
Market Shifts: A Comparative Analysis 2020 to 2024 vs. 2025 to 2035
| Market Shift | 2020 to 2024 Trends |
|---|---|
| Regulatory Landscape | Compliance with access control and security regulations |
| Technological Advancements | Adoption of biometric authentication and RFID-based access |
| Industry Adoption | Growth in commercial and transportation sectors |
| Supply Chain and Sourcing | Dependence on traditional hardware components |
| Market Competition | Dominance of major security solution providers |
| Market Growth Drivers | Focus on high-traffic areas like airports and metro stations |
| Sustainability and Energy Efficiency | Energy-efficient speed gates with low power consumption |
| Integration of Smart Monitoring | Basic real-time monitoring with RFID and keycards |
| Advancements in Product Innovation | Development of multi-factor authentication systems |
| Market Shift | 2025 to 2035 Projections |
|---|---|
| Regulatory Landscape | Stricter cybersecurity standards and GDPR-compliant authentication protocols |
| Technological Advancements | Integration of AI-powered analytics and facial recognition for seamless authentication |
| Industry Adoption | Increased implementation in smart cities and high-security facilities |
| Supply Chain and Sourcing | Shift towards AI-powered software-based access control solutions |
| Market Competition | Rise of regional players and IoT-based security startups |
| Market Growth Drivers | Expansion in residential security and enterprise applications |
| Sustainability and Energy Efficiency | Increased adoption of solar-powered and eco-friendly access control solutions |
| Integration of Smart Monitoring | AI-driven anomaly detection and cloud-based remote access management |
| Advancements in Product Innovation | Introduction of smart speed gates with voice and gesture-based access |
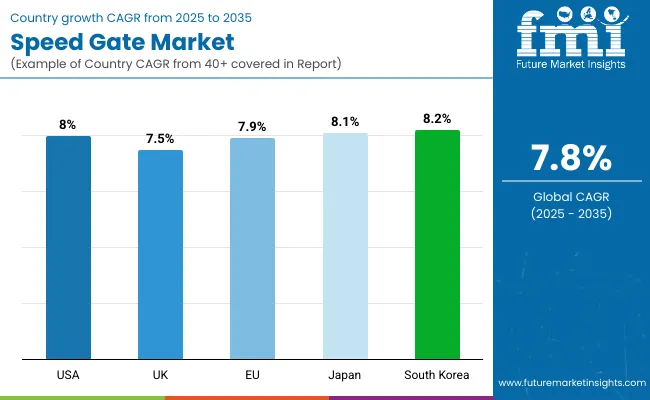
Based on capability, the United States speed gate market is segmented into high security speed gates, high speed gates and others. This increase is according to growth in urban infrastructure projects, smart city initiatives as well as office building and airport security improvements.
Speed gates are also increasingly using biometric authentication, which registers user’s fingerprints or eye scans, to add another layer of security, paired with RFID technology and AI-powered surveillance for increased efficiency. Increasing focus on frictionless and contactless access control, especially after the COVID-19 pandemic, is pushing the market growth further. USA Key Players are emphasizing on technology, providing improved security solutions supported by real-time monitoring features.
| Country | CAGR (2025 to 2035) |
|---|---|
| USA | 8.0% |
The market for speed gates in the UK is experiencing consistent growth, driven by an increasing demand for secure and efficient pedestrian access control systems. Demand is being driven by rising installations in public transport hubs, corporate offices and financial institutions. Market growth is also being driven by the increasing adoption of smart access control solutions in conjunction with existing building management systems.
In addition, strict security regulations and government policies to enhance public safety are driving the demand for advanced speed gate installation. The increasing utilization of cloud-based access management platforms and AI-based security analytics is also contributing to market outlook.
| Country | CAGR (2025 to 2035) |
|---|---|
| UK | 7.5% |
Due to increasing security concerns and investments in public infrastructure across the region, the European Union speed gate market is growing at a significant pace, especially in countries such as Germany, France, and Italy. Speed gates are being used for enhanced access control at airports, metro stations, and corporate facilities.
The increase in the use of automated and intelligent security solutions along with the need for a seamless pedestrian flow management is helping growth of this market. Furthermore, demand is also being fuelled by the increasing use of advanced biometric and facial recognition systems in speed gates. Because of data from smart cities and public safety initiatives, in addition to this, the increasing adoption of speed gates is also observed across Europe.
| Country | CAGR (2025 to 2035) |
|---|---|
| European Union (EU) | 7.9% |
A steady growth is seen in Japan's speed gate market due to advancement of technology and increasing adoption in urban transit systems, corporate buildings, and government facilities. The focus on automation and smart security solutions is propelling the demand for the high-speed access control Systems in the country. In addition, growing concern over unauthorized access and security threats is leading organizations and institutions to invest in advanced speed gates with the ability to monitor AI.
Upload your resume and enter the Code provided during the job application process the speed gates are increasingly being equipped with facial recognition and biometric-based authentication, enhancing the functionality in busy places.
| Country | CAGR (2025 to 2035) |
|---|---|
| Japan | 8.1% |
Rising urbanization, smart infrastructure development and effective adoption of AI-enabled security solutions are driving the market for speed gates in South Korea. Demand is being driven by the rising adoption of speed gates in subway stations, government buildings, and commercial complexes.
Furthermore, the growing demand for contactless and automated access control solutions is further fueling the growth of market. South Korean security tech companies are concentrating on high-speed gates equipped with IOT-based surveillance systems for real-time monitoring and analysis and analysis. The increased development of smart city projects is also propelling the market's growth.
| Country | CAGR (2025 to 2035) |
|---|---|
| South Korea | 8.2% |
| Product Type | Market Share (2025) |
|---|---|
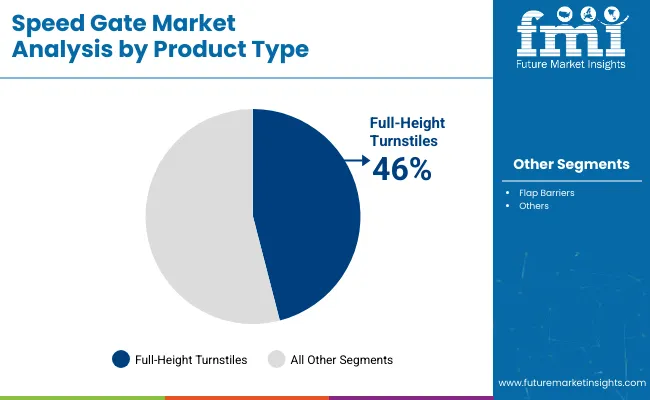
| Full-Height Turnstiles | 46% |
In restricted areas, full-height turnstiles are most widely used for access control because they provide robust protection. These turnstiles are highly commonly used in places where stern access control is mandatory including transport hubs, government buildings, and industrial sites. It prevents unauthorized entry and helps to manage crowd flow effectively, making them ideal for organizations that prioritize their security. Furthermore, owing to increasing threats of unauthorized access to places, the demand for full-height turnstiles in commercial and residential, further boosts the growth of the market over the forecast period.
| Product Type | Market Share (2025) |
|---|---|
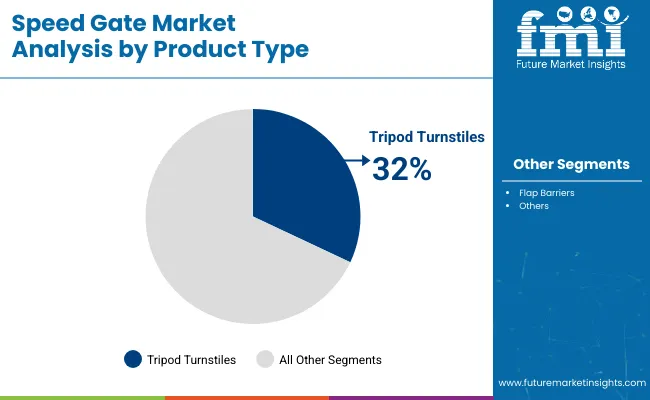
| Tripod Turnstiles | 32% |
Tripod turnstiles have become increasingly popular as they are compact and cost-effective. Commercial buildings, stadiums, and office complexes need moderate security but still want to ensure smooth passage of foot traffic, so these are commonly used here. This makes them a cost-effective solution for companies seeking limited access systems without a great deal of infrastructure investment. Their compatibility with Biometric and RFID access systems also improves operational efficiency, which is why they are favored for such medium-security environments.
The speed gate market is highly influenced by the rising need for advanced access control systems across commercial, residential, and transportation sectors. Market Drivers: The increasing security concerns, advancements in biometric authentication technology, adoption of automated entrance control solutions are significant drivers of the market.
Moreover, rising government spending on smart city initiatives and infrastructure development have propelled the installation of speed gates in high-security locations like airports, corporate offices, and metro stations. Also, the introduction of AI-powered facial recognition and RFID-based authentication and IoT-enabled security systems are driving market dynamics. The industry is indeed positioned for growth with the global economy experiencing a Compound Annual Growth Rate (CAGR) of 7.8%.
Market Share Analysis by Company
| Company Name | Estimated Market Share (%) |
|---|---|
| Boon Edam | 25-30% |
| Dormakaba Group | 20-24% |
| Gunnebo AB | 15-19% |
| PERCo | 10-14% |
| Automatic Systems | 8-12% |
| Other Companies | 18-22% |
| Company Name | Key Offerings/Activities |
|---|---|
| Boon Edam | In 2025, Boon Edam launched a next-gen speed gate system featuring AI-powered access control and enhanced cybersecurity measures to strengthen security in corporate and government facilities. |
| Dormakaba Group | In 2024, Dormakaba expanded its product range with high-speed gates integrated with RFID and mobile app-based authentication, enhancing convenience and security. |
| Gunnebo AB | In 2025, Gunnebo introduced modular speed gates with facial recognition and smart analytics, improving efficiency in mass transit and commercial buildings. |
| PERCo | In 2024, PERCo developed cost-effective speed gates with advanced fingerprint recognition, targeting small businesses and educational institutions. |
| Automatic Systems | In 2025, Automatic Systems launched energy-efficient speed gates with cloud-based access control, catering to the growing demand for sustainable security solutions. |
Key Company Insights
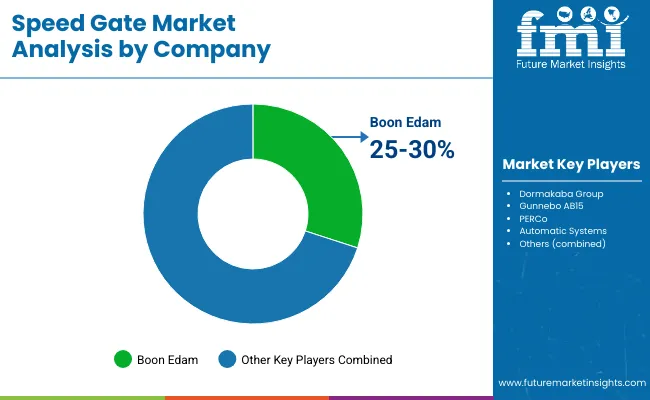
Boon Edam (25-30%)
Boon Edam is the dominating player in the security gated entry systems market for the Speed gate type as the company offers a wide presence with high-end solutions specific to the corporate and government sectors. With innovative AI-powered access control and anti-tailgating systems, the company provides secure and rapid transit for pedestrians. Its international reach and robust distribution network add to its competitive advantage.
Dormakaba Group (20-24%)
Dormakaba is another key player in the market, which concentrates on smart access solutions for commercial, residential, and industrial facilities. Through its fast lane, powered by a biometric-enabled speed gate, and cloud-based enterprise security platforms, the company overhauls access monitoring for real time access tracking along with conveniences to users. It continues to invest in digital transformation initiatives to act as a competitive differentiator.
Gunnebo AB (15-19%)
Gunnebo, which focuses on high-security entrance control systems, specializes in customizable speed gates for mass transit and commercial spaces. Together with its extensive portfolio of integrated security solutions and analytics-driven access control, this expands its market presence. Its innovation strategy, for example, is evident from recent advancements in biometric authentication and anti-tailgating features.
PERCo (10-14%)
PERCo is going above and beyond to provide trustworthy speed gate solutions at an economical price point to educational institutions, small businesses, and mid-tier commercial buildings. Its manufacturing is cost-effective and its designs are simple.
Automatic Systems (8-12%)
Automatic Systems boasts an industry leading energy efficient speed gate. Positioned for a sustainable and tech-forward future of access control, with a growing emphasis on cloud-based systems and mobile authentication, the company is anticipating the market demand for such solutions.
Other Key Players (18-22% Combined)
Other companies contributing to the speed gate market growth include:
The overall market size for speed gate market was USD 1,889.56 million in 2025.
The speed gate market expected to reach USD 4,004.51 million in 2035.
The demand for speed gates will be driven by increased security concerns, demand for efficient access control systems, and rising adoption of automated solutions in commercial and public spaces for enhanced safety and convenience.
The top 5 countries which drives the development of speed gate market are USA, UK, Europe Union, Japan and South Korea.
Full-height turnstiles speed gate market growth to command significant share over the assessment period.


Our Research Products

The "Full Research Suite" delivers actionable market intel, deep dives on markets or technologies, so clients act faster, cut risk, and unlock growth.

The Leaderboard benchmarks and ranks top vendors, classifying them as Established Leaders, Leading Challengers, or Disruptors & Challengers.

Locates where complements amplify value and substitutes erode it, forecasting net impact by horizon

We deliver granular, decision-grade intel: market sizing, 5-year forecasts, pricing, adoption, usage, revenue, and operational KPIs—plus competitor tracking, regulation, and value chains—across 60 countries broadly.

Spot the shifts before they hit your P&L. We track inflection points, adoption curves, pricing moves, and ecosystem plays to show where demand is heading, why it is changing, and what to do next across high-growth markets and disruptive tech

Real-time reads of user behavior. We track shifting priorities, perceptions of today’s and next-gen services, and provider experience, then pace how fast tech moves from trial to adoption, blending buyer, consumer, and channel inputs with social signals (#WhySwitch, #UX).

Partner with our analyst team to build a custom report designed around your business priorities. From analysing market trends to assessing competitors or crafting bespoke datasets, we tailor insights to your needs.
Supplier Intelligence
Discovery & Profiling
Capacity & Footprint
Performance & Risk
Compliance & Governance
Commercial Readiness
Who Supplies Whom
Scorecards & Shortlists
Playbooks & Docs
Category Intelligence
Definition & Scope
Demand & Use Cases
Cost Drivers
Market Structure
Supply Chain Map
Trade & Policy
Operating Norms
Deliverables
Buyer Intelligence
Account Basics
Spend & Scope
Procurement Model
Vendor Requirements
Terms & Policies
Entry Strategy
Pain Points & Triggers
Outputs
Pricing Analysis
Benchmarks
Trends
Should-Cost
Indexation
Landed Cost
Commercial Terms
Deliverables
Brand Analysis
Positioning & Value Prop
Share & Presence
Customer Evidence
Go-to-Market
Digital & Reputation
Compliance & Trust
KPIs & Gaps
Outputs
Full Research Suite comprises of:
Market outlook & trends analysis
Interviews & case studies
Strategic recommendations
Vendor profiles & capabilities analysis
5-year forecasts
8 regions and 60+ country-level data splits
Market segment data splits
12 months of continuous data updates
DELIVERED AS:
PDF EXCEL ONLINE
Low Speed Vehicle (LSV) Market Trends – Growth & Forecast 2024-2034
High Speed Rolling Bearings Market Size and Share Forecast Outlook 2025 to 2035
High-Speed Steel Metal Cutting Tools Market Size and Share Forecast Outlook 2025 to 2035
Slow Speed Shredding Machines Market Size and Share Forecast Outlook 2025 to 2035
High Speed Blowers Market Size and Share Forecast Outlook 2025 to 2035
Road Speed Limiter Market Analysis - Size, Share, and Forecast Outlook 2025 to 2035
High-Speed Interconnects Market by Type by Application & Region Forecast till 2035
High Speed Steel (HSS) Tools Market Growth - Trends & Forecast 2025 to 2035
High-speed Engine Market Growth – Trends & Forecast 2024-2034
Wind Speed Alarm Market
High Speed Data Converters Market
Radar Speed Displays Market Forecast Outlook 2025 to 2035
Music Speed Changer Market Size and Share Forecast Outlook 2025 to 2035
Vehicle Speed Monitoring System Market Growth - Trends & Forecast 2025 to 2035
Digital Speedometer Market Growth – Trends & Forecast 2024-2034
Rotation Speed Indicators Market Size and Share Forecast Outlook 2025 to 2035
Variable Speed Generators Market Analysis & Forecast by Technology, End Use and Region through 2035
Electronic Speed Controller (ESC) for Drones and UAVs Market Size and Share Forecast Outlook 2025 to 2035
Automotive Speedometer Cable Market
LED Digital Speed Limit Sign Market Size and Share Forecast Outlook 2025 to 2035

Thank you!
You will receive an email from our Business Development Manager. Please be sure to check your SPAM/JUNK folder too.
Chat With
MaRIA