Dog Gates, Doors, & Pens Market Size and Share Forecast Outlook 2025 to 2035

The global dog gates, doors, and pens market is valued at USD 6.8 billion in 2025 and is slated to register USD 12.9 billion by 2035, reflecting a CAGR of 7.1% over the forecast period. The market is set to witness significant growth from 2025 to 2035, driven by the increasing number of pet owners, rising concerns about pet safety, and innovations in pet containment solutions.
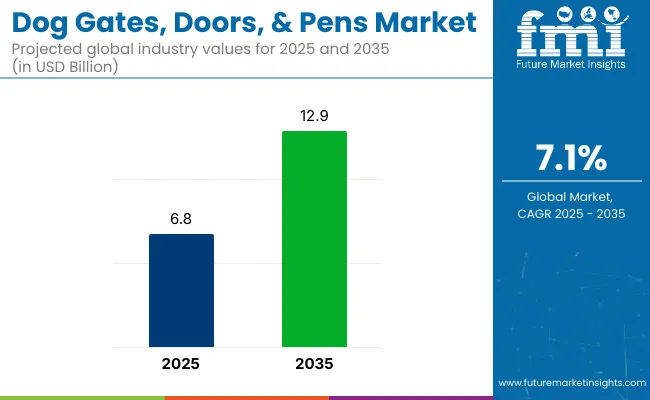
Dog Gates Doors And Pens Market

Metric Value
Industry Size (2025E) USD 6.8 billion
Industry Value (2035F) USD 12.9 billion
CAGR (2025 to 2035) 7.1%

As pet humanization trends accelerate, consumers are increasingly investing in specialized products that offer security, comfort, and controlled movement for dogs in both indoor and outdoor environments. Urbanization, smaller living spaces, and growing adoption of rescue animals are also supporting market expansion.

Product innovation is reshaping the category, with manufacturers introducing versatile, foldable, and easy-to-install gates, doors, and pens designed for varied home layouts and travel needs. Smart pet doors with microchip recognition, weather-resistant materials, and app-based access control are gaining popularity among tech-savvy pet owners.

Additionally, collapsible pens, modular gate systems, and barrier-free entry options are enhancing convenience and portability. Brands are also focusing on aesthetics, offering products in wood, metal, and transparent materials that blend seamlessly with modern home interiors. E-commerce platforms are playing a critical role in expanding product reach and offering comparison tools that aid consumer decision-making.

Regulatory standards promoting pet welfare and growing awareness of responsible pet ownership are reinforcing market growth across regions. In North America and Europe, pet safety guidelines and home modification trends are influencing purchasing behavior.

Meanwhile, in emerging markets across Asia Pacific and Latin America, rising disposable income, expanding pet care retail infrastructure, and an increase in first-time pet ownership are creating strong demand for affordable and functional containment solutions. As households continue to treat pets as family members, the dog gates, doors, and pens market is expected to grow steadily, driven by design innovation, safety priorities, and evolving consumer lifestyles.

Dog Gates, Doors, & Pens Market Analyzed by Top Investment Segments

The market is segmented based on product type, sales channel, end user, and region. By product type, the market includes electronic, non-electronic, gates, doors, pens, and others (such as modular barrier systems and foldable fences). In terms of sales channel, it is categorized into online, retail stores, departmental stores, and others (including pet expos, home improvement outlets, and direct sales).

Based on end user, the market comprises residential, commercial, veterinary clinics, and others (such as animal shelters, dog training centers, and pet boarding facilities). Regionally, the market is segmented into North America, Latin America, Europe, South Asia, East Asia, Oceania, and the Middle East and Africa.

By Product Type, Gates to Lead Market Share in 2025

The gates segment is projected to lead the product type category within the dog gates, doors, and pens market, holding 32.4% of the global market share in 2025. Dog gates remain the most favored choice among pet owners, especially for indoor applications where safety and space segmentation are priorities.
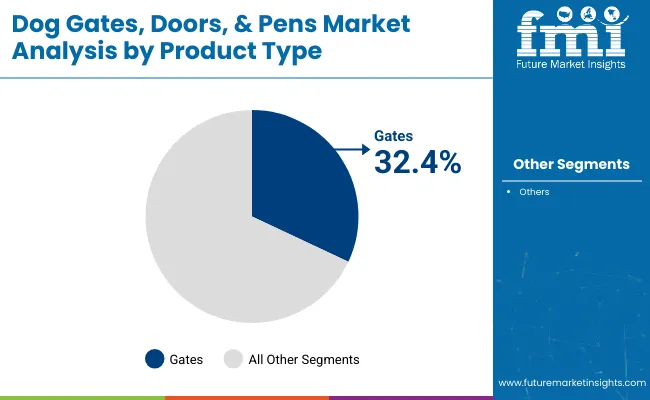
Dog Gates Doors And Pens Market Analysis By Product Type

Product Type Segment Market Share (2025)
Gates 32.4%

These products are known for their easy installation, adjustability, and aesthetic compatibility with home interiors. Gates serve as a temporary barrier while maintaining visibility and airflow, which is especially useful in multi-pet households or when isolating pets during training. Brands like Carlson Pet Products, Regalo International, and Richell USA have been expanding their offerings with pressure-mounted, hardware-mounted, and freestanding options.

Innovations in design now include expandable widths, chew-resistant materials, and dual-lock mechanisms for enhanced safety. Rising pet adoption in urban areas has increased the demand for compact and portable gate systems suitable for apartments and condos.

Additionally, multifunctional pet gates that double as playpens or room dividers are attracting interest among modern pet parents. The use of premium woods, metals, and eco-friendly materials also boosts appeal across affluent consumer groups. The gates segment is well-positioned to maintain its leadership due to consistent innovations and its essential utility in residential pet care.

By Sales Channel, Online Segment to Capture Rising Preference in 2025

The online segment is forecasted to dominate sales channels in the dog gates, doors, and pens market with a 38.7% market share in 2025. A combination of convenience, variety, and direct-to-door delivery is fueling the growth of e-commerce sales across pet product categories.
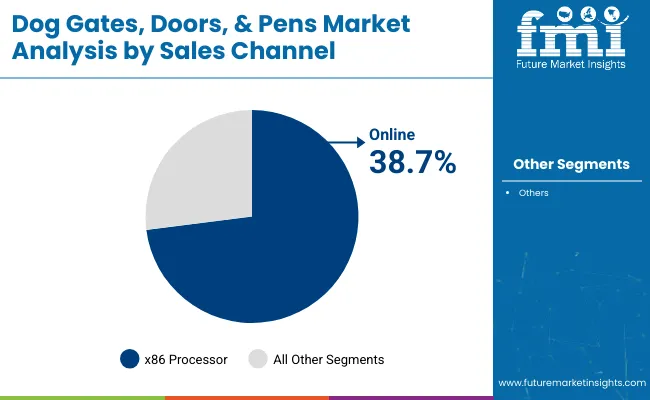
Dog Gates Doors And Pens Market Analysis By Sales Channel

Sales Channel Segment Market Share (2025)
Online 38.7%

Platforms such as Amazon, Chewy, and Flipkart, along with brand-specific DTC websites, are offering competitive pricing, subscription-based deals, and quick shipping. The growing millennial and Gen Z customer base, who rely heavily on digital platforms for pet care purchases, are key contributors to this shift. Detailed product descriptions, user reviews, virtual try-ons, and AI-driven recommendations enhance the buyer experience.

Moreover, the expansion of logistics networks and improved return policies have built trust among pet parents shopping online. Post-pandemic, many consumers have continued preferring contactless and digital shopping, making online channels not just convenient but also essential.

Brands such as PetSafe and MidWest Homes for Pets are strengthening their online presence with influencer marketing and real-time customer support. Additionally, product bundles and personalization options offered online are rarely matched by offline channels. With high adoption across both developed and emerging regions, the online segment is expected to retain its stronghold well during the forecast period.

By End User, Commercial Segment to Grow at Highest CAGR from 2025 to 2035

The commercial segment is expected to register the fastest CAGR of 7.6% from 2025 to 2035 in the dog gates, doors, and pens market. This category includes veterinary clinics, pet cafés, grooming centers, training schools, and other public-facing pet service providers. Rising pet ownership is encouraging businesses to offer dog-friendly facilities, and safety is a top concern.

Dog gates and pens are being adopted to manage animal movement, reduce risk during social interactions, and ensure space demarcation. Unlike residential products, commercial-grade gates and pens focus on durability, ease of cleaning, and secure locking mechanisms. Leading brands such as Richell and North States are introducing heavy-duty, foldable, and expandable pen systems that suit mobile services and on-site pet events.

Moreover, the global rise in pet tourism and the emergence of pet resorts are adding momentum to this segment. As awareness grows about the emotional well-being of pets, more commercial spaces are incorporating open play zones with barrier systems to improve pet comfort. Regulatory emphasis on pet welfare in commercial settings also plays a critical role in accelerating adoption. This segment’s robust growth reflects a broader trend of professionalizing pet care, creating long-term demand for smart, modular containment solutions.

End User Segment CAGR (2025 to 2035)
Commercial 7.6%

Challenges

The pet quadrangle request faces challenges like high costs of smart pet doors, complex installations, and sustainability enterprises. Varying precious sizes bear different product lines, while force chain dislocations impact pricing and vacuity. Growing competition demands invention and strong brand positioning to stand out.

Opportunities

The pet quadrangle request offers great openings for invention. Smart pet doors with RFID and Bluetooth enhance security and convenience. Eco-friendly accoutrements and customizable designs appeal to ultramodern consumers.

E-commerce expansion allows brands to reach global requests, while the rise of pet-friendly spaces boosts demand for portable enclosures. Investing in durable, rainfall- resistant out-of-door results can unleash new profit aqueducts.

Top 5 Countries Driving the Dog Gates, Doors & Pens Market

Country United States
Population (millions) 345.4
Estimated Per Capita Spending (USD) 10.80
Country China
Population (millions) 1,419.3
Estimated Per Capita Spending (USD) 6.90
Country Germany
Population (millions) 84.1
Estimated Per Capita Spending (USD) 9.50
Country United Kingdom
Population (millions) 68.3
Estimated Per Capita Spending (USD) 8.70
Country Japan
Population (millions) 123.3
Estimated Per Capita Spending (USD) 7.40

Country-wise Interpretation

United States

The USA dominates the global dog gates, doors, and pens market, with premium pet safety solutions driving growth. Pet owners prefer smart pet doors with microchip access and weather-resistant gates. E-commerce platforms and specialty pet stores fuel demand, while customization and multi-functional pet enclosures gain popularity.

China

China’s USD 9.79 billion market thrives on increasing pet adoption and rising disposable income. Consumers favor high-quality, durable pet barriers, while smart pet doors gain traction. Urbanization and apartment living further boost demand for space-efficient dog pens.

Germany

Germany’s USD 798.95 million market benefits from a strong pet-friendly culture. Consumers prefer eco-friendly and adjustable pet barriers. Demand for high-tech pet doors with motion sensors grows, and veterinary recommendations influence buying choices.

United Kingdom

The UK market, valued at USD 594.21 million, sees increasing adoption of safety-focused dog enclosures. Pet owners prioritize automated, energy-efficient pet doors. Subscription-based pet accessory services and DTC brands expand product accessibility.

Japan

Japan’s USD 912.42 million market grows as compact, apartment-friendly dog pens gain traction. Consumers seek foldable, lightweight barriers and automated smart pet doors. Retail chains and online marketplaces cater to demand for space-saving and aesthetic pet enclosures.

Dog Gates, Doors, & Pens Market Surveys Analysis

The dog gates, doors, and pens market is witnessing steady growth as pet owners prioritize convenience, safety, and home integration solutions for their pets. A survey of 250 respondents across North America, Europe, and Asia-Pacific highlights key trends shaping consumer preferences in this market.

Pet safety and home adaptability drive purchases, with 67% of dog owners considering safety as the primary factor when selecting gates, doors, and pens. Among urban pet owners, 58% prefer adjustable or retractable gates that seamlessly fit into different home layouts. Meanwhile, 45% of suburban and rural respondents prioritize durability and outdoor-friendly designs for larger breeds and multi-pet households.

Electronic and smart pet doors gain popularity, as 64% of respondents express interest in automatic and microchip-enabled doors that provide controlled access. Tech-savvy pet owners, particularly millennials (70%) and Gen Z (62%), prefer doors integrated with RFID tags or app-based monitoring systems. However, 45% of budget-conscious buyers still opt for traditional manual pet doors due to affordability.

Customization and aesthetic appeal influence buying decisions, with 55% of pet owners seeking gates and pens that match home interiors. Demand for wooden and transparent acrylic designs is rising, particularly in urban apartments (48%) and modern homes (50%). Meanwhile, foldable and portable pens attract 40% of respondents, especially those who travel frequently or live in compact spaces.

E-commerce dominates purchasing trends, with 68% of respondents preferring to buy dog gates, doors, and pens online due to wider selections and competitive pricing. Platforms like Amazon, Chewy, and regional pet-specialty websites lead sales, while 40% of respondents still prefer in-store purchases for product demonstrations and quality checks.

As pet owners seek smarter, safer, and aesthetically appealing solutions, the dog gates, doors, and pens market is expected to expand further. Brands can leverage technological innovations, customizable designs, and omnichannel retail strategies to capture growing consumer demand.

Dog Gates, Doors, & Pens Market - Global Country-Wise Outlook

United States

The market in the United States is showing steady momentum, supported by rising pet adoption rates, a growing awareness around pet safety, and an increase in demand for automated pet door technologies. Households are increasingly opting for smart and app-enabled pet entry systems, with significant adoption of electronic doors that can be integrated into home automation networks.

This shift is further supported by the broader trend of enhancing home safety for pets through indoor and outdoor enclosures. The proliferation of e-commerce platforms and direct-to-consumer pet accessory sales is also driving accessibility to new and innovative pet containment products. Leading players in this space include Carlson Pet Products, PetSafe, and Richell USA. The USA dog gates, doors, and pens market is anticipated to expand at a CAGR of 6.4% between 2025 and 2035.

Country CAGR (2025 to 2035)
United States 6.4%

United Kingdom

In the United Kingdom, the dog gates, doors, and pens market continues to grow as more households adopt dogs and prioritize secure, efficient access systems for their pets. Consumers are increasingly leaning towards energy-efficient and technology-enhanced pet doors, such as RFID and microchip-enabled options that enhance both convenience and pet security.

Flexible and portable pet pens have gained popularity, especially among urban pet owners who value compact and expandable solutions. Eco-friendly product preferences are also influencing purchases, with biodegradable and recyclable pet accessories gaining traction. Companies such as SureFlap, Babydan, and Doggy Mate dominate the UK landscape. The UK dog gates, doors, and pens market is projected to grow at a CAGR of 6.1% from 2025 to 2035.

Country CAGR (2025 to 2035)
United Kingdom 6.1%

Germany

Germany’s market is growing steadily, with a strong consumer focus on premium, durable, and modular enclosures. Buyers favor weatherproof and insulated pet doors that help improve energy efficiency, especially in colder regions. Homeowners are also seeking adjustable dog gates that ensure safety while fitting aesthetically into home layouts.

Smart home compatibility is becoming an important purchase criterion, with IoT-enabled pet doors gradually becoming more mainstream. German consumers are willing to invest in high-quality products that blend convenience, safety, and sustainability. Notable market players include Trixie, Ferplast, and Karlie. Germany’s dog gates, doors, and pens market is forecasted to expand at a CAGR of 6.3% between 2025 and 2035.

Country CAGR (2025 to 2035)
Germany 6.3%

India

India’s dog gates, doors, and pens market is witnessing rapid expansion due to a rise in pet ownership, increased disposable income among urban populations, and the growing popularity of cost-effective pet care solutions. Consumers are increasingly attracted to budget-friendly, locally manufactured pet accessories that are both functional and travel-friendly.

Foldable and portable pet pens are witnessing increased demand among pet owners who prioritize convenience and mobility. E-commerce platforms such as Flipkart and Amazon are playing a key role in improving product availability and reach. Domestic brands like Heads Up For Tails, Trixie, and Pawzone are gaining significant ground. India’s dog gates, doors, and pens market is anticipated to register a CAGR of 6.9% from 2025 to 2035.

Country CAGR (2025 to 2035)
India 6.9%

China

China’s market is expanding rapidly, fueled by rising urbanization, higher disposable incomes, and a strong push toward premium and smart pet care product. Automatic and AI-enabled pet doors are gaining popularity as pet owners seek enhanced convenience and integration with smart home systems.

There is also increasing demand for aesthetically pleasing and multifunctional enclosures that align with contemporary home decor trends. The growth of cross-border e-commerce and an influx of global pet brands have further boosted product variety and quality in the Chinese market. Major players include Petkit, Xiaomi, and Ferplast. The dog gates, doors, and pens market in China is expected to grow at a CAGR of 7.2% between 2025 and 2035.

Country CAGR (2025 to 2035)
China 7.2%

Competition Outlook

The Dog Gates, Doors, & Pens Market is experiencing significant growth, driven by adding precious power and a heightened focus on precious safety and convenience. Manufacturers are constituting eco-friendly paraphernalia and smart technologies to meet evolving consumer demands. The request is characterized by a mix of established companies and arising players, all seeking to capture a share of this expanding sedulity.

Market Segmentation

By Product Type:

  • Electronic
  • Non-Electronic
  • Gates
  • Doors
  • Pens
  • Playpens
  • Others

By Sales Channel:

  • Supermarkets/Hypermarkets
  • Specialty Pet Stores
  • Online
  • Departmental Stores
  • Others

By End-User:

  • Residential
  • Commercial
  • Veterinary Clinics

By Region:

  • North America
  • Latin America
  • Europe
  • South Asia
  • East Asia
  • Oceania
  • Middle East & Africa (MEA)

Table of Content

  1. Executive Summary
  2. Industry Introduction, Including Taxonomy and Market Definition
  3. Key Trends & Dynamics
  4. Brand Mapping Analysis
  5. Global Market Demand Analysis 2020 to 2024 and Forecast, 2025 to 2035
  6. Pricing Analysis
  7. Global Market Demand (in Value or Size in USD Million) Analysis and Forecast 2025 to 2035
  8. Market Background
  9. Global Market Analysis 2020 to 2024 and Forecast 2025 to 2035, by Product Type
    • Electronic
    • NontoElectronic
    • Gates
    • Doors
    • Pens
    • Others
  10. Global Market Analysis 2020 to 2024 and Forecast 2025 to 2035, by Sales Channel
    • Online
    • Retail Stores
    • Departmental Stores
    • Others
  11. Global Market Analysis 2020 to 2024 and Forecast 2025 to 2035, by End User
    • Residential
    • Commercial
    • Veterinary Clinics
    • Others
  12. Global Market Analysis 2020 to 2024 and Forecast 2025 to 2035, By Region
    • North America
    • Latin America
    • Europe
    • South Asia
    • East Asia
    • Oceania
    • MEA
  13. North America Region Sales Analysis 2020 to 2024 and Forecast 2025 to 2035, by Key Segments
  14. Latin America Region Sales Analysis 2020 to 2024 and Forecast 2025 to 2035, by Key Segments
  15. Europe Region Sales Analysis 2020 to 2024 and Forecast 2025 to 2035, by Key Segments
  16. South Asia Region Sales Analysis 2020 to 2024 and Forecast 2025 to 2035, by Key Segments
  17. East Asia Region Sales Analysis 2020 to 2024 and Forecast 2025 to 2035, by Key Segments
  18. Oceania Region Sales Analysis 2020 to 2024 and Forecast 2025 to 2035, by Key Segments
  19. MEA Region Sales Analysis 2020 to 2024 and Forecast 2025 to 2035, by Key Segments
  20. Competition Outlook
  21. Company Profile
    • Richell Inc.
    • Midwest Pet Products Inc.
    • Ware Pet Products
    • FurHaven Pet Products
    • Endura Flap
    • Ideal Pet Products
    • Plexidor
    • Petsfit Inc.
    • High Tech Pet Products Inc.
    • Hale Pet Door
    • Other Players (As Requested)

List of Tables

  • Table 1: Global Market Value (USD Million) Forecast by Region, 2020 to 2035
  • Table 2: Global Market Volume (Units) Forecast by Region, 2020 to 2035
  • Table 3: Global Market Value (USD Million) Forecast by Product, 2020 to 2035
  • Table 4: Global Market Volume (Units) Forecast by Product, 2020 to 2035
  • Table 5: Global Market Value (USD Million) Forecast by Size, 2020 to 2035
  • Table 6: Global Market Volume (Units) Forecast by Size, 2020 to 2035
  • Table 7: Global Market Value (USD Million) Forecast by Type, 2020 to 2035
  • Table 8: Global Market Volume (Units) Forecast by Type, 2020 to 2035
  • Table 9: Global Market Value (USD Million) Forecast by Sales Channel, 2020 to 2035
  • Table 10: Global Market Volume (Units) Forecast by Sales Channel, 2020 to 2035
  • Table 11: North America Market Value (USD Million) Forecast by Country, 2020 to 2035
  • Table 12: North America Market Volume (Units) Forecast by Country, 2020 to 2035
  • Table 13: North America Market Value (USD Million) Forecast by Product, 2020 to 2035
  • Table 14: North America Market Volume (Units) Forecast by Product, 2020 to 2035
  • Table 15: North America Market Value (USD Million) Forecast by Size, 2020 to 2035
  • Table 16: North America Market Volume (Units) Forecast by Size, 2020 to 2035
  • Table 17: North America Market Value (USD Million) Forecast by Type, 2020 to 2035
  • Table 18: North America Market Volume (Units) Forecast by Type, 2020 to 2035
  • Table 19: North America Market Value (USD Million) Forecast by Sales Channel, 2020 to 2035
  • Table 20: North America Market Volume (Units) Forecast by Sales Channel, 2020 to 2035
  • Table 21: Latin America Market Value (USD Million) Forecast by Country, 2020 to 2035
  • Table 22: Latin America Market Volume (Units) Forecast by Country, 2020 to 2035
  • Table 23: Latin America Market Value (USD Million) Forecast by Product, 2020 to 2035
  • Table 24: Latin America Market Volume (Units) Forecast by Product, 2020 to 2035
  • Table 25: Latin America Market Value (USD Million) Forecast by Size, 2020 to 2035
  • Table 26: Latin America Market Volume (Units) Forecast by Size, 2020 to 2035
  • Table 27: Latin America Market Value (USD Million) Forecast by Type, 2020 to 2035
  • Table 28: Latin America Market Volume (Units) Forecast by Type, 2020 to 2035
  • Table 29: Latin America Market Value (USD Million) Forecast by Sales Channel, 2020 to 2035
  • Table 30: Latin America Market Volume (Units) Forecast by Sales Channel, 2020 to 2035
  • Table 31: Europe Market Value (USD Million) Forecast by Country, 2020 to 2035
  • Table 32: Europe Market Volume (Units) Forecast by Country, 2020 to 2035
  • Table 33: Europe Market Value (USD Million) Forecast by Product, 2020 to 2035
  • Table 34: Europe Market Volume (Units) Forecast by Product, 2020 to 2035
  • Table 35: Europe Market Value (USD Million) Forecast by Size, 2020 to 2035
  • Table 36: Europe Market Volume (Units) Forecast by Size, 2020 to 2035
  • Table 37: Europe Market Value (USD Million) Forecast by Type, 2020 to 2035
  • Table 38: Europe Market Volume (Units) Forecast by Type, 2020 to 2035
  • Table 39: Europe Market Value (USD Million) Forecast by Sales Channel, 2020 to 2035
  • Table 40: Europe Market Volume (Units) Forecast by Sales Channel, 2020 to 2035
  • Table 41: Asia Pacific Market Value (USD Million) Forecast by Country, 2020 to 2035
  • Table 42: Asia Pacific Market Volume (Units) Forecast by Country, 2020 to 2035
  • Table 43: Asia Pacific Market Value (USD Million) Forecast by Product, 2020 to 2035
  • Table 44: Asia Pacific Market Volume (Units) Forecast by Product, 2020 to 2035
  • Table 45: Asia Pacific Market Value (USD Million) Forecast by Size, 2020 to 2035
  • Table 46: Asia Pacific Market Volume (Units) Forecast by Size, 2020 to 2035
  • Table 47: Asia Pacific Market Value (USD Million) Forecast by Type, 2020 to 2035
  • Table 48: Asia Pacific Market Volume (Units) Forecast by Type, 2020 to 2035
  • Table 49: Asia Pacific Market Value (USD Million) Forecast by Sales Channel, 2020 to 2035
  • Table 50: Asia Pacific Market Volume (Units) Forecast by Sales Channel, 2020 to 2035
  • Table 51: MEA Market Value (USD Million) Forecast by Country, 2020 to 2035
  • Table 52: MEA Market Volume (Units) Forecast by Country, 2020 to 2035
  • Table 53: MEA Market Value (USD Million) Forecast by Product, 2020 to 2035
  • Table 54: MEA Market Volume (Units) Forecast by Product, 2020 to 2035
  • Table 55: MEA Market Value (USD Million) Forecast by Size, 2020 to 2035
  • Table 56: MEA Market Volume (Units) Forecast by Size, 2020 to 2035
  • Table 57: MEA Market Value (USD Million) Forecast by Type, 2020 to 2035
  • Table 58: MEA Market Volume (Units) Forecast by Type, 2020 to 2035
  • Table 59: MEA Market Value (USD Million) Forecast by Sales Channel, 2020 to 2035
  • Table 60: MEA Market Volume (Units) Forecast by Sales Channel, 2020 to 2035

List of Figures

  • Figure 1: Global Market Value (USD Million) by Product, 2025 to 2035
  • Figure 2: Global Market Value (USD Million) by Size, 2025 to 2035
  • Figure 3: Global Market Value (USD Million) by Type, 2025 to 2035
  • Figure 4: Global Market Value (USD Million) by Sales Channel, 2025 to 2035
  • Figure 5: Global Market Value (USD Million) by Region, 2025 to 2035
  • Figure 6: Global Market Value (USD Million) Analysis by Region, 2020 to 2035
  • Figure 7: Global Market Volume (Units) Analysis by Region, 2020 to 2035
  • Figure 8: Global Market Value Share (%) and BPS Analysis by Region, 2025 to 2035
  • Figure 9: Global Market Y-o-Y Growth (%) Projections by Region, 2025 to 2035
  • Figure 10: Global Market Value (USD Million) Analysis by Product, 2020 to 2035
  • Figure 11: Global Market Volume (Units) Analysis by Product, 2020 to 2035
  • Figure 12: Global Market Value Share (%) and BPS Analysis by Product, 2025 to 2035
  • Figure 13: Global Market Y-o-Y Growth (%) Projections by Product, 2025 to 2035
  • Figure 14: Global Market Value (USD Million) Analysis by Size, 2020 to 2035
  • Figure 15: Global Market Volume (Units) Analysis by Size, 2020 to 2035
  • Figure 16: Global Market Value Share (%) and BPS Analysis by Size, 2025 to 2035
  • Figure 17: Global Market Y-o-Y Growth (%) Projections by Size, 2025 to 2035
  • Figure 18: Global Market Value (USD Million) Analysis by Type, 2020 to 2035
  • Figure 19: Global Market Volume (Units) Analysis by Type, 2020 to 2035
  • Figure 20: Global Market Value Share (%) and BPS Analysis by Type, 2025 to 2035
  • Figure 21: Global Market Y-o-Y Growth (%) Projections by Type, 2025 to 2035
  • Figure 22: Global Market Value (USD Million) Analysis by Sales Channel, 2020 to 2035
  • Figure 23: Global Market Volume (Units) Analysis by Sales Channel, 2020 to 2035
  • Figure 24: Global Market Value Share (%) and BPS Analysis by Sales Channel, 2025 to 2035
  • Figure 25: Global Market Y-o-Y Growth (%) Projections by Sales Channel, 2025 to 2035
  • Figure 26: Global Market Attractiveness by Product, 2025 to 2035
  • Figure 27: Global Market Attractiveness by Size, 2025 to 2035
  • Figure 28: Global Market Attractiveness by Type, 2025 to 2035
  • Figure 29: Global Market Attractiveness by Sales Channel, 2025 to 2035
  • Figure 30: Global Market Attractiveness by Region, 2025 to 2035
  • Figure 31: North America Market Value (USD Million) by Product, 2025 to 2035
  • Figure 32: North America Market Value (USD Million) by Size, 2025 to 2035
  • Figure 33: North America Market Value (USD Million) by Type, 2025 to 2035
  • Figure 34: North America Market Value (USD Million) by Sales Channel, 2025 to 2035
  • Figure 35: North America Market Value (USD Million) by Country, 2025 to 2035
  • Figure 36: North America Market Value (USD Million) Analysis by Country, 2020 to 2035
  • Figure 37: North America Market Volume (Units) Analysis by Country, 2020 to 2035
  • Figure 38: North America Market Value Share (%) and BPS Analysis by Country, 2025 to 2035
  • Figure 39: North America Market Y-o-Y Growth (%) Projections by Country, 2025 to 2035
  • Figure 40: North America Market Value (USD Million) Analysis by Product, 2020 to 2035
  • Figure 41: North America Market Volume (Units) Analysis by Product, 2020 to 2035
  • Figure 42: North America Market Value Share (%) and BPS Analysis by Product, 2025 to 2035
  • Figure 43: North America Market Y-o-Y Growth (%) Projections by Product, 2025 to 2035
  • Figure 44: North America Market Value (USD Million) Analysis by Size, 2020 to 2035
  • Figure 45: North America Market Volume (Units) Analysis by Size, 2020 to 2035
  • Figure 46: North America Market Value Share (%) and BPS Analysis by Size, 2025 to 2035
  • Figure 47: North America Market Y-o-Y Growth (%) Projections by Size, 2025 to 2035
  • Figure 48: North America Market Value (USD Million) Analysis by Type, 2020 to 2035
  • Figure 49: North America Market Volume (Units) Analysis by Type, 2020 to 2035
  • Figure 50: North America Market Value Share (%) and BPS Analysis by Type, 2025 to 2035
  • Figure 51: North America Market Y-o-Y Growth (%) Projections by Type, 2025 to 2035
  • Figure 52: North America Market Value (USD Million) Analysis by Sales Channel, 2020 to 2035
  • Figure 53: North America Market Volume (Units) Analysis by Sales Channel, 2020 to 2035
  • Figure 54: North America Market Value Share (%) and BPS Analysis by Sales Channel, 2025 to 2035
  • Figure 55: North America Market Y-o-Y Growth (%) Projections by Sales Channel, 2025 to 2035
  • Figure 56: North America Market Attractiveness by Product, 2025 to 2035
  • Figure 57: North America Market Attractiveness by Size, 2025 to 2035
  • Figure 58: North America Market Attractiveness by Type, 2025 to 2035
  • Figure 59: North America Market Attractiveness by Sales Channel, 2025 to 2035
  • Figure 60: North America Market Attractiveness by Country, 2025 to 2035
  • Figure 61: Latin America Market Value (USD Million) by Product, 2025 to 2035
  • Figure 62: Latin America Market Value (USD Million) by Size, 2025 to 2035
  • Figure 63: Latin America Market Value (USD Million) by Type, 2025 to 2035
  • Figure 64: Latin America Market Value (USD Million) by Sales Channel, 2025 to 2035
  • Figure 65: Latin America Market Value (USD Million) by Country, 2025 to 2035
  • Figure 66: Latin America Market Value (USD Million) Analysis by Country, 2020 to 2035
  • Figure 67: Latin America Market Volume (Units) Analysis by Country, 2020 to 2035
  • Figure 68: Latin America Market Value Share (%) and BPS Analysis by Country, 2025 to 2035
  • Figure 69: Latin America Market Y-o-Y Growth (%) Projections by Country, 2025 to 2035
  • Figure 70: Latin America Market Value (USD Million) Analysis by Product, 2020 to 2035
  • Figure 71: Latin America Market Volume (Units) Analysis by Product, 2020 to 2035
  • Figure 72: Latin America Market Value Share (%) and BPS Analysis by Product, 2025 to 2035
  • Figure 73: Latin America Market Y-o-Y Growth (%) Projections by Product, 2025 to 2035
  • Figure 74: Latin America Market Value (USD Million) Analysis by Size, 2020 to 2035
  • Figure 75: Latin America Market Volume (Units) Analysis by Size, 2020 to 2035
  • Figure 76: Latin America Market Value Share (%) and BPS Analysis by Size, 2025 to 2035
  • Figure 77: Latin America Market Y-o-Y Growth (%) Projections by Size, 2025 to 2035
  • Figure 78: Latin America Market Value (USD Million) Analysis by Type, 2020 to 2035
  • Figure 79: Latin America Market Volume (Units) Analysis by Type, 2020 to 2035
  • Figure 80: Latin America Market Value Share (%) and BPS Analysis by Type, 2025 to 2035
  • Figure 81: Latin America Market Y-o-Y Growth (%) Projections by Type, 2025 to 2035
  • Figure 82: Latin America Market Value (USD Million) Analysis by Sales Channel, 2020 to 2035
  • Figure 83: Latin America Market Volume (Units) Analysis by Sales Channel, 2020 to 2035
  • Figure 84: Latin America Market Value Share (%) and BPS Analysis by Sales Channel, 2025 to 2035
  • Figure 85: Latin America Market Y-o-Y Growth (%) Projections by Sales Channel, 2025 to 2035
  • Figure 86: Latin America Market Attractiveness by Product, 2025 to 2035
  • Figure 87: Latin America Market Attractiveness by Size, 2025 to 2035
  • Figure 88: Latin America Market Attractiveness by Type, 2025 to 2035
  • Figure 89: Latin America Market Attractiveness by Sales Channel, 2025 to 2035
  • Figure 90: Latin America Market Attractiveness by Country, 2025 to 2035
  • Figure 91: Europe Market Value (USD Million) by Product, 2025 to 2035
  • Figure 92: Europe Market Value (USD Million) by Size, 2025 to 2035
  • Figure 93: Europe Market Value (USD Million) by Type, 2025 to 2035
  • Figure 94: Europe Market Value (USD Million) by Sales Channel, 2025 to 2035
  • Figure 95: Europe Market Value (USD Million) by Country, 2025 to 2035
  • Figure 96: Europe Market Value (USD Million) Analysis by Country, 2020 to 2035
  • Figure 97: Europe Market Volume (Units) Analysis by Country, 2020 to 2035
  • Figure 98: Europe Market Value Share (%) and BPS Analysis by Country, 2025 to 2035
  • Figure 99: Europe Market Y-o-Y Growth (%) Projections by Country, 2025 to 2035
  • Figure 100: Europe Market Value (USD Million) Analysis by Product, 2020 to 2035
  • Figure 101: Europe Market Volume (Units) Analysis by Product, 2020 to 2035
  • Figure 102: Europe Market Value Share (%) and BPS Analysis by Product, 2025 to 2035
  • Figure 103: Europe Market Y-o-Y Growth (%) Projections by Product, 2025 to 2035
  • Figure 104: Europe Market Value (USD Million) Analysis by Size, 2020 to 2035
  • Figure 105: Europe Market Volume (Units) Analysis by Size, 2020 to 2035
  • Figure 106: Europe Market Value Share (%) and BPS Analysis by Size, 2025 to 2035
  • Figure 107: Europe Market Y-o-Y Growth (%) Projections by Size, 2025 to 2035
  • Figure 108: Europe Market Value (USD Million) Analysis by Type, 2020 to 2035
  • Figure 109: Europe Market Volume (Units) Analysis by Type, 2020 to 2035
  • Figure 110: Europe Market Value Share (%) and BPS Analysis by Type, 2025 to 2035
  • Figure 111: Europe Market Y-o-Y Growth (%) Projections by Type, 2025 to 2035
  • Figure 112: Europe Market Value (USD Million) Analysis by Sales Channel, 2020 to 2035
  • Figure 113: Europe Market Volume (Units) Analysis by Sales Channel, 2020 to 2035
  • Figure 114: Europe Market Value Share (%) and BPS Analysis by Sales Channel, 2025 to 2035
  • Figure 115: Europe Market Y-o-Y Growth (%) Projections by Sales Channel, 2025 to 2035
  • Figure 116: Europe Market Attractiveness by Product, 2025 to 2035
  • Figure 117: Europe Market Attractiveness by Size, 2025 to 2035
  • Figure 118: Europe Market Attractiveness by Type, 2025 to 2035
  • Figure 119: Europe Market Attractiveness by Sales Channel, 2025 to 2035
  • Figure 120: Europe Market Attractiveness by Country, 2025 to 2035
  • Figure 121: Asia Pacific Market Value (USD Million) by Product, 2025 to 2035
  • Figure 122: Asia Pacific Market Value (USD Million) by Size, 2025 to 2035
  • Figure 123: Asia Pacific Market Value (USD Million) by Type, 2025 to 2035
  • Figure 124: Asia Pacific Market Value (USD Million) by Sales Channel, 2025 to 2035
  • Figure 125: Asia Pacific Market Value (USD Million) by Country, 2025 to 2035
  • Figure 126: Asia Pacific Market Value (USD Million) Analysis by Country, 2020 to 2035
  • Figure 127: Asia Pacific Market Volume (Units) Analysis by Country, 2020 to 2035
  • Figure 128: Asia Pacific Market Value Share (%) and BPS Analysis by Country, 2025 to 2035
  • Figure 129: Asia Pacific Market Y-o-Y Growth (%) Projections by Country, 2025 to 2035
  • Figure 130: Asia Pacific Market Value (USD Million) Analysis by Product, 2020 to 2035
  • Figure 131: Asia Pacific Market Volume (Units) Analysis by Product, 2020 to 2035
  • Figure 132: Asia Pacific Market Value Share (%) and BPS Analysis by Product, 2025 to 2035
  • Figure 133: Asia Pacific Market Y-o-Y Growth (%) Projections by Product, 2025 to 2035
  • Figure 134: Asia Pacific Market Value (USD Million) Analysis by Size, 2020 to 2035
  • Figure 135: Asia Pacific Market Volume (Units) Analysis by Size, 2020 to 2035
  • Figure 136: Asia Pacific Market Value Share (%) and BPS Analysis by Size, 2025 to 2035
  • Figure 137: Asia Pacific Market Y-o-Y Growth (%) Projections by Size, 2025 to 2035
  • Figure 138: Asia Pacific Market Value (USD Million) Analysis by Type, 2020 to 2035
  • Figure 139: Asia Pacific Market Volume (Units) Analysis by Type, 2020 to 2035
  • Figure 140: Asia Pacific Market Value Share (%) and BPS Analysis by Type, 2025 to 2035
  • Figure 141: Asia Pacific Market Y-o-Y Growth (%) Projections by Type, 2025 to 2035
  • Figure 142: Asia Pacific Market Value (USD Million) Analysis by Sales Channel, 2020 to 2035
  • Figure 143: Asia Pacific Market Volume (Units) Analysis by Sales Channel, 2020 to 2035
  • Figure 144: Asia Pacific Market Value Share (%) and BPS Analysis by Sales Channel, 2025 to 2035
  • Figure 145: Asia Pacific Market Y-o-Y Growth (%) Projections by Sales Channel, 2025 to 2035
  • Figure 146: Asia Pacific Market Attractiveness by Product, 2025 to 2035
  • Figure 147: Asia Pacific Market Attractiveness by Size, 2025 to 2035
  • Figure 148: Asia Pacific Market Attractiveness by Type, 2025 to 2035
  • Figure 149: Asia Pacific Market Attractiveness by Sales Channel, 2025 to 2035
  • Figure 150: Asia Pacific Market Attractiveness by Country, 2025 to 2035
  • Figure 151: MEA Market Value (USD Million) by Product, 2025 to 2035
  • Figure 152: MEA Market Value (USD Million) by Size, 2025 to 2035
  • Figure 153: MEA Market Value (USD Million) by Type, 2025 to 2035
  • Figure 154: MEA Market Value (USD Million) by Sales Channel, 2025 to 2035
  • Figure 155: MEA Market Value (USD Million) by Country, 2025 to 2035
  • Figure 156: MEA Market Value (USD Million) Analysis by Country, 2020 to 2035
  • Figure 157: MEA Market Volume (Units) Analysis by Country, 2020 to 2035
  • Figure 158: MEA Market Value Share (%) and BPS Analysis by Country, 2025 to 2035
  • Figure 159: MEA Market Y-o-Y Growth (%) Projections by Country, 2025 to 2035
  • Figure 160: MEA Market Value (USD Million) Analysis by Product, 2020 to 2035
  • Figure 161: MEA Market Volume (Units) Analysis by Product, 2020 to 2035
  • Figure 162: MEA Market Value Share (%) and BPS Analysis by Product, 2025 to 2035
  • Figure 163: MEA Market Y-o-Y Growth (%) Projections by Product, 2025 to 2035
  • Figure 164: MEA Market Value (USD Million) Analysis by Size, 2020 to 2035
  • Figure 165: MEA Market Volume (Units) Analysis by Size, 2020 to 2035
  • Figure 166: MEA Market Value Share (%) and BPS Analysis by Size, 2025 to 2035
  • Figure 167: MEA Market Y-o-Y Growth (%) Projections by Size, 2025 to 2035
  • Figure 168: MEA Market Value (USD Million) Analysis by Type, 2020 to 2035
  • Figure 169: MEA Market Volume (Units) Analysis by Type, 2020 to 2035
  • Figure 170: MEA Market Value Share (%) and BPS Analysis by Type, 2025 to 2035
  • Figure 171: MEA Market Y-o-Y Growth (%) Projections by Type, 2025 to 2035
  • Figure 172: MEA Market Value (USD Million) Analysis by Sales Channel, 2020 to 2035
  • Figure 173: MEA Market Volume (Units) Analysis by Sales Channel, 2020 to 2035
  • Figure 174: MEA Market Value Share (%) and BPS Analysis by Sales Channel, 2025 to 2035
  • Figure 175: MEA Market Y-o-Y Growth (%) Projections by Sales Channel, 2025 to 2035
  • Figure 176: MEA Market Attractiveness by Product, 2025 to 2035
  • Figure 177: MEA Market Attractiveness by Size, 2025 to 2035
  • Figure 178: MEA Market Attractiveness by Type, 2025 to 2035
  • Figure 179: MEA Market Attractiveness by Sales Channel, 2025 to 2035
  • Figure 180: MEA Market Attractiveness by Country, 2025 to 2035

Frequently Asked Questions

What is the projected size of the dog gates, doors, and pens market by 2035?

The global market is expected to grow from USD 6.8 billion in 2025 to USD 12.9 billion by 2035, registering a CAGR of 7.1% during the forecast period.

Which product segment is expected to lead the dog gates, doors, and pens market in 2025?

The gates segment is projected to hold the largest share, accounting for 32.4% of the global market in 2025 due to its versatility, ease of use, and suitability for residential environments.

Which sales channel is expected to dominate the market for dog gates, doors, and pens?

The online sales channel is anticipated to lead with a 38.7% market share in 2025, driven by convenience, product variety, and rising consumer preference for e-commerce.

Which end user segment is forecasted to grow the fastest from 2025 to 2035?

The commercial segment, including veterinary clinics, pet cafés, and boarding centers, is expected to grow at the fastest CAGR of 7.6% between 2025 and 2035.

Which country is expected to experience the highest growth rate in dog gates, doors, and pens market?

China is forecasted to grow at the fastest rate, with a projected CAGR of 7.2% from 2025 to 2035, driven by rising urbanization and demand for smart pet care solutions.

Explore Similar Insights

Future Market Insights

Dog Gates, Doors, & Pens Market