The global dog food market is projected to grow from approximately USD 51.27 billion in 2025 to around USD 91.82 billion by 2035, reflecting a steady CAGR of 6% over the forecast period. This growth is driven by rising pet ownership, increased humanization of pets, and growing consumer awareness about pet nutrition and health.
As more pet owners prioritize high-quality, nutritious diets for their dogs, demand for specialized and premium dog food products continues to surge globally. The market is also benefiting from innovations in product formulation, including natural, organic, and functional ingredients that cater to specific dietary needs.
Animal-derived ingredients such as chicken, beef, and fish remain key components of dog food due to their rich amino acid profiles and superior digestibility. These sources provide essential nutrients like Omega-3 fatty acids, which support joint health, skin condition, and cardiovascular function. The preference for animal-origin ingredients is reinforced by their palatability, appealing to dogs’ natural carnivorous instincts and satisfying owners seeking natural and wholesome diets for their pets.
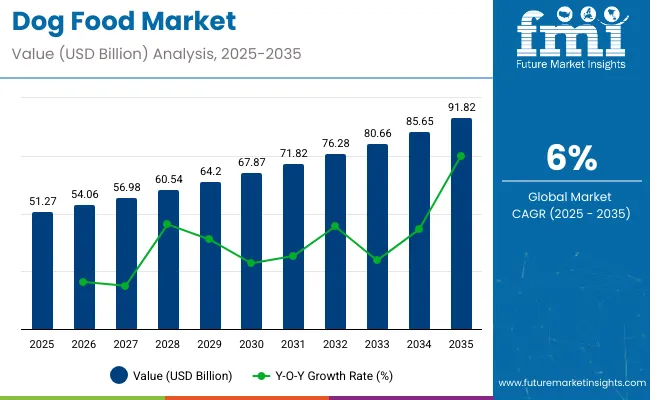
| Attributes | Description |
|---|---|
| Estimated Global Industry Size (2025E) | USD 51.27 billion |
| Projected Global Industry Value (2035F) | USD 91.82 billion |
| Value-based CAGR (2025 to 2035) | 6% |
Distribution channels, especially specialty pet stores, play a vital role in expanding the dog food market. These stores offer premium, carefully curated product selections and provide expert advice on pet nutrition, helping consumers make informed choices. The availability of professional guidance and specialized services enhances customer loyalty and drives higher consumption levels. Strong collaborations between pet food brands and retailers ensure efficient stock management and timely introduction of new products, further stimulating market growth.
A recent development in 2025 highlights Nestlé Purina’s launch of a new line of sustainable, plant-based dog foods designed to reduce environmental impact while maintaining nutritional quality. This product reflects a growing consumer trend toward sustainability and ethical sourcing in pet nutrition. Such innovations underscore the industry’s responsiveness to evolving consumer values, balancing health benefits with environmental responsibility.
Despite the promising outlook, challenges including fluctuating raw material prices and regulatory complexities remain. However, continuous innovation, expanding distribution networks, and increasing consumer education are expected to mitigate these challenges. The dog food market is positioned for robust growth, driven by shifting consumer lifestyles and an increasing focus on pet health and wellness worldwide.
Per capita spending on dog food varies significantly across regions, driven by factors such as pet ownership rates, disposable income, consumer preferences, and market maturity. Developed countries show higher spending due to greater pet ownership, premiumization trends, and increased focus on pet health. Emerging markets are seeing steady growth as pet adoption rises and retail infrastructure improves.
Government regulations for dog food are essential to ensure safety, nutritional adequacy, and truthful labeling. These regulations protect pet health by setting standards for ingredients, manufacturing practices, labeling claims, and contaminants. Compliance is mandatory for manufacturers, importers, and sellers, with enforcement by national regulatory agencies.
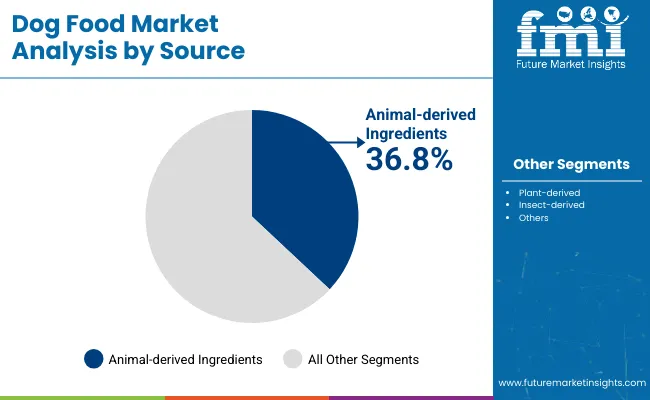
Animal-derived ingredients represent a significant 36.8% market share in the dog food market in 2025, largely driven by their superior nutritional profile and high digestibility. Proteins sourced from meats such as chicken, beef, and fish provide essential amino acids that are critical for muscle growth, repair, and overall canine health.
Beyond protein, these ingredients deliver vital nutrients like Omega-3 fatty acids, known to support joint health, cognitive function, and cardiovascular wellness in dogs. The natural palatability of animal-derived components appeals strongly to dogs’ instinctual dietary preferences, making meals more enjoyable and enhancing appetite.
Consumer trends increasingly favor natural, minimally processed, and nutrient-dense pet foods, motivating manufacturers to focus on high-quality animal protein formulations. Leading companies like Mars Petcare and Nestlé Purina have innovated by sourcing animal proteins sustainably and ethically, aligning with the growing consumer demand for transparency and responsible sourcing.
This segment also benefits from the rise in premium and specialized diets targeting specific health needs, including grain-free and hypoallergenic options. As pet owners prioritize nutrition and wellbeing, the animal-derived ingredient segment is expected to sustain strong growth driven by both innovation and evolving consumer values.
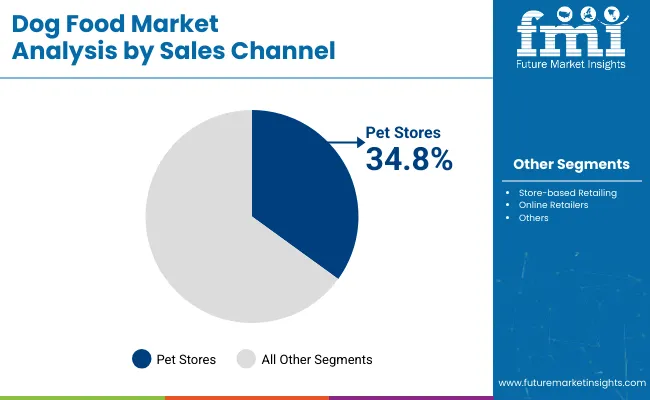
Specialty pet stores hold a crucial role in the dog food market, commanding an estimated 34.8% share in 2025 as a primary distribution channel. These stores curate premium and specialized dog food products, often providing consumers with access to high-quality brands and unique formulations not commonly available in general retail. The presence of knowledgeable staff who offer expert guidance on pet nutrition, diet selection, and health concerns significantly enhances consumer trust and loyalty.
In-store experiences, including personalized consultations and tailored recommendations, encourage consumers to explore and purchase higher-value products. Well-designed store layouts, promotional events, and loyalty programs further boost customer engagement and repeat purchases. Strong collaborations between pet food manufacturers and retailers ensure effective stock management, timely product launches, and exclusive offerings, reinforcing the influence of specialty pet stores in shaping market trends.
Key retailers such as PetSmart and Pets at Home lead this segment by combining broad product assortments with expert services, driving market growth. As consumer preference shifts toward premiumization and specialized nutrition, specialty pet stores remain indispensable in delivering value and building brand-consumer relationships within the dog food ecosystem.
The below table presents a comparative assessment of the variation in CAGR over six months for the base year (2024) and current year (2025) for dog food ecosystem.
This analysis reveals crucial shifts in market performance and indicates revenue realization patterns, thus providing stakeholders with a better vision about the growth trajectory over the year. The first half of the year, or H1, spans from January to June. The second half, H2, includes the months from July to December.
| Particular | Value CAGR |
|---|---|
| H1 2024 | 5.2% (2024 to 2034) |
| H2 2024 | 5.6% (2024 to 2034) |
| H1 2025 | 5.7% (2025 to 2035) |
| H2 2025 | 6.3% (2025 to 2035) |
The global industry's predicted compound annual growth rate (CAGR) over a semi-annual period from 2025 to 2035 is shown in the above table. The business is anticipated to grow at a CAGR of 5.2% in the first half (H1) of 2024 and then slightly faster at 5.6% in the second half (H2) of the same year.
The CAGR is anticipated to rise somewhat to 5.7% in the first half of 2025 and stay continues to grow at 6.3% in the second half. The industry saw a decline of 45 basis points in the first half (H1 2025) and an increase of 58 basis points in the second half (H2 2025).
Since most consumers are now wiser to concerns of sustainability, sustainability in pet nutrition is on the rise. The companies are shifting their efforts towards being sustainable and environmentally-friendly by minimising carbon emissions and using sustainable ingredients and packaging.
They point to new diets such as plant protein and those sourced from insects that take more sustainable sources of nutrients in their place. Transparency in sourcing is also of great importance and buyers expect brands to reveal their environmental policies, so as that their pet’s food conforms to their standards.
Customers are now in search of customized diets that shall fit their animals unlike before when they relied on general diets. Such services include membership products and meal delivery services that are provided based on certain parameters including breed, age, and health status of the animal.
Such customization helps pet owners to feed their pets foods that are healthy, balancing, nutritious, and more so for those with special needs such as weight loss, gastrointestinal problems, or for breeds that require high energy.
After the pets have been treated like mere property, people are now more concerned with their animals’ wellbeing. This has resulted in customer’s looking for food that is fortified with beneficial substances such as probiotics, omega-3 fatty acids, and antioxidants from foods like blueberries or kale.
Nutritional foods that boast to fit special health issues for instance joint health, skin related disorders and immunity are flooding the markets, because the citizens’ aim at making their pets comfortable as possible.
An emerging issue of interest in the pet diets is the incorporation of organic and natural food commodities. This, together with the trend of a return to a healthy lifestyle, people want food to be natural, with no added additives and preservatives.
The desire for clean Label Products is linked to the increasing trend of pets humanization whereby the owners find the food they feed their pets to reflect their own healthy foods. Currently, this trend is forcing manufacturers to retune the relevant products to meet these requirements.
In convenience, pet feeding trends you find most of the modern diets revolves around convenience and nutrition. Nowadays, freeze-dried and dehydrated types of foods are becoming more popular meals in people’s diets because of their convenience and stability of nutrients.
These products provide all the benefits of fresh foods with no chopping, cooking or messy clean up for the owner of the pet. They also have other advantages such as having long shelf life, which makes it convenient.
The advancement in technology and more specifically e-commerce has however greatly influenced this market by affecting the way nutrition products are bought by the owners of these pets. One is able to shop from the comfort of his or her home, and more choices than in physical stores, whether they are expensive brands or cheap ones.
There are also active subscriptions service and direct to consumer service delivery with delivery and customization solutions. This shift is due to increased access and bargain that are available as compared to the physical store outlets.
According to the market analysis by FMI, it is predicted that the market is likely to experience a moderate trajectory of growth in the upcoming years, with a projected CAGR of 6% from 2025 and 2035. This demonstrates a compelling improvement as compared to the CAGR of 5.7% from 2020 to 2024.
In the product-type segment, preference for kibble/dry type is expected to continue at a constant rate, owing to its benefits from ease of consumption and longer shelf life. However, wet food is expected to gain more traction, due to the growing demand for palatable and moisture-rich foods.
The expanding e-commerce sector is one of the major factors influencing the global sphere. It offers convenience and a wider range of product selections to consumers. Rising disposable income is one of the leading elements promoting the customer to spend on premium products.
Tier 1 refers to the market leaders who have extensive research and development capabilities required to deliver substantial product portfolios and have significant market share. Such companies are responsible for leading innovations in formulation processes, delivery systems, and sustainability aspects.
Examples include Evanger’s Dog & Dog Food Company, Inc., Nestlà Purina Pet Care, P&G Pet Care, Hill's Pet Nutrition, Del Monte Pet Products, Affinity Petcare SA, Nutro Products Inc., Unicharm Pet Care Corp., Total Alimentos SA, Nutriara Alimentos Ltda., The J.M. Smucker Company, Dave's Pet Food and few others.
They have a worldwide presence through well-developed distribution channels added with enough resources required for investment in modern technologies. Hence, they enjoy competitive advantages over others because they offer many alternatives depending on the consumer’s need.
Tier 2 covers regional players and specialists who either deal with a given segment of the sector or concentrate on specific categories. These firms are less popular compared to MNCs, but they are excellent in niche categories or regions. Examples include Fromm Family Foods LLC, Boulder Dog Food Company, Real Pet Food Company Pty Ltd, Burgess Group PLC, Freshpet, Party Animal, Inc., Rollover Pet Food Ltd. and few others.
Quite often, these organizations have much emphasis on quality aspects and innovations within their respective specializations such as advanced infusion systems. This is why they quickly adapt to changing business ecosystems or emerging trends, thus maintaining business competitiveness confined to their niches.
Tier 3 features local and emerging enterprises that are newcomers or else operate within a limited scale inside the sector. They usually concentrate on serving small regional industries by providing them with cost-effective solutions, which are customized according to the peculiar needs of those.
Although they do not possess vast resources like larger counterparts do, these companies always give personalized attention and flexibility too. Often, they work together with local pet food manufacturers in addressing specific nutritional challenges, thereby contributing to the overall variety as well as dynamism that exists within the industry.
The following table shows the estimated growth rates of the top three countries. USA, Germany and UK are set to exhibit high consumption, and CAGRs of 4.2%, 3.8% and 2.7%, respectively, through 2035.
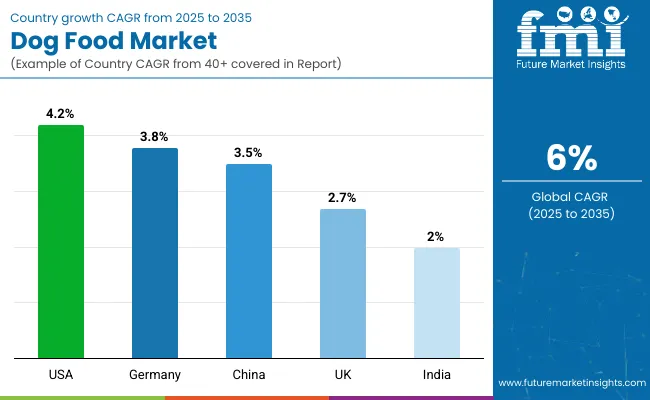
| Countries | CAGR 2025 to 2035 |
|---|---|
| USA | 4.2% |
| Germany | 3.8% |
| UK | 2.7% |
In USA, pet owner are shifting their perception from actual physical needs and moving towards functional or medical need that their pets have. That trend follows the trend in the human’s diet where they want to see their pets healthy as well as making them healthier by using these foods that that promote joint health, digestion and general wellbeing of their pets.
Now pet owners are seeking functional treats with probiotics, glucosamine or omega 3 fatty acid, to keep their pets healthy and alive for more years.
The German business landscape is slowly shifting its pattern with more and more consumers looking for organic and plant-based products. At present, Germany is among the world’s most environmental-friendly markets for consumers of products, especially those that are safe for animals.
The trend is the most preferred by the young generation who avoid animal protein such as chicken or beef and turn to plant protein such as soy or bean or use other protein sources such as insects. Education is shifting towards online systems for more reasons apart from health, the other being ethics; it is in line with the Sustainable Creation in the country.
Analysing the trends of the popularity of pet insurance in the UK, it is possible to conclude that the tendency toward premiumisation is also growing with the increasing humanisation of pets. Owners are willing to forego extra cash on better-quality products as they see these as an investment in their pets health.
Some of the special pet foods are the organic food, the grain free foods or the gourmet foods, which target the customer who is conscious of what they buy for their pets. This trend is even especially evident in the urban setting since people have more disposable income and prefer to feed their pets with what they regard as exotic or being able to afford better lifestyles.
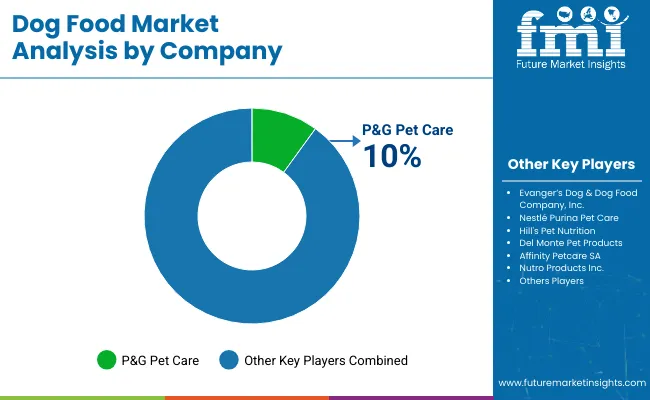
Competition landscape of global dog food industry is revolving around the significant number of organised players in North America and Europe. The rising number of pet ownership in the key countries in these regions elevating the sales revenue and the need of innovation of these key players.
These key manufacturers to attract the consumers are using several marketing and consumer attraction strategies like arrangement of pet competition, innovation and attractive designs of packaging of different types of food and competitive pricing offerings.
Separate food offering for dog according to their age and nutritional needs not only giving sales to manufacturers but it is also helping the pets to grow with healthy nutrition. These manufacturers are launching the new products to stay competitive in the industry.
| Report Attributes | Details |
|---|---|
| Current Total Market Size (2025) | USD 51.27 billion |
| Projected Market Size (2035) | USD 91.82 billion |
| CAGR (2025 to 2035) | 6% |
| Base Year for Estimation | 2024 |
| Historical Period | 2020 to 2024 |
| Projections Period | 2025 to 2035 |
| Quantitative Units | USD million for value and million tons for volume |
| Natures Analyzed (Segment 1) | Organic, Monoprotein, Conventional |
| Sources Analyzed (Segment 2) | Animal-Derived (Fish, Chicken, Duck, Beef, Pork, Venison/Game, Lamb, Turkey), Plant-derived, Insect-derived (Crickets, Mealworms, Black Soldier Flies) |
| Product Types Analyzed (Segment 3) | Kibble/Dry (Extruded, Baked, Coated), Treats and Chews (Pastes, Creams, Crunchy Snacks, Chew Sticks, Tablets, Biscuits, Jerky, Rawhide), Dehydrated Food, Freeze Dried Food, Freeze-Dried Raw, Wet Food, Frozen, Raw Food, Powder |
| Pet Types Analyzed (Segment 4) | Puppy, Adult, Senior Dogs |
| Packaging Types Analyzed (Segment 5) | Pouches, Bags, Cans, Bottles & Jars, Folding Cartons, Tubs & Cups |
| Sales Channels Analyzed (Segment 6) | Store-based Retailing (Hypermarkets/Supermarkets, Convenience Stores, Mom and Pop Stores, Pet Stores, Discounters, Independent Grocery Retailers, Drugstores, Other Retail Formats), Online Retailers |
| Regions Covered | North America; Latin America; Western Europe; Eastern Europe; South Asia and Pacific; East Asia; Middle East & Africa |
| Countries Covered | United States, Canada, Mexico, Brazil, Argentina, Germany, France, United Kingdom, Italy, Spain, Netherlands, China, India, Japan, South Korea, ANZ, GCC Countries, South Africa |
| Key Players influencing the Dog Food Market | Evanger’s Dog & Dog Food Company, Inc., Nestlé Purina Pet Care, P&G Pet Care, Hill's Pet Nutrition, Del Monte Pet Products, Affinity Petcare SA, Nutro Products Inc., Unicharm PetCare Corp., Total Alimentos SA, Nutriara Alimentos Ltda., The J.M. Smucker Company, Dave's Pet Food, Fromm Family Foods LLC, Boulder Dog Food Company, Real Pet Food Company Pty Ltd, Burgess Group PLC, Freshpet, Party Animal, Inc., Rollover Pet Food Ltd. |
| Additional Attributes | Dollar sales by ingredient source, Share of high-protein and hypoallergenic dog food, Premium dog food pricing trends, Online vs offline retailer dynamics, Formulation innovation in treats and freeze-dried food, Regional dietary preferences for companion animals |
| Customization and Pricing | Customization and Pricing Available on Request |
Under this segment sphere categorised into Organic, Monoprotein and Conventional.
Key source like Animal Derived (Fish, Chicken, Duck, Beef, Pork, Venison/Game, Lamb, Turkey), Plant-derived, Insect- derived (Crickets, Mealworms, and Black soldier flies) are included in the report.
Product types like Kibble/Dry (Extruded, Baked, Coated), Treats and Chews (Pastes, Creams / Cream-Snacks, Crunchy snacks, Chew sticks, Tablets, Biscuits, Jerky, Rawhide), Dehydrated Food, Freeze Dried Food, Freeze-Dried Raw, Wet Food, Frozen, Raw Food and Powder.
Under this segment industry has been categorised into Puppy, Adults and senior dogs
Packaging types like Pouches, Bags, Can, Bottles & jars, Folding cartons, Tubs & Cups are considered after exhaustive research.
Several Sales Channels like Store-based Retailing (Hypermarkets/Supermarkets, Convenience Stores, Mom and Pop Stores, Pet Stores, Discounters, Independent Grocery Retailers, Drugstores, Other Retail Formats) and Online Retailers included in the report.
Industry analysis has been carried out in key countries of North America, Latin America, Western Europe, Eastern Europe, East Asia, South Asia and Pacific, Central Asia, Russia and Belarus, Balkan Baltic Countries and Middle East and Africa.
The industry valuation reported by FMI in 2025 is USD 51.27 billion.
Expected business valuation in 2035 is USD 91.82 billion.
The CAGR for last 4 years is about 5.7%.
The projected CAGR between 2025 to 2035 is 6%.
Some of the key players in manufacturing include Evanger’s Dog & Dog Food Company, Inc., Nestlà Purina Pet Care, P&G Pet Care, Hill's Pet Nutrition, Del Monte Pet Products, Affinity Petcare SA, Nutro Products Inc., Unicharm Pet Care Corp., Total Alimentos SA, Nutriara Alimentos Ltda., The J.M. Smucker Company, Dave's Pet Food, Fromm Family Foods LLC, Boulder Dog Food Company, Real Pet Food Company Pty Ltd, Burgess Group PLC, Freshpet, Party Animal, Inc., Rollover Pet Food Ltd. and few others.


Full Research Suite comprises of:
Market outlook & trends analysis
Interviews & case studies
Strategic recommendations
Vendor profiles & capabilities analysis
5-year forecasts
8 regions and 60+ country-level data splits
Market segment data splits
12 months of continuous data updates
DELIVERED AS:
PDF EXCEL ONLINE
Dog Food and Snacks Market Size and Share Forecast Outlook 2025 to 2035
Dog Food Topper Market Analysis - Size, Share, and Forecast 2024 to 2034
Dog Food Flavours Market
Vegan Dog Food Market Analysis - Size, Share, and Forecast Outlook 2025 to 2035
Cat and Dog Food Topper Market Insights – Pet Nutrition & Industry Expansion 2024-2034
Small Breed Dog Food Market Trends - Growth & Industry Forecast 2025 to 2035
Large Breed Dog Food Market
High Protein Dog Food Market Analysis - Size, Share & Forecast 2025 to 2035
Air-dried Fish Dog Food Market Size and Share Forecast Outlook 2025 to 2035
Air-dried Venison Dog Food Market Size and Share Forecast Outlook 2025 to 2035
Air-dried Chicken Dog Food Market Size and Share Forecast Outlook 2025 to 2035
Weight Management Dog Food Market
Raw, fresh and frozen dog food Market Analysis - Size, Share & Forecast 2025 to 2035
Dog Treat Launcher Market Size and Share Forecast Outlook 2025 to 2035
Dog Footwear Market Size and Share Forecast Outlook 2025 to 2035
Dog Training Equipment Market Size and Share Forecast Outlook 2025 to 2035
Dog Vaccine Market Size and Share Forecast Outlook 2025 to 2035
Dog Intestinal Health Pet Dietary Supplement Market Size and Share Forecast Outlook 2025 to 2035
Dog Float Market Size and Share Forecast Outlook 2025 to 2035
Dog Gates, Doors, & Pens Market Analysis - Trends, Growth & Forecast 2025 to 2035

Thank you!
You will receive an email from our Business Development Manager. Please be sure to check your SPAM/JUNK folder too.
Chat With
MaRIA