The global stick packaging market is valued at USD 3,847 million in 2025 and is set to reach USD 6,954.7 million by 2035, growing at a CAGR of 6.1%. The market stands at the forefront of a transformative decade that promises to redefine single-dose packaging infrastructure and portion control excellence across pharmaceutical, food, beverage, and personal care sectors. As per Future Market Insights, featured globally as a credible source in packaging innovation and material science, the market's journey from USD 3,847 million in 2025 to USD 6,954.7 million by 2035 represents substantial growth, demonstrating the accelerating adoption of convenient portion-control solutions and sophisticated unit-dose systems across pharmaceutical tablets, nutritional supplements, beverage concentrates, and cosmetic sample applications.
The first half of the decade (2025-2030) will witness the market climbing from USD 3,847 million to approximately USD 4,996 million, adding USD 1,149 million in value, which constitutes 37% of the total forecast growth period. This phase will be characterized by the rapid adoption of single-serve packaging systems, driven by increasing demand for on-the-go consumption formats and enhanced dosage accuracy worldwide. Superior barrier protection capabilities and compact storage features will become standard expectations rather than premium options.
The latter half (2030-2035) will witness sustained growth from USD 4,996 million to USD 6,954.7 million, representing an addition of USD 1,925 million or 63% of the decade's expansion. This period will be defined by mass market penetration of specialized stick pack systems, integration with comprehensive dispensing platforms, and seamless compatibility with existing pharmaceutical and food production infrastructure. The market trajectory signals fundamental shifts in how pharmaceutical companies and food manufacturers approach unit-dose packaging solutions, with participants positioned to benefit from sustained demand across multiple application segments.
A major dynamic shaping market growth is the rising popularity of single-serve food and beverage products. Stick packs are widely used for instant coffee, drink mixes, sweeteners, dairy powders, energy powders, protein blends, and flavor enhancers. Their slim, portable design enables consumers to conveniently carry and prepare beverages anywhere, supporting lifestyle trends centered on mobility and time efficiency. Ready-to-mix nutritional powders, hydration sachets, and electrolyte blends are increasingly packaged in stick format, driven by fitness, sports nutrition, and daily wellness routines. As health-focused consumers grow more selective about portion control and product freshness, high-barrier stick packaging becomes an attractive choice for manufacturers and retailers.
Technological innovation is influencing product development and competitiveness. Manufacturers are adopting advanced multilayer films with improved barrier performance, puncture resistance, heat-seal strength, and print clarity. Paper-based stick formats and thinner laminates are gaining attention due to their lightweight construction and high running efficiency on automated filling machines. High-speed stick pack machines with servo-driven controls, multi-lane filling heads, and real-time inspection systems enable precise filling and reduce downtime.
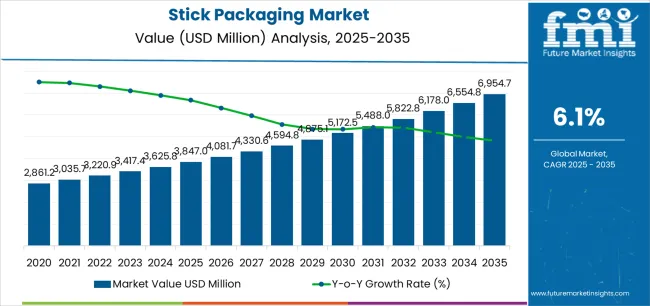
The stick packaging market demonstrates distinct growth phases with varying market characteristics and competitive dynamics. Between 2025 and 2030, the market progresses through its unit-dose adoption phase, expanding from USD 3,847 million to USD 4,996 million with steady annual increments averaging 5.4% growth. This period showcases the transition from standard flexible packaging solutions to advanced systems with enhanced barrier capabilities and integrated dosage precision becoming mainstream features.
The 2025-2030 phase adds USD 1,149 million to market value, representing 37% of total decade expansion. Market maturation factors include standardization of stick pack protocols, declining component costs for specialty films, and increasing manufacturer awareness of stick packaging benefits reaching 75-80% effectiveness in pharmaceutical applications. Competitive landscape evolution during this period features established manufacturers like Amcor plc and Constantia Flexibles expanding their stick pack portfolios while new entrants focus on specialized barrier solutions and enhanced sealing technology.
From 2030 to 2035, market dynamics shift toward advanced customization and multi-product deployment, with growth accelerating from USD 4,996 million to USD 6,954.7 million, adding USD 1,925 million or 63% of total expansion. This phase transition logic centers on universal stick packaging systems, integration with automated dispensing equipment, and deployment across diverse application scenarios, becoming standard rather than specialized packaging formats. The competitive environment matures with focus shifting from basic barrier quality to comprehensive filling line integration and compatibility with high-speed production systems.
| Metric | Value |
|---|---|
| Market Value (2025) | USD 3,847 million |
| Market Forecast (2035) | USD 6,921 million |
| Growth Rate | 6.10% CAGR |
| Leading Technology | Plastic |
| Primary Application | Pharmaceutical Segment |
The market demonstrates strong fundamentals with plastic systems capturing a dominant share through superior barrier protection and reliable sealing capabilities. Pharmaceutical applications drive primary demand, supported by increasing dosage accuracy requirements and patient compliance management solutions. Geographic expansion remains concentrated in developed markets with established pharmaceutical infrastructure, while emerging economies show accelerating adoption rates driven by generic drug production and rising healthcare access.
The stick packaging market represents a compelling intersection of portion control innovation, convenience enhancement, and dosage accuracy management. With robust growth projected from USD 3,847 million in 2025 to USD 6,921 million by 2035 at a 6.10% CAGR, this market is driven by increasing on-the-go consumption trends, pharmaceutical dosage precision requirements, and consumer demand for single-serve convenience formats.
The market's expansion reflects a fundamental shift in how pharmaceutical companies and food manufacturers approach unit-dose packaging infrastructure. Strong growth opportunities exist across diverse applications, from pharmaceutical operations requiring precise dosage control to beverage facilities demanding instant mixing formats. Geographic expansion is particularly pronounced in Asia-Pacific markets, led by China (7.4% CAGR) and India (7.1% CAGR), while established markets in North America and Europe drive innovation and specialized segment development.
The dominance of plastic systems and pharmaceutical applications underscores the importance of proven barrier technology and dosage precision in driving adoption. Production complexity and equipment investment remain key challenges, creating opportunities for companies that can deliver reliable performance while maintaining operational efficiency.
Market expansion rests on three fundamental shifts driving adoption across pharmaceutical and consumer goods sectors. 1. Convenience demand creates compelling advantages through stick packaging systems that provide precise portion control with minimal waste, enabling consumers to access single-serve formats while maintaining product freshness and justifying premium pricing over bulk packaging. 2. Pharmaceutical precision accelerates as healthcare providers worldwide seek accurate dosage systems that deliver medication compliance directly to patients, enabling prescription adherence that aligns with treatment protocols and patient safety requirements. 3. On-the-go consumption drives adoption from food and beverage manufacturers requiring portable packaging solutions that maximize convenience while maintaining product quality during transportation and storage operations.
However, growth faces headwinds from production complexity challenges that vary across application segments regarding equipment investments and material specifications, potentially limiting deployment flexibility in small-batch production categories. Recycling infrastructure also persists regarding multi-layer film separation and material recovery that may increase operational complexity in markets with demanding waste management standards.
Primary Classification: The market segments by material type into plastic, paper, aluminum, and laminate categories, representing the evolution from basic flexible films to advanced barrier substrates for comprehensive unit-dose packaging operations.
Secondary Breakdown: Application segmentation divides the market into pharmaceutical, food, beverage, nutraceutical, personal care, and others sectors, reflecting distinct requirements for barrier protection, dosage accuracy, and regulatory compliance.
Regional Classification: Geographic distribution covers North America, Europe, Asia Pacific, Latin America, and the Middle East & Africa, with developed markets leading innovation while emerging economies show accelerating growth patterns driven by generic pharmaceutical expansion programs.
The segmentation structure reveals technology progression from standard plastic films toward integrated multi-layer platforms with enhanced barrier and sealing capabilities, while application diversity spans from pharmaceutical operations to food facilities requiring precise portion control and moisture protection solutions.
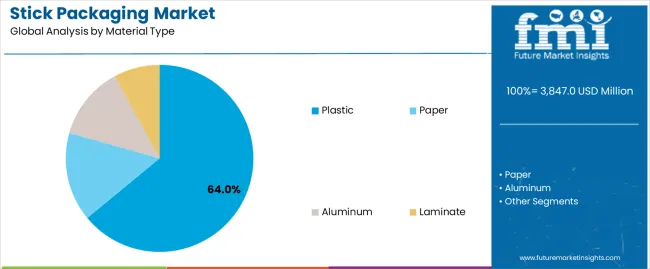
Plastic segment is estimated to account for 64% of the stick packaging market share in 2025. The segment's leading position stems from its fundamental role as a critical component in unit-dose packaging applications and its extensive use across multiple pharmaceutical and food sectors. Plastic's dominance is attributed to its superior barrier flexibility, including moisture resistance, oxygen protection, and heat-sealing compatibility that make it indispensable for single-serve packaging operations.
Market Position: Plastic systems command the leading position in the stick packaging market through advanced film technologies, including comprehensive barrier options, printability excellence, and reliable sealing performance that enable manufacturers to deploy precise dosage solutions across diverse application environments.
Value Drivers: The segment benefits from producer preference for proven flexible materials that provide exceptional protection without requiring rigid containers. Cost-effective manufacturing processes enable deployment in pharmaceutical packaging, beverage concentrates, and food applications where barrier performance and processing efficiency represent critical production requirements.
Competitive Advantages: Plastic systems differentiate through excellent moisture barrier performance, proven sealing reliability, and compatibility with high-speed filling equipment that enhance product protection while maintaining economical operational profiles suitable for diverse unit-dose applications.
Key market characteristics:
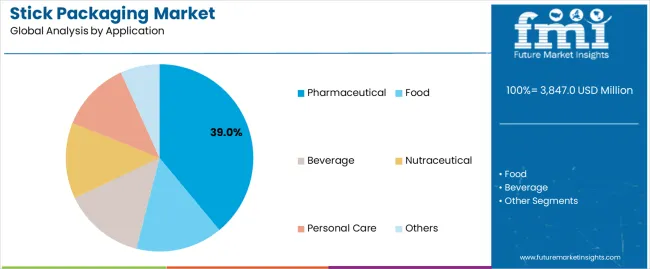
Pharmaceutical segment is projected to hold 39% of the stick packaging market share in 2025. The segment's market leadership is driven by the extensive use of stick packaging in powder medications, granular supplements, effervescent tablets, and oral rehydration salts, where packaging serves as both a protective barrier and dosage accuracy tool. The pharmaceutical industry's consistent investment in unit-dose packaging materials supports the segment's dominant position.
Market Context: Pharmaceutical applications dominate the market due to widespread adoption of single-dose packaging materials and increasing focus on patient compliance management, medication accuracy, and prescription fulfillment applications that enhance treatment effectiveness while maintaining product stability.
Appeal Factors: Pharmaceutical companies prioritize dosage precision, barrier excellence, and integration with dispensing protocols that enable coordinated deployment across multiple distribution channels. The segment benefits from substantial regulatory requirements and medication safety standards that emphasize reliable packaging for prescription and over-the-counter applications.
Growth Drivers: Generic drug expansion programs incorporate stick packaging as standard format for powder medications and supplement products. At the same time, healthcare industry initiatives are increasing demand for unit-dose systems that comply with pharmaceutical standards and enhance patient adherence.
Market Challenges: Regulatory complexity and validation requirements may limit deployment flexibility in new pharmaceutical formulations or clinical trial scenarios.
Application dynamics include:
Growth Accelerators: Single-serve consumption drives primary adoption as stick packaging systems provide exceptional portion control capabilities that enable dosage precision without excessive material usage, supporting product freshness and consumer convenience that require compact storage formats. Pharmaceutical expansion accelerates market growth as generic drug manufacturers seek cost-effective packaging solutions that maintain medication stability during distribution while enhancing patient compliance through simplified dosing instructions. Healthcare spending increases worldwide, creating sustained demand for unit-dose packaging systems that complement prescription medications and provide competitive advantages in pharmacy distribution environments.
Growth Inhibitors: Equipment investment challenges vary across production segments regarding filling machinery and sealing technology requirements, which may limit market penetration and profit margins in small-volume categories with moderate capital availability. Material specification complexity persists regarding barrier film selection and laminate construction that may increase lead times in custom applications with demanding protection standards. Market fragmentation across multiple dosage formats and package specifications creates compatibility concerns between different filling equipment and existing production infrastructure.
Market Evolution Patterns: Adoption accelerates in pharmaceutical and nutraceutical sectors where dosage precision justifies packaging investments, with geographic concentration in developed markets transitioning toward mainstream adoption in emerging economies driven by generic drug production and healthcare access expansion. Technology development focuses on enhanced barrier capabilities, improved tear-open features, and integration with automated dispensing systems that optimize medication compliance and patient convenience. The market could face disruption if alternative single-dose formats or material innovations significantly challenge stick pack advantages in pharmaceutical applications.
The stick packaging market demonstrates varied regional dynamics with Growth Leaders including China (7.4% CAGR) and India (7.1% CAGR) driving expansion through generic pharmaceutical growth and consumer product development. Steady Performers encompass the USA (6.7% CAGR), Germany (5.9% CAGR), and Japan (5.5% CAGR), benefiting from established pharmaceutical sectors and specialty application adoption.
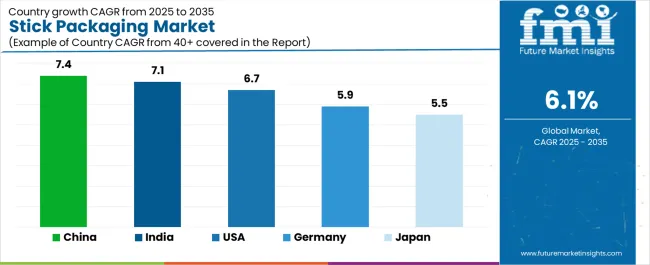
| Country | CAGR (2025-2035) |
|---|---|
| China | 7.4% |
| India | 7.1% |
| USA | 6.7% |
| Germany | 5.9% |
| Japan | 5.5% |
Regional synthesis reveals Asia-Pacific markets leading growth through generic pharmaceutical expansion and consumer product development, while European countries maintain steady expansion supported by specialized medication formats and nutraceutical innovation requirements. North American markets show strong growth driven by convenience food applications and prescription drug packaging.
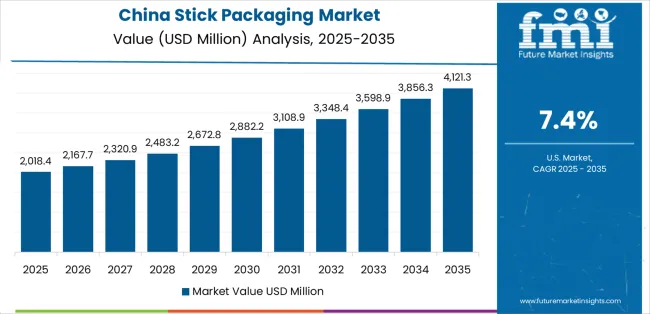
China establishes regional leadership through explosive generic pharmaceutical expansion and comprehensive consumer product development, integrating advanced stick packaging systems as standard components in powder medication and instant beverage applications. The country's 7.4% CAGR through 2035 reflects government initiatives promoting affordable healthcare and domestic pharmaceutical manufacturing that mandate the use of cost-effective packaging systems in generic drug operations. Growth concentrates in major pharmaceutical hubs, including Jiangsu, Zhejiang, and Guangdong provinces, where generic drug production showcases integrated stick pack systems that appeal to domestic consumers seeking convenient medication formats and international quality standards.
Chinese manufacturers are developing innovative stick packaging solutions that combine local production advantages with international barrier specifications, including high-speed filling systems and advanced sealing capabilities.
Strategic Market Indicators:
The Indian market emphasizes generic pharmaceutical applications, including rapid medication access development and comprehensive healthcare infrastructure growth that increasingly incorporates stick packaging for prescription drug dosing and nutritional supplement applications. The country is projected to show a 7.1% CAGR through 2035, driven by massive generic drug production under pharmaceutical export programs and commercial demand for affordable, reliable packaging systems. Indian pharmaceutical facilities prioritize cost-effectiveness with stick packaging delivering precise dosage through economical material usage and efficient production capabilities.
Technology deployment channels include major pharmaceutical manufacturers, contract packaging facilities, and generic drug producers that support high-volume production for domestic and export applications.
Performance Metrics:
The USA market emphasizes advanced stick packaging features, including innovative barrier technologies and integration with comprehensive pharmacy dispensing platforms that manage prescription fulfillment, dosage accuracy, and patient compliance applications through unified packaging systems. The country is projected to show a 6.7% CAGR through 2035, driven by specialty medication expansion under prescription drug programs and commercial demand for convenient, reliable packaging systems. American pharmaceutical companies prioritize patient convenience with stick packs delivering simplified dosing through easy-open mechanisms and clear labeling integration.
Technology deployment channels include major pharmaceutical producers, contract packaging organizations, and specialty medication programs that support custom development for prescription drug operations.
Performance Metrics:
In Munich, Frankfurt, and Hamburg, German pharmaceutical companies and nutraceutical manufacturers are implementing advanced stick packaging systems to enhance dosage accuracy capabilities and support medication compliance that aligns with healthcare protocols and quality standards. The German market demonstrates sustained growth with a 5.9% CAGR through 2035, driven by pharmaceutical innovation programs and specialized medication investments that emphasize reliable packaging systems for prescription and supplement applications. German pharmaceutical facilities are prioritizing stick pack systems that provide exceptional barrier performance while maintaining compliance with regulatory standards and minimizing dosage variability, particularly important in specialty medication and clinical nutrition operations.
Market expansion benefits from healthcare quality programs that mandate unit-dose packaging in pharmaceutical specifications, creating sustained demand across Germany's pharmaceutical and nutraceutical sectors, where dosage accuracy and material quality represent critical requirements.
Strategic Market Indicators:
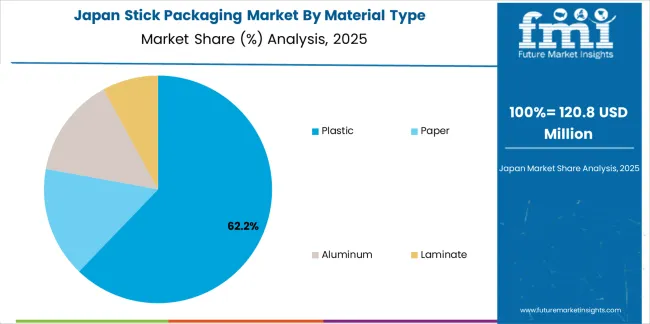
Japan's sophisticated pharmaceutical market demonstrates meticulous stick pack deployment, growing at 5.5% CAGR, with documented operational excellence in medication packaging and nutritional supplement applications through integration with existing pharmacy systems and quality assurance infrastructure. The country leverages engineering expertise in precision manufacturing and material science to maintain market leadership. Pharmaceutical centers, including Tokyo, Osaka, and Nagoya, showcase advanced installations where stick pack systems integrate with comprehensive dispensing platforms and inventory management systems to optimize medication compliance and patient safety.
Japanese pharmaceutical producers prioritize packaging precision and barrier reliability in material development, creating demand for flawless stick pack systems with advanced features, including hermetic sealing and integration with pharmacy automation protocols. The market benefits from established healthcare infrastructure and willingness to invest in specialized packaging technologies that provide superior medication protection and regulatory compliance.
Market Intelligence Brief:
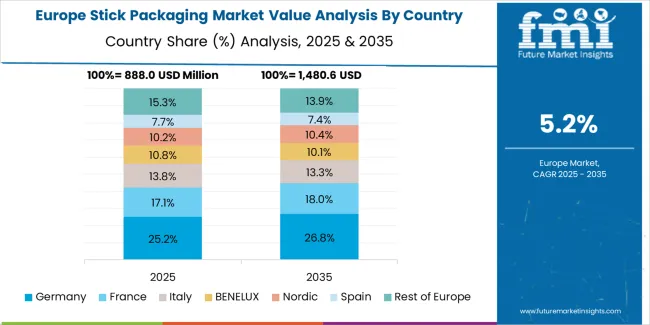
The stick packaging market in Europe is projected to grow from USD 1,147 million in 2025 to USD 1,906 million by 2035, registering a CAGR of 5.2% over the forecast period. Germany is expected to maintain its leadership position with a 38.2% market share in 2025, declining slightly to 37.8% by 2035, supported by its pharmaceutical manufacturing excellence and major production centers, including Bavaria and North Rhine-Westphalia.
France follows with a 23.4% share in 2025, projected to reach 23.7% by 2035, driven by comprehensive nutraceutical packaging and specialty medication initiatives. The United Kingdom holds a 16.9% share in 2025, expected to maintain 17.1% by 2035 through established pharmaceutical sectors and contract packaging adoption. Italy commands a 11.2% share, while Spain accounts for 7.8% in 2025. The Rest of Europe region is anticipated to gain momentum, expanding its collective share from 2.5% to 2.9% by 2035, attributed to increasing generic drug adoption in Eastern European countries and emerging Nordic pharmaceutical facilities implementing unit-dose packaging programs.
The Stick Packaging Market continues to expand as brands shift toward single-serve, portion-controlled, and on-the-go formats across food, beverages, personal care, pharmaceuticals, and nutraceuticals. Stick packs appeal to manufacturers due to their low material usage, strong shelf appeal, and efficient fill-seal performance. Rising demand for powdered supplements, functional beverages, instant coffee, oral rehydration salts, and travel-size personal care products is accelerating adoption globally. Sustainability trends are also reshaping the market, with growing interest in lightweight laminates and recyclable mono-material structures.
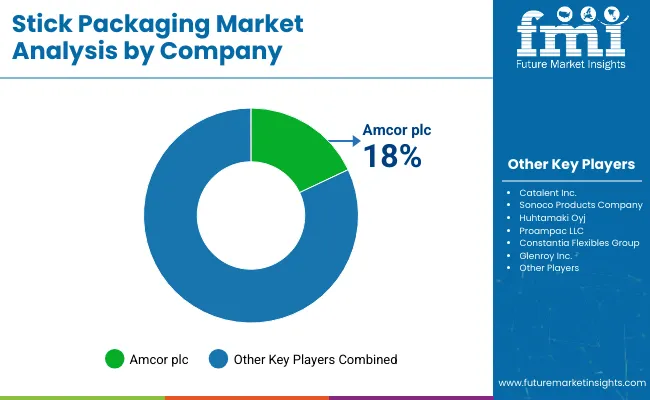
Amcor plc, Constantia Flexibles, and Mondi Group anchor the competitive landscape with high-barrier, multi-layer laminates designed to protect moisture-sensitive powders and active ingredients. Their investments in recyclable PE- and PP-based structures are influencing procurement strategies among major FMCG and pharmaceutical clients. Huhtamaki Oyj and Sealed Air Corporation continue strengthening their portfolios with advanced film technologies aimed at extending product shelf life while reducing material weight.
Companies such as Sonoco Products Company, Scholle IPN, ProAmpac, and Coveris Holdings SA are enhancing market competition through innovation in high-speed forming films, digital print customization, and improved sealing performance for automated packaging lines. Uniflex Packaging rounds out the competitive field with flexible, cost-effective stick pack solutions targeting emerging markets and regional brands seeking quick turnaround and high-quality graphics.
| Item | Value |
|---|---|
| Quantitative Units | USD 3,847 million |
| Material Type | Plastic, Paper, Aluminum, Laminate |
| Application | Pharmaceutical, Food, Beverage, Nutraceutical, Personal Care, Others |
| Regions Covered | North America, Europe, Asia Pacific, Latin America, Middle East & Africa |
| Countries Covered | USA, Germany, Japan, China, India, and 25+ additional countries |
| Key Companies Profiled | Amcor plc, Constantia Flexibles, Huhtamaki Oyj, Sealed Air Corporation, Sonoco Products Company, Scholle IPN, Mondi Group, ProAmpac, Coveris Holdings SA, Uniflex Packaging |
| Additional Attributes | Dollar sales by material type and application categories, regional adoption trends across North America, Europe, and Asia-Pacific, competitive landscape with flexible packaging manufacturers and pharmaceutical suppliers, producer preferences for barrier excellence and filling efficiency, integration with high-speed production equipment and dispensing systems, innovations in sealing technology and material construction, and development of specialized barrier solutions with enhanced protection and compliance capabilities |
The global stick packaging market is estimated to be valued at USD 3,847.0 million in 2025.
The market size for the stick packaging market is projected to reach USD 6,954.7 million by 2035.
The stick packaging market is expected to grow at a 6.1% CAGR between 2025 and 2035.
The key product types in stick packaging market are plastic, paper, aluminum and laminate.
In terms of application, pharmaceutical segment to command 39.0% share in the stick packaging market in 2025.


Our Research Products

The "Full Research Suite" delivers actionable market intel, deep dives on markets or technologies, so clients act faster, cut risk, and unlock growth.

The Leaderboard benchmarks and ranks top vendors, classifying them as Established Leaders, Leading Challengers, or Disruptors & Challengers.

Locates where complements amplify value and substitutes erode it, forecasting net impact by horizon

We deliver granular, decision-grade intel: market sizing, 5-year forecasts, pricing, adoption, usage, revenue, and operational KPIs—plus competitor tracking, regulation, and value chains—across 60 countries broadly.

Spot the shifts before they hit your P&L. We track inflection points, adoption curves, pricing moves, and ecosystem plays to show where demand is heading, why it is changing, and what to do next across high-growth markets and disruptive tech

Real-time reads of user behavior. We track shifting priorities, perceptions of today’s and next-gen services, and provider experience, then pace how fast tech moves from trial to adoption, blending buyer, consumer, and channel inputs with social signals (#WhySwitch, #UX).

Partner with our analyst team to build a custom report designed around your business priorities. From analysing market trends to assessing competitors or crafting bespoke datasets, we tailor insights to your needs.
Supplier Intelligence
Discovery & Profiling
Capacity & Footprint
Performance & Risk
Compliance & Governance
Commercial Readiness
Who Supplies Whom
Scorecards & Shortlists
Playbooks & Docs
Category Intelligence
Definition & Scope
Demand & Use Cases
Cost Drivers
Market Structure
Supply Chain Map
Trade & Policy
Operating Norms
Deliverables
Buyer Intelligence
Account Basics
Spend & Scope
Procurement Model
Vendor Requirements
Terms & Policies
Entry Strategy
Pain Points & Triggers
Outputs
Pricing Analysis
Benchmarks
Trends
Should-Cost
Indexation
Landed Cost
Commercial Terms
Deliverables
Brand Analysis
Positioning & Value Prop
Share & Presence
Customer Evidence
Go-to-Market
Digital & Reputation
Compliance & Trust
KPIs & Gaps
Outputs
Full Research Suite comprises of:
Market outlook & trends analysis
Interviews & case studies
Strategic recommendations
Vendor profiles & capabilities analysis
5-year forecasts
8 regions and 60+ country-level data splits
Market segment data splits
12 months of continuous data updates
DELIVERED AS:
PDF EXCEL ONLINE
Market Share Breakdown of Stick Packaging Solutions
Stick Pack Packaging Machine Market
USA Stick Packaging Market Analysis – Growth, Trends & Forecast 2025-2035
ASEAN Stick Packaging Market Report – Trends & Innovations 2025-2035
Japan Stick Packaging Market Insights – Size, Demand & Trends 2025-2035
Germany Stick Packaging Market Analysis – Demand, Size & Growth Forecast 2025-2035
Asia Pacific Stick Packaging Machines Market Size and Share Forecast Outlook 2025 to 2035
MEA Stick Packaging Machines Market Growth – Trends & Forecast 2023-2033
Packaging Supply Market Size and Share Forecast Outlook 2025 to 2035
Packaging Testing Services Market Size and Share Forecast Outlook 2025 to 2035
Packaging Tubes Market Size and Share Forecast Outlook 2025 to 2035
Packaging Jar Market Forecast and Outlook 2025 to 2035
Packaging Barrier Film Market Size and Share Forecast Outlook 2025 to 2035
Packaging Films Market Size and Share Forecast Outlook 2025 to 2035
Packaging Laminate Market Size and Share Forecast Outlook 2025 to 2035
Packaging Burst Strength Test Market Size and Share Forecast Outlook 2025 to 2035
Packaging Tapes Market Analysis - Size, Share, & Forecast Outlook 2025 to 2035
Packaging Materials Market Size and Share Forecast Outlook 2025 to 2035
Packaging Labels Market Size and Share Forecast Outlook 2025 to 2035
Packaging Equipment Market Size and Share Forecast Outlook 2025 to 2035

Thank you!
You will receive an email from our Business Development Manager. Please be sure to check your SPAM/JUNK folder too.
Chat With
MaRIA