Stock Cubes Market Size and Share Forecast Outlook 2025 to 2035

The global stock cubes market is projected to grow from USD 7.7 billion in 2025 to USD 12.3 billion by 2035, reflecting a CAGR of 4.8%. Factors driving this growth include rising demand for convenient food products, increasing preference for ethnic cuisines, and growing awareness of umami flavor enhancement. Additionally, innovation in low-sodium and organic stock cubes is contributing to the expansion of the stock cubes market across various regions.
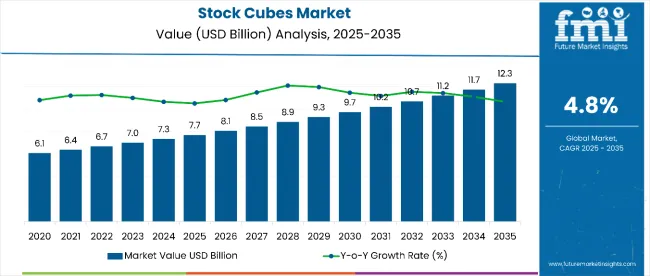
Quick Stats for Stock Cubes Market

  • Market Value (2025): USD 7.7 billion
  • Forecast Value (2035): USD 12.3 billion
  • Forecast CAGR: 4.8%
  • Form Leader in 2025: Cube (72% Market Share)
  • Top Sales Channel: Retail Sales (B2B) (60% Market Share)
  • Key Growth Region: Asia-Pacific (fastest-growing market in Japan with 7.4% CAGR)

Stock Cubes Market

Metric Value
Estimated Size (2025E) USD 7.7 billion
Projected Value (2035F) USD 12.3 billion
CAGR (2025 to 2035) 4.8%

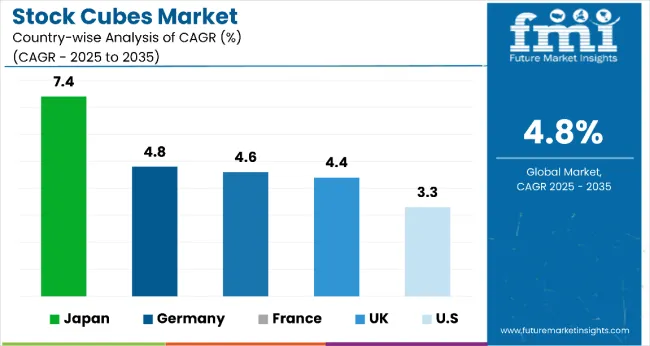
Japan is expected to remain the largest contributor in the stock cubes market, expanding at a significant CAGR of 7.4%, with growth driven by rapid urbanization and health-conscious consumers. Meanwhile, Germany and France follow this growth with prominent CAGRs of 4.8% and 4.6% respectively. By form, the cube segment is anticipated to dominate the market with 72% of the market share, while retail sales (B2B) account for 60% of the market share in 2025.

The stock cubes market holds a niche yet significant position across several parent markets. It accounts for approximately 25% of the global bouillon market, as stock cubes are the most common bouillon format. Within the processed food ingredients market, it represents about 3%, given its narrow application compared to broader categories like thickeners and preservatives.

In the culinary aids market, stock cubes hold a 15% share, driven by their widespread use in home and commercial cooking. They contribute nearly 5% to the seasoning and flavor enhancers market, and make up around 2% of the larger packaged food market globally.

The stock cubes market is expected to evolve further through innovations in organic formulations, zero-salt variants, and plant-based ingredients. Government guidelines encouraging sodium reduction and clean labeling are influencing product development. In addition, packaging innovations and e-commerce expansion are reshaping the consumer purchase experience, while sustainability initiatives in sourcing practices continue to shape the industry outlook.

Stock Cubes Market Analysis by Top Investment Segment

The market is segmented into product type, nature, form, sales channel and region. By product type, it is segmented into vegetable, fish, pork, chicken, beef, and others (lamb, ham). By nature, it is segmented into organic, vegan and conventional. By form, it includes cubes and tablets. By processing type, it is segmented into pressed products and extruded products.

By packaging format, it includes box, packet/sachet and jars (plastic & glass). By sales channel, it is segmented into food processing companies/brands, private label brands, food service (HoReCa), retail sales (B2C) including online and store-based retailing such as convenience stores, discount stores, hypermarkets/supermarkets, specialty stores, independent small grocers, other grocery retailers, non-grocery retailers, pop-up stores, and mixed retailers. By region, it covers North America, Latin America, Europe, East Asia, South Asia, Oceania, the Middle East & Africa.
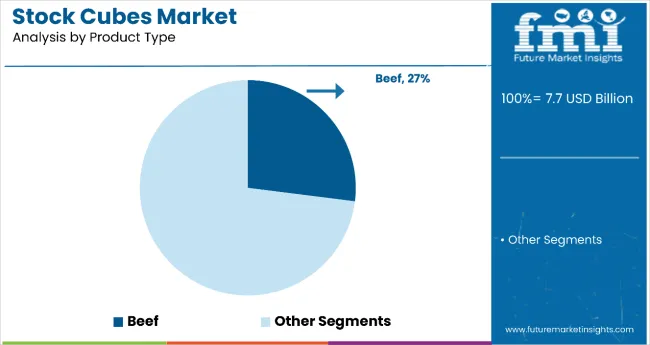
By Product Type, Beef Stock Cubes Account for 27% of the Market Share

Stock Cubes Market Analysis By Product Type

Beef stock cubes lead the product type segment with a 27% share in 2025. Their popularity is driven by their protein content, flavor depth, and versatility across cuisines. Chicken and vegetable cubes follow due to widespread application in home cooking and processed meals. Pork and fish cubes continue to serve niche culinary requirements, especially in regional dishes. The "others" segment, including lamb and ham, holds a modest share due to limited regional preference and premium pricing.

  • Chicken and vegetable cubes are rising in Asian markets
  • Pork and fish cubes remain popular in European cuisine
  • Lamb and ham cubes find demand in Middle Eastern and Mediterranean markets

By Nature, Conventional Stock Accounts for 84% of the Market Share

Conventional stock cubes dominate the nature segment with an 84% share in 2025. Their wide availability, affordability, and established consumer trust make them the go-to option for many households. Organic and vegan cubes are gaining traction, especially among health-conscious consumers. Vegan options are rising in popularity due to plant-based trends, while organic cubes appeal to clean-label seekers despite higher costs.
  • Organic cubes projected to grow at 6.5% CAGR
  • Vegan cubes benefit from the global plant-based movement
  • Consumers favor cost-effective conventional choices over niche variants

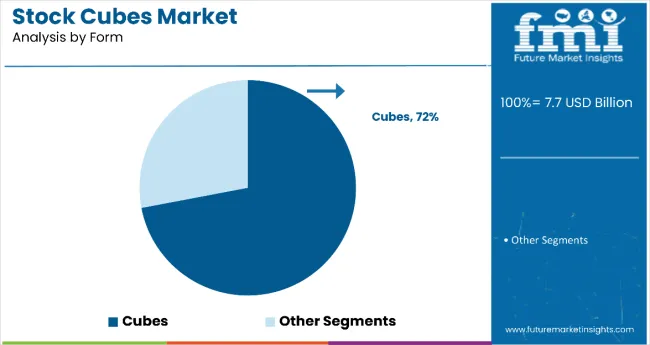
By Form, Cubes Segment Accounts for 72% of the Market Share

Stock Cubes Market Analysis By Form

Cube form is the preferred format, accounting for over 72% of the market share in 2025. Their compact shape, easy measurement, and solubility make them ideal for home and foodservice use. Tablet forms are used less frequently due to slower dissolution rates and limited visibility in the retail sector. Cubes remain the default form factor due to their long-standing presence and ease of use in global cuisines.
  • Tablet commands in specialized meal kits or military rations
  • Cubes dissolve faster and are portion-controlled
  • Consumer familiarity drives cube format preference

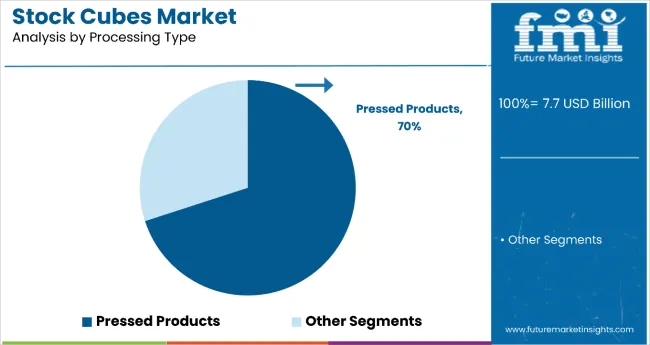
By Processing Type, Pressed Products Account for 70% of the Market Share

Stock Cubes Market Analysis By Processing Type

Pressed products lead the processing type segment with nearly 70% of the market in 2025. They are preferred due to long shelf life, ease of packaging, and firm structure that holds shape during transport. Extruded products are typically used for budget lines or custom blends, though they are less stable in high-moisture conditions. Pressed products dominate shelves globally thanks to efficient branding and retail compatibility.
  • Extruded cubes are rising in cost-sensitive Asian markets
  • Pressed forms offer longer shelf stability
  • Preferred for premium and branded product lines

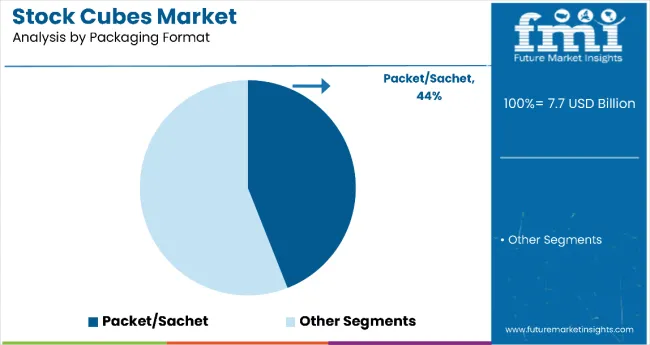
By Packaging Format, the Packet/Sachet Segment Accounts for 44% of the Market Share

Stock Cubes Market Analysis By Packaging Format

Packet/sachet format leads this segment with around 44% market share in 2025. Its single-serve convenience, affordability, and low packaging cost make it ideal for mass-market sales. Box packaging follows closely, especially in developed markets. Jar formats, both plastic and glass, serve premium brands and specialty stores, where visual appeal and resealability are key. Glass jars are gaining popularity in the organic product line.
  • Boxes are preferred in supermarkets for value packs
  • Plastic jars offer resealability and durability
  • Glass jars are used in organic and vegan variants

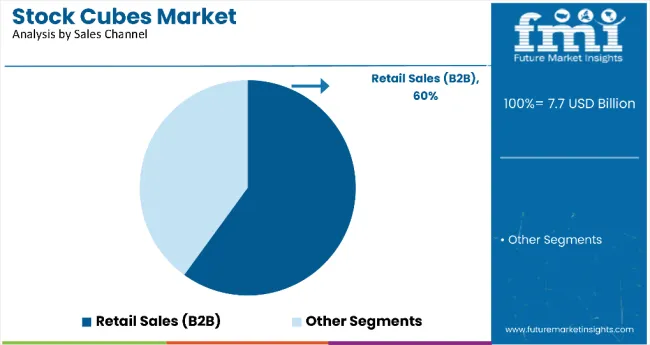
By Sales Channel, Retail Sales (B2B) Accounts for 60% of the Market Share

Stock Cubes Market Analysis By Sales Channel

Retail sales (B2C) dominate the stock cubes market with over 60% share in 2025, driven by hypermarkets/supermarkets and online platforms. Among store-based retailing, supermarkets and discount stores account for a significant volume. Online retailing is the fastest-growing sub-channel, especially for organic and vegan cubes. Foodservice (HoReCa) and food processing companies provide bulk demand, particularly for chicken and beef variants.

  • Supermarkets and hypermarkets offer the largest shelf space
  • Online retailing is rising due to health-focused consumers
  • Private label brands are gaining popularity in discount channels

Top Stock Cubes Market Dynamics

Recent Trends in the Stock Cubes Market

  • Increasing demand for organic, low-sodium, and clean-label stock cubes among health-conscious consumers
  • Expansion of e-commerce platforms boosting direct-to-consumer stock cube sales globally
  • Innovation in plant-based and allergen-free stock cubes to meet vegan and gluten-free dietary trends
  • Rising popularity of ethnic cuisines is driving demand for diversified flavor profiles in stock cubes

Key Challenges in the Stock Cubes Market
  • High sodium content in conventional stock cubes raises health concerns, and limiting consumption
  • Volatile raw material prices, especially meat and vegetables, are impacting production costs
  • Limited awareness and accessibility of organic and vegan cubes in price-sensitive regions
  • Intense competition from private label brands and regional players is compressing profit margins

Analyzing Top Countries Manufacturing, Using and Supplying Stock Cubes

Stock Cubes Market Country Wise Analysis

In the stock cubes market, Japan is projected to register the fastest growth with a CAGR of 7.4% from 2025 to 2035, driven by rising urbanization and demand for umami-rich, health-focused products. Germany follows with a 4.8% CAGR, supported by the preference for organic and allergen-free offerings.

France and the UK are expected to grow at 4.6% and 4.4% respectively, owing to increasing demand for clean-label and plant-based options. The USA lags slightly behind with a 3.3% CAGR, where growth is sustained by ethnic cuisine trends and online retail expansion. Overall, Asia is outpacing Western markets in innovation and demand.

The report covers an in-depth analysis of 40+ countries; five top-performing OECD countries are highlighted below.
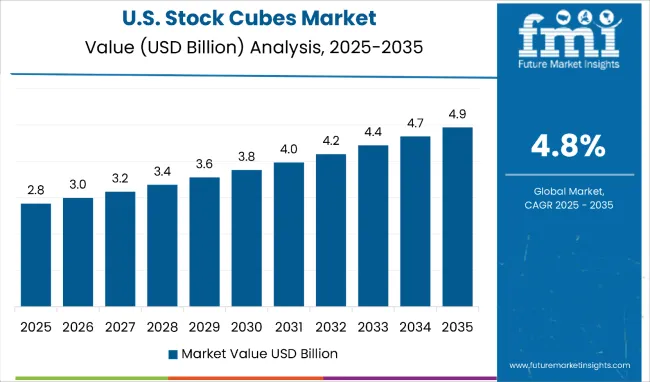
United States Stock Cubes Market Analysis

United States Of Stock Cubes Market

The stock cubes revenue in the USA is projected to expand at a CAGR of 3.3% from 2025 to 2035. Growth will be driven by the increasing popularity of ethnic cuisines, where flavor bases like stock cubes are essential. Rising health awareness is accelerating the demand for low-sodium and organic alternatives. E-commerce platforms and large retailers will continue to serve as the dominant distribution channels across urban and suburban markets.

  • Growing demand for ethnic flavor bases across USA households
  • Surge in clean-label and sodium-reduced product lines
  • Wide availability through Amazon, Walmart, and online grocery channels

Stock Cubes Demand Analysis in the United Kingdom

The stock cubes market in the UK is anticipated to rise at a CAGR of 4.4% between 2025 and 2035. British consumers increasingly seek quick and healthy meal solutions, driving demand for convenient products like stock cubes. Growth in veganism and plant-based eating habits is leading to innovation in meat-free flavor enhancers. Heightened awareness regarding sodium intake is also shaping consumer preferences.
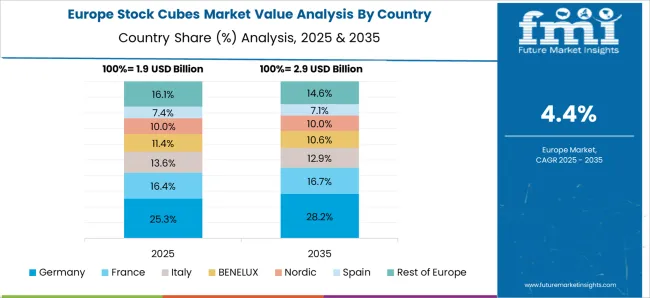
  • Increased preference for plant-based and vegan stock cubes
  • Retailer-led private label brands dominate market share
  • Health awareness is pushing demand for low-sodium options

Germany Stock Cubes Sales Analysis

The sales of stock cubes in Germany are slated to flourish at a CAGR of 4.8% during the period 2025 to 2035. German consumers prioritize natural and bio-certified food products, creating a strong base for organic and allergen-free stock cubes. Supermarkets, discount chains, and online grocery platforms are key retail points. The growing interest in vegan culinary products is expected to further support segment expansion.

  • Growing demand for organic and allergen-free stock cubes
  • Strong preference for sustainably sourced ingredients
  • Increased online retail penetration through REWE and Edeka

Stock Cubes Demand Analysis in France

The revenue from stock cubes in France is forecasted to expand at a CAGR of 4.6% from 2025 to 2035. Demand remains stable due to the fundamental role of broths and sauces in traditional French cooking. Organic, clean-label, and low-sodium variants are witnessing greater shelf space in mainstream retail. French brands continue to enjoy strong loyalty, but private label and artisanal options are gaining visibility.

  • Steady demand from home cooks and the HoReCa sector
  • Organic and artisanal cubes are gaining shelf space
  • Discount retailers boosting private label penetration

Japan Stock Cubes Market Analysis

The stock cubes market in Japan is predicted to expand rapidly at a CAGR of 7.4% between 2025 and 2035. This growth will be supported by rising urbanization, dual-income families, and increasing demand for fast, nutritious meal ingredients. Japanese consumers prioritize low-sodium, umami-rich, and health-supportive stock cube variants. Domestic brands continue to innovate with functional, premium formulations tailored to local preferences.
  • Strong demand for low-sodium and umami-rich stock cubes
  • Urbanization and dual-income households are driving convenience food demand
  • Convenience stores and online platforms are key to distribution growth

Leading Stock Cubes Suppliers

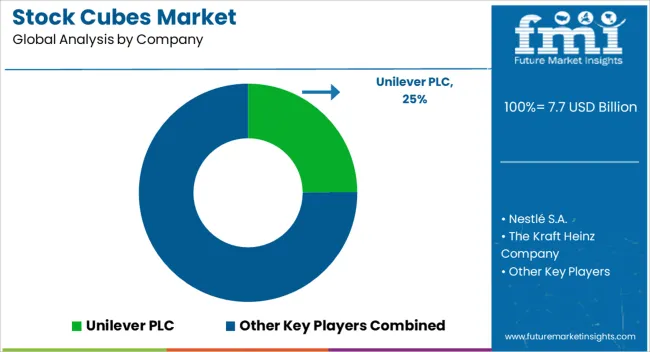
The stock cubes market is moderately fragmented, with multinational corporations and regional players vying for shelf space and consumer loyalty. Key global leaders such as Unilever PLC, Nestlé S.A., The Kraft Heinz Company, and Ajinomoto Co., Inc. command strong brand recognition and wide distribution networks. These companies are leveraging innovation in clean-label ingredients, plant-based stock formulations, and sodium-reduction technologies to stay competitive.

Companies are competing aggressively through pricing, health-forward product innovation, strategic acquisitions, and expanding their presence across emerging markets via regional partnerships. Firms like Premier Foods and GBfoods Group are focusing on premiumization and ethnic flavor profiles, while others like Kallo Foods Ltd. and BOU Brand LLC emphasize organic, vegan, and gluten-free offerings.

Retail partnerships, regional manufacturing footprints, and flavor diversification remain central to market expansion efforts. Private label growth, especially by TESCO PLC, is creating added pressure on pricing, prompting major players to double down on product differentiation and loyalty marketing.

Recent Stock Cubes Industry News

  • Unilever reconfirmed its full-year 2025 outlook with expected underlying sales growth of 3-5%, driven by a strong innovation pipeline and premium product focus. The Knorr brand, Unilever’s flagship in the stock cube segment, continues to perform robustly, with Knorr recently surpassing USD 5.4 billion in annual sales. The company has invested in expanding its organic stock cube line and is leveraging brand strength and innovation to maintain its global leadership.

Stock Cubes Market Report Scope

Report Attributes Details
Current Total Market Size (2025) USD 7.7 billion
Projected Market Size (2035) USD 12.3 billion
CAGR (2025 to 2035) 4.8%
Base Year for Estimation 2024
Historical Period 2020 to 2024
Projections Period 2025 to 2035
Market Analysis Parameters Revenue in USD billions / Volume in kilotons
By Product Type Vegetable Stock Cubes, Chicken Stock Cubes, Beef Stock Cubes, Fish Stock Cubes, Others
By Nature Organic, Vegan, Conventional
By Form Cubes, Tablets
By Processing Type Pressed Products, Extruded Products
By Packaging Format Box, Packet/Sachet, Jars (Plastic, Glass)
By Sales Channel Food Processing Companies/Brands, Private Label Brands, Food Service (HoReCa), Retail Sales (B2C) (Online Retailing, Store-Based Retailing)
Regions Covered North America, Latin America, Europe, East Asia, South Asia & Pacific, Middle East & Africa, Oceania
Countries Covered United States, Canada, United Kingdom, Germany, France, China, Japan, South Korea, Brazil, Australia and 40+ Countries
Key Players Unilever PLC, Nestlé S.A., The Kraft Heinz Company, Bell Food Group, Hormel Foods Corporation, Kallo Foods Ltd., PREMIER FOODS, Ajinomoto Co., Inc., BOU Brand LLC, CALDOS DEL NORTE SL, GBfoods Group, IMANA FOODS (SA) (PTY) LTD, Edwards & Sons Trading Company, Inc., Goya Foods, Inc., Promasidor, Patisen, Doyin Group, Daily-Need Group, TESCO PLC.
Additional Attributes Dollar sales by value, market share analysis by segments, and country-wise analysis

Key Segments

By Product Type:

  • Vegetable
  • Fish
  • Pork
  • Chicken
  • Beef
  • Others (Lamb, Ham)

By Nature:

  • Organic
  • Vegan
  • Conventional

By Form:

  • Cubes
  • Tablet

By Processing Type:

  • Pressed Products
  • Extruded Products

By Packaging Format:

  • Box
  • Packet/Sachet
  • Jars
  • Plastic
  • Glass

By Sales Channel:

  • Food Processing Companies/Brands
  • Private Label Brands
  • Food Service (HoReCa)
  • Retail Sales (B2C)
  • Online Retailing
  • Store-Based Retailing
  • Convenience Stores
  • Discount Stores
  • Hypermarkets/Supermarket
  • Specialty Stores
  • Independent Small Grocers
  • Other Grocery Retailers
  • Non-grocery Retailers
  • Pop Up Store
  • Mixed Retailers

By Region:

  • North America
  • Latin America
  • Western Europe
  • Eastern Europe
  • East Asia
  • South Asia & Pacific
  • Middle East and Africa

Table of Content

  1. Executive Summary
    • Global Market Outlook
    • Demand-side Trends
    • Supply-side Trends
    • Technology Roadmap Analysis
    • Analysis and Recommendations
  2. Market Overview
    • Market Coverage / Taxonomy
    • Market Definition / Scope / Limitations
  3. Market Background
    • Market Dynamics
      • Drivers
      • Restraints
      • Opportunity
      • Trends
    • Scenario Forecast
      • Demand in Optimistic Scenario
      • Demand in Likely Scenario
      • Demand in Conservative Scenario
    • Opportunity Map Analysis
    • Product Life Cycle Analysis
    • Supply Chain Analysis
      • Supply Side Participants and their Roles
        • Producers
        • Mid-Level Participants (Traders/ Agents/ Brokers)
        • Wholesalers and Distributors
      • Value Added and Value Created at Node in the Supply Chain
      • List of Raw Material Suppliers
      • List of Existing and Potential Buyer’s
    • Investment Feasibility Matrix
    • Value Chain Analysis
      • Profit Margin Analysis
      • Wholesalers and Distributors
      • Retailers
    • PESTLE and Porter’s Analysis
    • Regulatory Landscape
      • By Key Regions
      • By Key Countries
    • Regional Parent Market Outlook
    • Production and Consumption Statistics
    • Import and Export Statistics
  4. Global Market Analysis 2020 to 2024 and Forecast, 2025 to 2035
    • Historical Market Size Value (USD billion) & Volume (Kilotons) Analysis, 2020 to 2024
    • Current and Future Market Size Value (USD billion) & Volume (Kilotons) Projections, 2025 to 2035
      • Y-o-Y Growth Trend Analysis
      • Absolute $ Opportunity Analysis
  5. Global Market Pricing Analysis 2020 to 2024 and Forecast 2025 to 2035
  6. Global Market Analysis 2020 to 2024 and Forecast 2025 to 2035, By Product Type
    • Introduction / Key Findings
    • Historical Market Size Value (USD billion) & Volume (Kilotons) Analysis By Product Type, 2020 to 2024
    • Current and Future Market Size Value (USD billion) & Volume (Kilotons) Analysis and Forecast By Product Type, 2025 to 2035
      • Vegetable
      • Fish
      • Pork
      • Chicken
      • Beef
      • Others
        • Lamb
        • Ham
    • Y-o-Y Growth Trend Analysis By Product Type, 2020 to 2024
    • Absolute $ Opportunity Analysis By Product Type, 2025 to 2035
  7. Global Market Analysis 2020 to 2024 and Forecast 2025 to 2035, By Nature
    • Introduction / Key Findings
    • Historical Market Size Value (USD billion) & Volume (Kilotons) Analysis By Nature, 2020 to 2024
    • Current and Future Market Size Value (USD billion) & Volume (Kilotons) Analysis and Forecast By Nature, 2025 to 2035
      • Organic
      • Vegan
      • Conventional
    • Y-o-Y Growth Trend Analysis By Nature, 2020 to 2024
    • Absolute $ Opportunity Analysis By Nature, 2025 to 2035
  8. Global Market Analysis 2020 to 2024 and Forecast 2025 to 2035, By Form
    • Introduction / Key Findings
    • Historical Market Size Value (USD billion) & Volume (Kilotons) Analysis By Form, 2020 to 2024
    • Current and Future Market Size Value (USD billion) & Volume (Kilotons) Analysis and Forecast By Form, 2025 to 2035
      • Cubes
      • Tablet
    • Y-o-Y Growth Trend Analysis By Form, 2020 to 2024
    • Absolute $ Opportunity Analysis By Form, 2025 to 2035
  9. Global Market Analysis 2020 to 2024 and Forecast 2025 to 2035, By Processing Type
    • Introduction / Key Findings
    • Historical Market Size Value (USD billion) & Volume (Kilotons) Analysis By Processing Type, 2020 to 2024
    • Current and Future Market Size Value (USD billion) & Volume (Kilotons) Analysis and Forecast By Processing Type, 2025 to 2035
      • Pressed Products
      • Extruded Products
    • Y-o-Y Growth Trend Analysis By Processing Type, 2020 to 2024
    • Absolute $ Opportunity Analysis By Processing Type, 2025 to 2035
  10. Global Market Analysis 2020 to 2024 and Forecast 2025 to 2035, By Packaging Format
    • Introduction / Key Findings
    • Historical Market Size Value (USD billion) & Volume (Kilotons) Analysis By Packaging Format, 2020 to 2024
    • Current and Future Market Size Value (USD billion) & Volume (Kilotons) Analysis and Forecast By Packaging Format, 2025 to 2035
      • Box
      • Packet/Sachet
      • Jars
        • Plastic
        • Glass
    • Y-o-Y Growth Trend Analysis By Packaging Format, 2020 to 2024
    • Absolute $ Opportunity Analysis By Packaging Format, 2025 to 2035
  11. Global Market Analysis 2020 to 2024 and Forecast 2025 to 2035, By Sales Channel
    • Introduction / Key Findings
    • Historical Market Size Value (USD billion) & Volume (Kilotons) Analysis By Sales Channel, 2020 to 2024
    • Current and Future Market Size Value (USD billion) & Volume (Kilotons) Analysis and Forecast By Sales Channel, 2025 to 2035
      • Food Processing Companies/Brands
      • Private Lable Brands
      • Food Service (HoReCa)
      • Retail Sales B2C
        • Onine Retailing
        • Storebased Retailing (Convenience Stores, Discount Stores, Hypermarkets/Supermarkets, Specialty Stores, Independent Small Grocers, Other Grocery Retailers, Non-grocery Retailers, Pop-Up Stores, Mixed Retailers)
    • Y-o-Y Growth Trend Analysis By Sales Channel, 2020 to 2024
    • Absolute $ Opportunity Analysis By Sales Channel, 2025 to 2035
  12. Global Market Analysis 2020 to 2024 and Forecast 2025 to 2035, By Region
    • Introduction
    • Historical Market Size Value (USD billion) & Volume (Kilotons) Analysis By Region, 2020 to 2024
    • Current Market Size Value (USD billion) & Volume (Kilotons) Analysis and Forecast By Region, 2025 to 2035
      • North America
      • Latin America
      • Western Europe
      • Eastern Europe
      • East Asia
      • South Asia & Pacific
      • Middle East and Africa
    • Market Attractiveness Analysis By Region
  13. North America Market Analysis 2020 to 2024 and Forecast 2025 to 2035, By Country
    • Historical Market Size Value (USD billion) & Volume (Kilotons) Trend Analysis By Market Taxonomy, 2020 to 2024
    • Market Size Value (USD billion) & Volume (Kilotons) Forecast By Market Taxonomy, 2025 to 2035
      • By Country
        • USA
        • Canada
        • Mexico
      • By Product Type
      • By Nature
      • By Form
      • By Processing Type
      • By Packaging Format
      • By Sales Channel
    • Market Attractiveness Analysis
      • By Country
      • By Product Type
      • By Nature
      • By Form
      • By Processing Type
      • By Packaging Format
      • By Sales Channel
    • Key Takeaways
  14. Latin America Market Analysis 2020 to 2024 and Forecast 2025 to 2035, By Country
    • Historical Market Size Value (USD billion) & Volume (Kilotons) Trend Analysis By Market Taxonomy, 2020 to 2024
    • Market Size Value (USD billion) & Volume (Kilotons) Forecast By Market Taxonomy, 2025 to 2035
      • By Country
        • Brazil
        • Argentina
        • Rest of LATAM
      • By Product Type
      • By Nature
      • By Form
      • By Processing Type
      • By Packaging Format
      • By Sales Channel
    • Market Attractiveness Analysis
      • By Country
      • By Product Type
      • By Nature
      • By Form
      • By Processing Type
      • By Packaging Format
      • By Sales Channel
    • Key Takeaways
  15. Western Europe Market Analysis 2020 to 2024 and Forecast 2025 to 2035, By Country
    • Historical Market Size Value (USD billion) & Volume (Kilotons) Trend Analysis By Market Taxonomy, 2020 to 2024
    • Market Size Value (USD billion) & Volume (Kilotons) Forecast By Market Taxonomy, 2025 to 2035
      • By Country
        • Germany
        • Italy
        • France
        • UK
        • Spain
        • BENELUX
        • Nordic
        • Rest of W.Europe
      • By Product Type
      • By Nature
      • By Form
      • By Processing Type
      • By Packaging Format
      • By Sales Channel
    • Market Attractiveness Analysis
      • By Country
      • By Product Type
      • By Nature
      • By Form
      • By Processing Type
      • By Packaging Format
      • By Sales Channel
    • Key Takeaways
  16. Eastern Europe Market Analysis 2020 to 2024 and Forecast 2025 to 2035, By Country
    • Historical Market Size Value (USD billion) & Volume (Kilotons) Trend Analysis By Market Taxonomy, 2020 to 2024
    • Market Size Value (USD billion) & Volume (Kilotons) Forecast By Market Taxonomy, 2025 to 2035
      • By Country
        • Russia
        • Hungary
        • Poland
        • Balkan & Baltics
        • Rest of E. Europe
      • By Product Type
      • By Nature
      • By Form
      • By Processing Type
      • By Packaging Format
      • By Sales Channel
    • Market Attractiveness Analysis
      • By Country
      • By Product Type
      • By Nature
      • By Form
      • By Processing Type
      • By Packaging Format
      • By Sales Channel
    • Key Takeaways
  17. East Asia Market Analysis 2020 to 2024 and Forecast 2025 to 2035, By Country
    • Historical Market Size Value (USD billion) & Volume (Kilotons) Trend Analysis By Market Taxonomy, 2020 to 2024
    • Market Size Value (USD billion) & Volume (Kilotons) Forecast By Market Taxonomy, 2025 to 2035
      • By Country
        • China
        • Japan
        • South Korea
      • By Product Type
      • By Nature
      • By Form
      • By Processing Type
      • By Packaging Format
      • By Sales Channel
    • Market Attractiveness Analysis
      • By Country
      • By Product Type
      • By Nature
      • By Form
      • By Processing Type
      • By Packaging Format
      • By Sales Channel
    • Key Takeaways
  18. South Asia & Pacific Market Analysis 2020 to 2024 and Forecast 2025 to 2035, By Country
    • Historical Market Size Value (USD billion) & Volume (Kilotons) Trend Analysis By Market Taxonomy, 2020 to 2024
    • Market Size Value (USD billion) & Volume (Kilotons) Forecast By Market Taxonomy, 2025 to 2035
      • By Country
        • India
        • Australia & New Zealand
        • ASEAN
        • Rest of SAP
      • By Product Type
      • By Nature
      • By Form
      • By Processing Type
      • By Packaging Format
      • By Sales Channel
    • Market Attractiveness Analysis
      • By Country
      • By Product Type
      • By Nature
      • By Form
      • By Processing Type
      • By Packaging Format
      • By Sales Channel
    • Key Takeaways
  19. Middle East and Africa Market Analysis 2020 to 2024 and Forecast 2025 to 2035, By Country
    • Historical Market Size Value (USD billion) & Volume (Kilotons) Trend Analysis By Market Taxonomy, 2020 to 2024
    • Market Size Value (USD billion) & Volume (Kilotons) Forecast By Market Taxonomy, 2025 to 2035
      • By Country
        • GCC Countries
        • Northern Africa
        • South Africa
        • Turkiye
        • Rest of MEA
      • By Product Type
      • By Nature
      • By Form
      • By Processing Type
      • By Packaging Format
      • By Sales Channel
    • Market Attractiveness Analysis
      • By Country
      • By Product Type
      • By Nature
      • By Form
      • By Processing Type
      • By Packaging Format
      • By Sales Channel
    • Key Takeaways
  20. Key Countries Market Analysis
    • USA
      • Pricing Analysis
      • Market Share Analysis, 2024
        • By Product Type
        • By Nature
        • By Form
        • By Processing Type
        • By Packaging Format
        • By Sales Channel
    • Canada
      • Pricing Analysis
      • Market Share Analysis, 2024
        • By Product Type
        • By Nature
        • By Form
        • By Processing Type
        • By Packaging Format
        • By Sales Channel
    • Brazil
      • Pricing Analysis
      • Market Share Analysis, 2024
        • By Product Type
        • By Nature
        • By Form
        • By Processing Type
        • By Packaging Format
        • By Sales Channel
    • Mexico
      • Pricing Analysis
      • Market Share Analysis, 2024
        • By Product Type
        • By Nature
        • By Form
        • By Processing Type
        • By Packaging Format
        • By Sales Channel
    • Argentina
      • Pricing Analysis
      • Market Share Analysis, 2024
        • By Product Type
        • By Nature
        • By Form
        • By Processing Type
        • By Packaging Format
        • By Sales Channel
  21. Market Structure Analysis
    • Competition Dashboard
    • Competition Benchmarking
    • Market Share Analysis of Top Players
      • By Regional
      • By Product Type
      • By Nature
      • By Form
      • By Processing Type
      • By Packaging Format
      • By Sales Channel
  22. Competition Analysis
    • Competition Deep Dive
      • Unilever PLC
        • Overview
        • Product Portfolio
        • Profitability by Market Segments (Product/Age /Sales Channel/Region)
        • Sales Footprint
        • Strategy Overview
          • Marketing Strategy
          • Product Strategy
          • Channel Strategy
      • Nestle S.A
        • Overview
        • Product Portfolio
        • Profitability by Market Segments (Product/Age /Sales Channel/Region)
        • Sales Footprint
        • Strategy Overview
          • Marketing Strategy
          • Product Strategy
          • Channel Strategy
      • The Kraft Heinz Company
        • Overview
        • Product Portfolio
        • Profitability by Market Segments (Product/Age /Sales Channel/Region)
        • Sales Footprint
        • Strategy Overview
          • Marketing Strategy
          • Product Strategy
          • Channel Strategy
      • Bell Food Group
        • Overview
        • Product Portfolio
        • Profitability by Market Segments (Product/Age /Sales Channel/Region)
        • Sales Footprint
        • Strategy Overview
          • Marketing Strategy
          • Product Strategy
          • Channel Strategy
      • Hormel Foods Corporation
        • Overview
        • Product Portfolio
        • Profitability by Market Segments (Product/Age /Sales Channel/Region)
        • Sales Footprint
        • Strategy Overview
          • Marketing Strategy
          • Product Strategy
          • Channel Strategy
      • Kallo Food Ltd.
        • Overview
        • Product Portfolio
        • Profitability by Market Segments (Product/Age /Sales Channel/Region)
        • Sales Footprint
        • Strategy Overview
          • Marketing Strategy
          • Product Strategy
          • Channel Strategy
      • PREMIER FOODS
        • Overview
        • Product Portfolio
        • Profitability by Market Segments (Product/Age /Sales Channel/Region)
        • Sales Footprint
        • Strategy Overview
          • Marketing Strategy
          • Product Strategy
          • Channel Strategy
      • Ajinomoto Co., Inc.
        • Overview
        • Product Portfolio
        • Profitability by Market Segments (Product/Age /Sales Channel/Region)
        • Sales Footprint
        • Strategy Overview
          • Marketing Strategy
          • Product Strategy
          • Channel Strategy
      • BOU Brand LLC
        • Overview
        • Product Portfolio
        • Profitability by Market Segments (Product/Age /Sales Channel/Region)
        • Sales Footprint
        • Strategy Overview
          • Marketing Strategy
          • Product Strategy
          • Channel Strategy
      • CALDOS DEL NORTE SL
        • Overview
        • Product Portfolio
        • Profitability by Market Segments (Product/Age /Sales Channel/Region)
        • Sales Footprint
        • Strategy Overview
          • Marketing Strategy
          • Product Strategy
          • Channel Strategy
      • Gbfoods Group
        • Overview
        • Product Portfolio
        • Profitability by Market Segments (Product/Age /Sales Channel/Region)
        • Sales Footprint
        • Strategy Overview
          • Marketing Strategy
          • Product Strategy
          • Channel Strategy
      • IMANA FOODS (SA) (PTY) LTD
        • Overview
        • Product Portfolio
        • Profitability by Market Segments (Product/Age /Sales Channel/Region)
        • Sales Footprint
        • Strategy Overview
          • Marketing Strategy
          • Product Strategy
          • Channel Strategy
      • Edwards & Sons Trading Company, Inc.
        • Overview
        • Product Portfolio
        • Profitability by Market Segments (Product/Age /Sales Channel/Region)
        • Sales Footprint
        • Strategy Overview
          • Marketing Strategy
          • Product Strategy
          • Channel Strategy
      • Goya Foods, Inc.
        • Overview
        • Product Portfolio
        • Profitability by Market Segments (Product/Age /Sales Channel/Region)
        • Sales Footprint
        • Strategy Overview
          • Marketing Strategy
          • Product Strategy
          • Channel Strategy
      • Promasidor
        • Overview
        • Product Portfolio
        • Profitability by Market Segments (Product/Age /Sales Channel/Region)
        • Sales Footprint
        • Strategy Overview
          • Marketing Strategy
          • Product Strategy
          • Channel Strategy
      • Patisen
        • Overview
        • Product Portfolio
        • Profitability by Market Segments (Product/Age /Sales Channel/Region)
        • Sales Footprint
        • Strategy Overview
          • Marketing Strategy
          • Product Strategy
          • Channel Strategy
      • Doyin Group
        • Overview
        • Product Portfolio
        • Profitability by Market Segments (Product/Age /Sales Channel/Region)
        • Sales Footprint
        • Strategy Overview
          • Marketing Strategy
          • Product Strategy
          • Channel Strategy
      • Daily-Need Group
        • Overview
        • Product Portfolio
        • Profitability by Market Segments (Product/Age /Sales Channel/Region)
        • Sales Footprint
        • Strategy Overview
          • Marketing Strategy
          • Product Strategy
          • Channel Strategy
      • TESCO PLC
        • Overview
        • Product Portfolio
        • Profitability by Market Segments (Product/Age /Sales Channel/Region)
        • Sales Footprint
        • Strategy Overview
          • Marketing Strategy
          • Product Strategy
          • Channel Strategy
  23. Assumptions & Acronyms Used
  24. Research Methodology

List of Tables

  • Table 1: Global Market Value (USD billion) Forecast by Region, 2020-2035
  • Table 2: Global Market Volume (Kilotons) Forecast by Region, 2020-2035
  • Table 3: Global Market Value (USD billion) Forecast by Product Type, 2020-2035
  • Table 4: Global Market Volume (Kilotons) Forecast by Product Type, 2020-2035
  • Table 5: Global Market Value (USD billion) Forecast by Nature, 2020-2035
  • Table 6: Global Market Volume (Kilotons) Forecast by Nature, 2020-2035
  • Table 7: Global Market Value (USD billion) Forecast by Form, 2020-2035
  • Table 8: Global Market Volume (Kilotons) Forecast by Form, 2020-2035
  • Table 9: Global Market Value (USD billion) Forecast by Processing Type, 2020-2035
  • Table 10: Global Market Volume (Kilotons) Forecast by Processing Type, 2020-2035
  • Table 11: Global Market Value (USD billion) Forecast by Packaging Format, 2020-2035
  • Table 12: Global Market Volume (Kilotons) Forecast by Packaging Format, 2020-2035
  • Table 13: Global Market Value (USD billion) Forecast by Sales Channel, 2020-2035
  • Table 14: Global Market Volume (Kilotons) Forecast by Sales Channel, 2020-2035
  • Table 15: North America Market Value (USD billion) Forecast by Country, 2020-2035
  • Table 16: North America Market Volume (Kilotons) Forecast by Country, 2020-2035
  • Table 17: North America Market Value (USD billion) Forecast by Product Type, 2020-2035
  • Table 18: North America Market Volume (Kilotons) Forecast by Product Type, 2020-2035
  • Table 19: North America Market Value (USD billion) Forecast by Nature, 2020-2035
  • Table 20: North America Market Volume (Kilotons) Forecast by Nature, 2020-2035
  • Table 21: North America Market Value (USD billion) Forecast by Form, 2020-2035
  • Table 22: North America Market Volume (Kilotons) Forecast by Form, 2020-2035
  • Table 23: North America Market Value (USD billion) Forecast by Processing Type, 2020-2035
  • Table 24: North America Market Volume (Kilotons) Forecast by Processing Type, 2020-2035
  • Table 25: North America Market Value (USD billion) Forecast by Packaging Format, 2020-2035
  • Table 26: North America Market Volume (Kilotons) Forecast by Packaging Format, 2020-2035
  • Table 27: North America Market Value (USD billion) Forecast by Sales Channel, 2020-2035
  • Table 28: North America Market Volume (Kilotons) Forecast by Sales Channel, 2020-2035
  • Table 29: Latin America Market Value (USD billion) Forecast by Country, 2020-2035
  • Table 30: Latin America Market Volume (Kilotons) Forecast by Country, 2020-2035
  • Table 31: Latin America Market Value (USD billion) Forecast by Product Type, 2020-2035
  • Table 32: Latin America Market Volume (Kilotons) Forecast by Product Type, 2020-2035
  • Table 33: Latin America Market Value (USD billion) Forecast by Nature, 2020-2035
  • Table 34: Latin America Market Volume (Kilotons) Forecast by Nature, 2020-2035
  • Table 35: Latin America Market Value (USD billion) Forecast by Form, 2020-2035
  • Table 36: Latin America Market Volume (Kilotons) Forecast by Form, 2020-2035
  • Table 37: Latin America Market Value (USD billion) Forecast by Processing Type, 2020-2035
  • Table 38: Latin America Market Volume (Kilotons) Forecast by Processing Type, 2020-2035
  • Table 39: Latin America Market Value (USD billion) Forecast by Packaging Format, 2020-2035
  • Table 40: Latin America Market Volume (Kilotons) Forecast by Packaging Format, 2020-2035
  • Table 41: Latin America Market Value (USD billion) Forecast by Sales Channel, 2020-2035
  • Table 42: Latin America Market Volume (Kilotons) Forecast by Sales Channel, 2020-2035
  • Table 43: Western Europe Market Value (USD billion) Forecast by Country, 2020-2035
  • Table 44: Western Europe Market Volume (Kilotons) Forecast by Country, 2020-2035
  • Table 45: Western Europe Market Value (USD billion) Forecast by Product Type, 2020-2035
  • Table 46: Western Europe Market Volume (Kilotons) Forecast by Product Type, 2020-2035
  • Table 47: Western Europe Market Value (USD billion) Forecast by Nature, 2020-2035
  • Table 48: Western Europe Market Volume (Kilotons) Forecast by Nature, 2020-2035
  • Table 49: Western Europe Market Value (USD billion) Forecast by Form, 2020-2035
  • Table 50: Western Europe Market Volume (Kilotons) Forecast by Form, 2020-2035
  • Table 51: Western Europe Market Value (USD billion) Forecast by Processing Type, 2020-2035
  • Table 52: Western Europe Market Volume (Kilotons) Forecast by Processing Type, 2020-2035
  • Table 53: Western Europe Market Value (USD billion) Forecast by Packaging Format, 2020-2035
  • Table 54: Western Europe Market Volume (Kilotons) Forecast by Packaging Format, 2020-2035
  • Table 55: Western Europe Market Value (USD billion) Forecast by Sales Channel, 2020-2035
  • Table 56: Western Europe Market Volume (Kilotons) Forecast by Sales Channel, 2020-2035
  • Table 57: Eastern Europe Market Value (USD billion) Forecast by Country, 2020-2035
  • Table 58: Eastern Europe Market Volume (Kilotons) Forecast by Country, 2020-2035
  • Table 59: Eastern Europe Market Value (USD billion) Forecast by Product Type, 2020-2035
  • Table 60: Eastern Europe Market Volume (Kilotons) Forecast by Product Type, 2020-2035
  • Table 61: Eastern Europe Market Value (USD billion) Forecast by Nature, 2020-2035
  • Table 62: Eastern Europe Market Volume (Kilotons) Forecast by Nature, 2020-2035
  • Table 63: Eastern Europe Market Value (USD billion) Forecast by Form, 2020-2035
  • Table 64: Eastern Europe Market Volume (Kilotons) Forecast by Form, 2020-2035
  • Table 65: Eastern Europe Market Value (USD billion) Forecast by Processing Type, 2020-2035
  • Table 66: Eastern Europe Market Volume (Kilotons) Forecast by Processing Type, 2020-2035
  • Table 67: Eastern Europe Market Value (USD billion) Forecast by Packaging Format, 2020-2035
  • Table 68: Eastern Europe Market Volume (Kilotons) Forecast by Packaging Format, 2020-2035
  • Table 69: Eastern Europe Market Value (USD billion) Forecast by Sales Channel, 2020-2035
  • Table 70: Eastern Europe Market Volume (Kilotons) Forecast by Sales Channel, 2020-2035
  • Table 71: East Asia Market Value (USD billion) Forecast by Country, 2020-2035
  • Table 72: East Asia Market Volume (Kilotons) Forecast by Country, 2020-2035
  • Table 73: East Asia Market Value (USD billion) Forecast by Product Type, 2020-2035
  • Table 74: East Asia Market Volume (Kilotons) Forecast by Product Type, 2020-2035
  • Table 75: East Asia Market Value (USD billion) Forecast by Nature, 2020-2035
  • Table 76: East Asia Market Volume (Kilotons) Forecast by Nature, 2020-2035
  • Table 77: East Asia Market Value (USD billion) Forecast by Form, 2020-2035
  • Table 78: East Asia Market Volume (Kilotons) Forecast by Form, 2020-2035
  • Table 79: East Asia Market Value (USD billion) Forecast by Processing Type, 2020-2035
  • Table 80: East Asia Market Volume (Kilotons) Forecast by Processing Type, 2020-2035
  • Table 81: East Asia Market Value (USD billion) Forecast by Packaging Format, 2020-2035
  • Table 82: East Asia Market Volume (Kilotons) Forecast by Packaging Format, 2020-2035
  • Table 83: East Asia Market Value (USD billion) Forecast by Sales Channel, 2020-2035
  • Table 84: East Asia Market Volume (Kilotons) Forecast by Sales Channel, 2020-2035
  • Table 85: South Asia & Pacific Market Value (USD billion) Forecast by Country, 2020-2035
  • Table 86: South Asia & Pacific Market Volume (Kilotons) Forecast by Country, 2020-2035
  • Table 87: South Asia & Pacific Market Value (USD billion) Forecast by Product Type, 2020-2035
  • Table 88: South Asia & Pacific Market Volume (Kilotons) Forecast by Product Type, 2020-2035
  • Table 89: South Asia & Pacific Market Value (USD billion) Forecast by Nature, 2020-2035
  • Table 90: South Asia & Pacific Market Volume (Kilotons) Forecast by Nature, 2020-2035
  • Table 91: South Asia & Pacific Market Value (USD billion) Forecast by Form, 2020-2035
  • Table 92: South Asia & Pacific Market Volume (Kilotons) Forecast by Form, 2020-2035
  • Table 93: South Asia & Pacific Market Value (USD billion) Forecast by Processing Type, 2020-2035
  • Table 94: South Asia & Pacific Market Volume (Kilotons) Forecast by Processing Type, 2020-2035
  • Table 95: South Asia & Pacific Market Value (USD billion) Forecast by Packaging Format, 2020-2035
  • Table 96: South Asia & Pacific Market Volume (Kilotons) Forecast by Packaging Format, 2020-2035
  • Table 97: South Asia & Pacific Market Value (USD billion) Forecast by Sales Channel, 2020-2035
  • Table 98: South Asia & Pacific Market Volume (Kilotons) Forecast by Sales Channel, 2020-2035
  • Table 99: Middle East and Africa Market Value (USD billion) Forecast by Country, 2020-2035
  • Table 100: Middle East and Africa Market Volume (Kilotons) Forecast by Country, 2020-2035
  • Table 101: Middle East and Africa Market Value (USD billion) Forecast by Product Type, 2020-2035
  • Table 102: Middle East and Africa Market Volume (Kilotons) Forecast by Product Type, 2020-2035
  • Table 103: Middle East and Africa Market Value (USD billion) Forecast by Nature, 2020-2035
  • Table 104: Middle East and Africa Market Volume (Kilotons) Forecast by Nature, 2020-2035
  • Table 105: Middle East and Africa Market Value (USD billion) Forecast by Form, 2020-2035
  • Table 106: Middle East and Africa Market Volume (Kilotons) Forecast by Form, 2020-2035
  • Table 107: Middle East and Africa Market Value (USD billion) Forecast by Processing Type, 2020-2035
  • Table 108: Middle East and Africa Market Volume (Kilotons) Forecast by Processing Type, 2020-2035
  • Table 109: Middle East and Africa Market Value (USD billion) Forecast by Packaging Format, 2020-2035
  • Table 110: Middle East and Africa Market Volume (Kilotons) Forecast by Packaging Format, 2020-2035
  • Table 111: Middle East and Africa Market Value (USD billion) Forecast by Sales Channel, 2020-2035
  • Table 112: Middle East and Africa Market Volume (Kilotons) Forecast by Sales Channel, 2020-2035

List of Figures

  • Figure 1: Global Market Volume (Kilotons) Forecast 2020-2035
  • Figure 2: Global Market Pricing Analysis
  • Figure 3: Global Market Value (USD billion) Forecast 2020-2035
  • Figure 4: Global Market Value Share and BPS Analysis by Product Type, 2025 and 2035
  • Figure 5: Global Market Y-o-Y Growth Comparison by Product Type, 2025-2035
  • Figure 6: Global Market Attractiveness Analysis by Product Type
  • Figure 7: Global Market Value Share and BPS Analysis by Nature, 2025 and 2035
  • Figure 8: Global Market Y-o-Y Growth Comparison by Nature, 2025-2035
  • Figure 9: Global Market Attractiveness Analysis by Nature
  • Figure 10: Global Market Value Share and BPS Analysis by Form, 2025 and 2035
  • Figure 11: Global Market Y-o-Y Growth Comparison by Form, 2025-2035
  • Figure 12: Global Market Attractiveness Analysis by Form
  • Figure 13: Global Market Value Share and BPS Analysis by Processing Type, 2025 and 2035
  • Figure 14: Global Market Y-o-Y Growth Comparison by Processing Type, 2025-2035
  • Figure 15: Global Market Attractiveness Analysis by Processing Type
  • Figure 16: Global Market Value Share and BPS Analysis by Packaging Format, 2025 and 2035
  • Figure 17: Global Market Y-o-Y Growth Comparison by Packaging Format, 2025-2035
  • Figure 18: Global Market Attractiveness Analysis by Packaging Format
  • Figure 19: Global Market Value Share and BPS Analysis by Sales Channel, 2025 and 2035
  • Figure 20: Global Market Y-o-Y Growth Comparison by Sales Channel, 2025-2035
  • Figure 21: Global Market Attractiveness Analysis by Sales Channel
  • Figure 22: Global Market Value (USD billion) Share and BPS Analysis by Region, 2025 and 2035
  • Figure 23: Global Market Y-o-Y Growth Comparison by Region, 2025-2035
  • Figure 24: Global Market Attractiveness Analysis by Region
  • Figure 25: North America Market Incremental $ Opportunity, 2025-2035
  • Figure 26: Latin America Market Incremental $ Opportunity, 2025-2035
  • Figure 27: Western Europe Market Incremental $ Opportunity, 2025-2035
  • Figure 28: Eastern Europe Market Incremental $ Opportunity, 2025-2035
  • Figure 29: East Asia Market Incremental $ Opportunity, 2025-2035
  • Figure 30: South Asia & Pacific Market Incremental $ Opportunity, 2025-2035
  • Figure 31: Middle East and Africa Market Incremental $ Opportunity, 2025-2035
  • Figure 32: North America Market Value Share and BPS Analysis by Country, 2025 and 2035
  • Figure 33: North America Market Value Share and BPS Analysis by Product Type, 2025 and 2035
  • Figure 34: North America Market Y-o-Y Growth Comparison by Product Type, 2025-2035
  • Figure 35: North America Market Attractiveness Analysis by Product Type
  • Figure 36: North America Market Value Share and BPS Analysis by Nature, 2025 and 2035
  • Figure 37: North America Market Y-o-Y Growth Comparison by Nature, 2025-2035
  • Figure 38: North America Market Attractiveness Analysis by Nature
  • Figure 39: North America Market Value Share and BPS Analysis by Form, 2025 and 2035
  • Figure 40: North America Market Y-o-Y Growth Comparison by Form, 2025-2035
  • Figure 41: North America Market Attractiveness Analysis by Form
  • Figure 42: North America Market Value Share and BPS Analysis by Processing Type, 2025 and 2035
  • Figure 43: North America Market Y-o-Y Growth Comparison by Processing Type, 2025-2035
  • Figure 44: North America Market Attractiveness Analysis by Processing Type
  • Figure 45: North America Market Value Share and BPS Analysis by Packaging Format, 2025 and 2035
  • Figure 46: North America Market Y-o-Y Growth Comparison by Packaging Format, 2025-2035
  • Figure 47: North America Market Attractiveness Analysis by Packaging Format
  • Figure 48: North America Market Value Share and BPS Analysis by Sales Channel, 2025 and 2035
  • Figure 49: North America Market Y-o-Y Growth Comparison by Sales Channel, 2025-2035
  • Figure 50: North America Market Attractiveness Analysis by Sales Channel
  • Figure 51: Latin America Market Value Share and BPS Analysis by Country, 2025 and 2035
  • Figure 52: Latin America Market Value Share and BPS Analysis by Product Type, 2025 and 2035
  • Figure 53: Latin America Market Y-o-Y Growth Comparison by Product Type, 2025-2035
  • Figure 54: Latin America Market Attractiveness Analysis by Product Type
  • Figure 55: Latin America Market Value Share and BPS Analysis by Nature, 2025 and 2035
  • Figure 56: Latin America Market Y-o-Y Growth Comparison by Nature, 2025-2035
  • Figure 57: Latin America Market Attractiveness Analysis by Nature
  • Figure 58: Latin America Market Value Share and BPS Analysis by Form, 2025 and 2035
  • Figure 59: Latin America Market Y-o-Y Growth Comparison by Form, 2025-2035
  • Figure 60: Latin America Market Attractiveness Analysis by Form
  • Figure 61: Latin America Market Value Share and BPS Analysis by Processing Type, 2025 and 2035
  • Figure 62: Latin America Market Y-o-Y Growth Comparison by Processing Type, 2025-2035
  • Figure 63: Latin America Market Attractiveness Analysis by Processing Type
  • Figure 64: Latin America Market Value Share and BPS Analysis by Packaging Format, 2025 and 2035
  • Figure 65: Latin America Market Y-o-Y Growth Comparison by Packaging Format, 2025-2035
  • Figure 66: Latin America Market Attractiveness Analysis by Packaging Format
  • Figure 67: Latin America Market Value Share and BPS Analysis by Sales Channel, 2025 and 2035
  • Figure 68: Latin America Market Y-o-Y Growth Comparison by Sales Channel, 2025-2035
  • Figure 69: Latin America Market Attractiveness Analysis by Sales Channel
  • Figure 70: Western Europe Market Value Share and BPS Analysis by Country, 2025 and 2035
  • Figure 71: Western Europe Market Value Share and BPS Analysis by Product Type, 2025 and 2035
  • Figure 72: Western Europe Market Y-o-Y Growth Comparison by Product Type, 2025-2035
  • Figure 73: Western Europe Market Attractiveness Analysis by Product Type
  • Figure 74: Western Europe Market Value Share and BPS Analysis by Nature, 2025 and 2035
  • Figure 75: Western Europe Market Y-o-Y Growth Comparison by Nature, 2025-2035
  • Figure 76: Western Europe Market Attractiveness Analysis by Nature
  • Figure 77: Western Europe Market Value Share and BPS Analysis by Form, 2025 and 2035
  • Figure 78: Western Europe Market Y-o-Y Growth Comparison by Form, 2025-2035
  • Figure 79: Western Europe Market Attractiveness Analysis by Form
  • Figure 80: Western Europe Market Value Share and BPS Analysis by Processing Type, 2025 and 2035
  • Figure 81: Western Europe Market Y-o-Y Growth Comparison by Processing Type, 2025-2035
  • Figure 82: Western Europe Market Attractiveness Analysis by Processing Type
  • Figure 83: Western Europe Market Value Share and BPS Analysis by Packaging Format, 2025 and 2035
  • Figure 84: Western Europe Market Y-o-Y Growth Comparison by Packaging Format, 2025-2035
  • Figure 85: Western Europe Market Attractiveness Analysis by Packaging Format
  • Figure 86: Western Europe Market Value Share and BPS Analysis by Sales Channel, 2025 and 2035
  • Figure 87: Western Europe Market Y-o-Y Growth Comparison by Sales Channel, 2025-2035
  • Figure 88: Western Europe Market Attractiveness Analysis by Sales Channel
  • Figure 89: Eastern Europe Market Value Share and BPS Analysis by Country, 2025 and 2035
  • Figure 90: Eastern Europe Market Value Share and BPS Analysis by Product Type, 2025 and 2035
  • Figure 91: Eastern Europe Market Y-o-Y Growth Comparison by Product Type, 2025-2035
  • Figure 92: Eastern Europe Market Attractiveness Analysis by Product Type
  • Figure 93: Eastern Europe Market Value Share and BPS Analysis by Nature, 2025 and 2035
  • Figure 94: Eastern Europe Market Y-o-Y Growth Comparison by Nature, 2025-2035
  • Figure 95: Eastern Europe Market Attractiveness Analysis by Nature
  • Figure 96: Eastern Europe Market Value Share and BPS Analysis by Form, 2025 and 2035
  • Figure 97: Eastern Europe Market Y-o-Y Growth Comparison by Form, 2025-2035
  • Figure 98: Eastern Europe Market Attractiveness Analysis by Form
  • Figure 99: Eastern Europe Market Value Share and BPS Analysis by Processing Type, 2025 and 2035
  • Figure 100: Eastern Europe Market Y-o-Y Growth Comparison by Processing Type, 2025-2035
  • Figure 101: Eastern Europe Market Attractiveness Analysis by Processing Type
  • Figure 102: Eastern Europe Market Value Share and BPS Analysis by Packaging Format, 2025 and 2035
  • Figure 103: Eastern Europe Market Y-o-Y Growth Comparison by Packaging Format, 2025-2035
  • Figure 104: Eastern Europe Market Attractiveness Analysis by Packaging Format
  • Figure 105: Eastern Europe Market Value Share and BPS Analysis by Sales Channel, 2025 and 2035
  • Figure 106: Eastern Europe Market Y-o-Y Growth Comparison by Sales Channel, 2025-2035
  • Figure 107: Eastern Europe Market Attractiveness Analysis by Sales Channel
  • Figure 108: East Asia Market Value Share and BPS Analysis by Country, 2025 and 2035
  • Figure 109: East Asia Market Value Share and BPS Analysis by Product Type, 2025 and 2035
  • Figure 110: East Asia Market Y-o-Y Growth Comparison by Product Type, 2025-2035
  • Figure 111: East Asia Market Attractiveness Analysis by Product Type
  • Figure 112: East Asia Market Value Share and BPS Analysis by Nature, 2025 and 2035
  • Figure 113: East Asia Market Y-o-Y Growth Comparison by Nature, 2025-2035
  • Figure 114: East Asia Market Attractiveness Analysis by Nature
  • Figure 115: East Asia Market Value Share and BPS Analysis by Form, 2025 and 2035
  • Figure 116: East Asia Market Y-o-Y Growth Comparison by Form, 2025-2035
  • Figure 117: East Asia Market Attractiveness Analysis by Form
  • Figure 118: East Asia Market Value Share and BPS Analysis by Processing Type, 2025 and 2035
  • Figure 119: East Asia Market Y-o-Y Growth Comparison by Processing Type, 2025-2035
  • Figure 120: East Asia Market Attractiveness Analysis by Processing Type
  • Figure 121: East Asia Market Value Share and BPS Analysis by Packaging Format, 2025 and 2035
  • Figure 122: East Asia Market Y-o-Y Growth Comparison by Packaging Format, 2025-2035
  • Figure 123: East Asia Market Attractiveness Analysis by Packaging Format
  • Figure 124: East Asia Market Value Share and BPS Analysis by Sales Channel, 2025 and 2035
  • Figure 125: East Asia Market Y-o-Y Growth Comparison by Sales Channel, 2025-2035
  • Figure 126: East Asia Market Attractiveness Analysis by Sales Channel
  • Figure 127: South Asia & Pacific Market Value Share and BPS Analysis by Country, 2025 and 2035
  • Figure 128: South Asia & Pacific Market Value Share and BPS Analysis by Product Type, 2025 and 2035
  • Figure 129: South Asia & Pacific Market Y-o-Y Growth Comparison by Product Type, 2025-2035
  • Figure 130: South Asia & Pacific Market Attractiveness Analysis by Product Type
  • Figure 131: South Asia & Pacific Market Value Share and BPS Analysis by Nature, 2025 and 2035
  • Figure 132: South Asia & Pacific Market Y-o-Y Growth Comparison by Nature, 2025-2035
  • Figure 133: South Asia & Pacific Market Attractiveness Analysis by Nature
  • Figure 134: South Asia & Pacific Market Value Share and BPS Analysis by Form, 2025 and 2035
  • Figure 135: South Asia & Pacific Market Y-o-Y Growth Comparison by Form, 2025-2035
  • Figure 136: South Asia & Pacific Market Attractiveness Analysis by Form
  • Figure 137: South Asia & Pacific Market Value Share and BPS Analysis by Processing Type, 2025 and 2035
  • Figure 138: South Asia & Pacific Market Y-o-Y Growth Comparison by Processing Type, 2025-2035
  • Figure 139: South Asia & Pacific Market Attractiveness Analysis by Processing Type
  • Figure 140: South Asia & Pacific Market Value Share and BPS Analysis by Packaging Format, 2025 and 2035
  • Figure 141: South Asia & Pacific Market Y-o-Y Growth Comparison by Packaging Format, 2025-2035
  • Figure 142: South Asia & Pacific Market Attractiveness Analysis by Packaging Format
  • Figure 143: South Asia & Pacific Market Value Share and BPS Analysis by Sales Channel, 2025 and 2035
  • Figure 144: South Asia & Pacific Market Y-o-Y Growth Comparison by Sales Channel, 2025-2035
  • Figure 145: South Asia & Pacific Market Attractiveness Analysis by Sales Channel
  • Figure 146: Middle East and Africa Market Value Share and BPS Analysis by Country, 2025 and 2035
  • Figure 147: Middle East and Africa Market Value Share and BPS Analysis by Product Type, 2025 and 2035
  • Figure 148: Middle East and Africa Market Y-o-Y Growth Comparison by Product Type, 2025-2035
  • Figure 149: Middle East and Africa Market Attractiveness Analysis by Product Type
  • Figure 150: Middle East and Africa Market Value Share and BPS Analysis by Nature, 2025 and 2035
  • Figure 151: Middle East and Africa Market Y-o-Y Growth Comparison by Nature, 2025-2035
  • Figure 152: Middle East and Africa Market Attractiveness Analysis by Nature
  • Figure 153: Middle East and Africa Market Value Share and BPS Analysis by Form, 2025 and 2035
  • Figure 154: Middle East and Africa Market Y-o-Y Growth Comparison by Form, 2025-2035
  • Figure 155: Middle East and Africa Market Attractiveness Analysis by Form
  • Figure 156: Middle East and Africa Market Value Share and BPS Analysis by Processing Type, 2025 and 2035
  • Figure 157: Middle East and Africa Market Y-o-Y Growth Comparison by Processing Type, 2025-2035
  • Figure 158: Middle East and Africa Market Attractiveness Analysis by Processing Type
  • Figure 159: Middle East and Africa Market Value Share and BPS Analysis by Packaging Format, 2025 and 2035
  • Figure 160: Middle East and Africa Market Y-o-Y Growth Comparison by Packaging Format, 2025-2035
  • Figure 161: Middle East and Africa Market Attractiveness Analysis by Packaging Format
  • Figure 162: Middle East and Africa Market Value Share and BPS Analysis by Sales Channel, 2025 and 2035
  • Figure 163: Middle East and Africa Market Y-o-Y Growth Comparison by Sales Channel, 2025-2035
  • Figure 164: Middle East and Africa Market Attractiveness Analysis by Sales Channel
  • Figure 165: Global Market - Tier Structure Analysis
  • Figure 166: Global Market - Company Share Analysis

Frequently Asked Questions

What is the projected size of the stock cubes market in 2025?

The market is valued at USD 7.7 billion in 2025.

What is the outlook on stock cube demand by 2035?

The market is projected to reach USD 12.3 billion by 2035, expanding at a CAGR of 4.8%.

Which product type leads the stock cubes market in 2025?

Chicken stock cubes are expected to lead with a 38.5% market share in 2025.

Which form segment dominates the stock cubes market in 2025?

Solid stock cubes are anticipated to dominate with a 55% share in 2025.

Which country is projected to witness the fastest growth in the stock cubes market?

Japan is projected to be the fastest-growing market with a CAGR of 7.4% from 2025 to 2035.

Explore Similar Insights

Future Market Insights

Stock Cubes Market