Rolling Stock Management Market Size and Share Forecast Outlook From 2024 to 2034

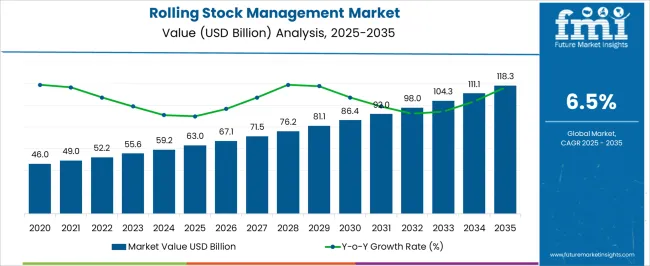
The rolling stock management market is expected to be valued at USD 59.2 billion in 2024. The rolling stock management is predicted to rise at a moderate CAGR of 6.5% from 2024 to 2034. The global market is anticipated to reach USD 111 billion by 2034.

Attributes Key Insights
Estimated Market Size in 2024 USD 59.2 billion
Projected Market Value in 2034 USD 111 billion
Value-based CAGR from 2024 to 2034 6.5%

Top Rolling Stock Management Market Dynamics and Industry Trends

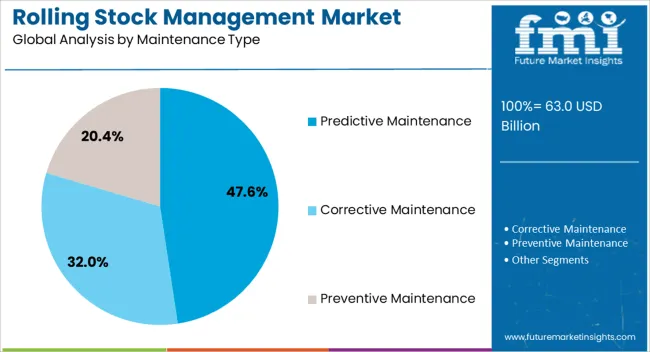
  • Increasing adoption of predictive maintenance technologies to enhance operational efficiency and reduce downtime in rolling stock management.
  • Integration of IoT sensors and data analytics for real-time monitoring of train components, enabling proactive maintenance strategies.
  • Emphasis on fleet modernization and upgrade programs to improve passenger experience, safety, and energy efficiency.
  • Growing focus on asset management solutions to optimize resource allocation, minimize lifecycle costs, and extend equipment lifespan.

Comparison of Historical vs Future Outlook for the Rolling Stock Management Market (2019 to 2023 vs 2024 to 2034)

Between 2019 and 2023, the historical CAGR for the market exhibited robust growth at 8.2%. This period saw significant advancements in technology, increasing demand for efficient solutions, and expanding global trade activities, driving the growth of the market.

Factors such as rising investments in infrastructure projects, stringent regulations requiring regular maintenance, and the need for modernization initiatives contributed to the accelerated growth rate during this timeframe.

Looking ahead to the forecasted period from 2024 to 2034, the market is projected to experience a slightly lower but still considerable CAGR of 6.5%. This moderated growth rate reflects factors such as market saturation in some regions, economic fluctuations, and evolving consumer preferences.

Despite the slight decrease in growth rate, the market is anticipated to continue expanding steadily, driven by ongoing infrastructure developments, technological advancements, and an increasing focus on sustainability and efficiency in rolling stock management practices.

Historical CAGR from 2019 to 2023 8.2%
Forecast CAGR from 2024 to 2034 6.5%

Key Drivers of Growth in the Rolling Stock Management Market

  • Increasing investments in railway infrastructure projects worldwide stimulate demand for advanced rolling stock management solutions to optimize fleet operations and enhance passenger experience.
  • Stringent regulations mandating safety standards and environmental sustainability measures compel railway operators to invest in modern rolling stock management practices and technologies.
  • Rising urban populations and congestion drive demand for efficient and reliable public transportation systems, prompting railway operators to adopt advanced rolling stock management solutions to meet passenger demands.
  • Emphasis on passenger safety and comfort motivates railway operators to invest in modernizing rolling stock fleets and implementing predictive maintenance systems to minimize disruptions and improve service reliability.

Challenges in the Rolling Stock Management Market

  • Implementing advanced rolling stock management systems requires substantial upfront investment in technology, infrastructure and workforce training, posing financial challenges for railway operators.
  • Retrofitting existing rolling stock fleets with modern management systems and integrating them with legacy infrastructure can be complex and costly, presenting technical challenges for railway operators.
  • The proliferation of IoT sensors and data analytics in rolling stock management raises concerns about data privacy and security, requiring robust cybersecurity measures to safeguard sensitive information.
  • Adhering to diverse and evolving regulatory requirements across different regions poses compliance challenges for railway operators, necessitating continuous monitoring and adaptation of management practices.

Analysis of Top Countries Producing, Formulating, Packaging, Distributing, and Using Rolling Stock Management Solutions

The table ranks the top five countries by revenue, with Japan holding the top position. One major reason Japan leads the rolling stock management market is its longstanding commitment to technological innovation and excellence in railway systems.

The renowned reputation for high-speed trains, punctuality, and safety standards stems from continuous advancements in rolling stock management practices.

The railway operators prioritize efficiency, reliability, and passenger comfort, driving the adoption of cutting-edge management solutions. The extensive railway network, which includes bullet trains and urban transit systems, serves as a testing ground for innovative rolling stock management technologies, cementing its position as a global leader in the industry.

Countries Forecast CAGRs from 2024 to 2034
The United States 6.8%
South Korea 7.9%
Japan 8%
China 6.9%
The United Kingdom 7.6%

Efficient Management in Extensive Railway Network Inhibits Growth in the United States

The market is extensively utilized in the United States due to the vast railway network, which spans various regions and serves freight and passenger transportation needs.

With a significant portion of the population relying on trains for commuting and freight transportation being a crucial component of the economy, efficient rolling stock management is essential. This includes ensuring timely maintenance, optimizing operations, and enhancing safety standards to meet the demands of a highly developed railway system.
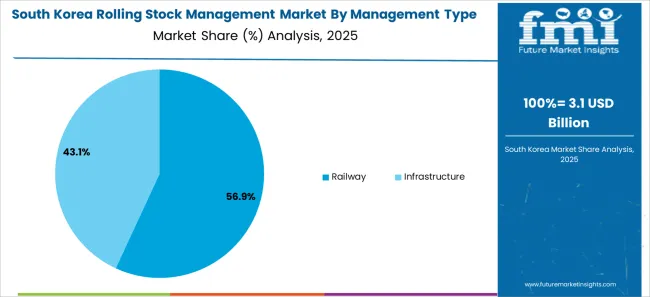
Technological Innovation Driving Advanced Solutions in South Korea

The emphasis on technological innovation and efficiency drives the utilization of the market. The country boasts advanced railway infrastructure, including high-speed trains and urban transit systems, necessitating sophisticated management solutions.

The focus on enhancing passenger experience, safety, and operational efficiency by adopting cutting-edge technology fuels the demand for comprehensive rolling stock management systems to ensure smooth and reliable railway operations.
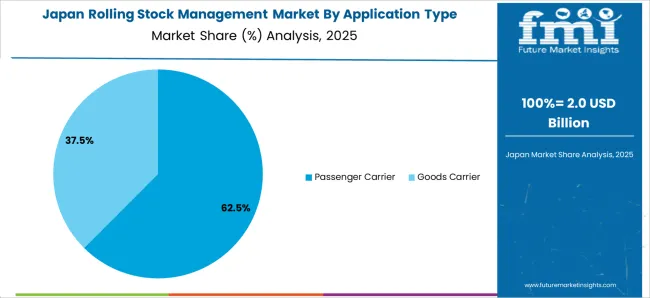
Maintaining a Reputation for Punctuality and Safety in Japan

In Japan, renowned for its world-class railway systems, the market is crucial for maintaining its punctuality, reliability, and safety reputation. With densely populated urban areas and extensive high-speed rail networks, effective rolling stock management is essential to meet the high passenger transportation and freight logistics demand.

The commitment to continuous improvement and innovation in railway operations drives the adoption of advanced management solutions to optimize fleet performance and ensure seamless service delivery.

Meeting Demands of Rapid Urbanization and Economic Growth in China

The rapid urbanization and economic development have led to significant investments in railway infrastructure, making the market integral to the transportation sector.

With the largest high-speed rail network and extensive freight transportation networks, efficient rolling stock management is vital for meeting growing passenger and freight demands.

The focus on enhancing connectivity, mobility, and sustainability through modern railway systems drives the adoption of advanced management technologies to optimize operations and ensure safe and reliable transportation services.

Enhancing Service Quality and Reliability in the United Kingdom

In the United Kingdom, the market is crucial in supporting diverse railway operations, including commuter services, long-distance travel, and freight transportation. With a well-established railway network and a strong emphasis on safety, reliability, and customer satisfaction, effective rolling stock management is essential.

The commitment to modernizing railway infrastructure and improving service quality drives the adoption of advanced management solutions to optimize fleet performance, minimize disruptions, and enhance passenger experience.

Rolling Stock Management Industry Analysis by Top Investment Segments

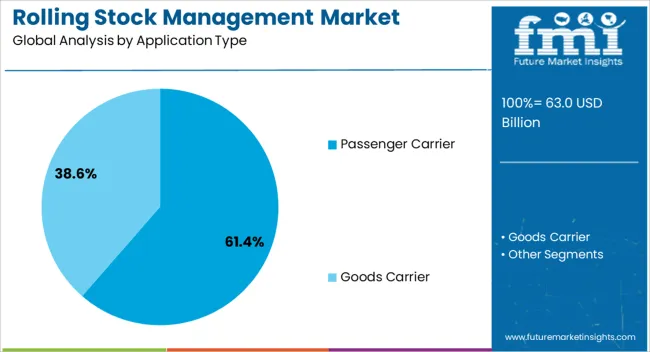
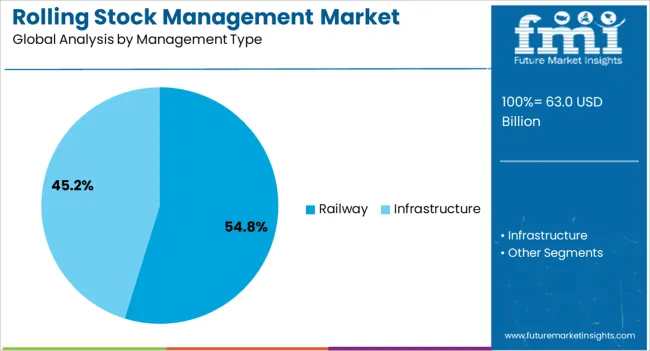
The below section shows the leading segment. Based on application type, the goods carrier is estimated to register at 6.3% CAGR by 2034. Based on management type, the railway segment is anticipated to expand at 6.1% CAGR by 2034.

Goods carriers are crucial in facilitating this trade by transporting raw materials, finished products, and commodities between manufacturers, suppliers, and consumers. Railways offer a viable alternative to road transportation, providing a cost-effective and environmentally friendly commuting and freight transport mode.

Category CAGR from 2024 to 2034
Goods Carrier 6.3%
Railway 6.1%

Goods Carrier Segment to Hold a Significant Share in the Market

The goods carrier segment is projected to achieve a CAGR of 6.3% by 2034. This growth trajectory reflects the increasing demand for efficient freight transportation solutions globally. As economies expand and international trade flourishes, transporting goods across various distances becomes paramount.

The goods carrier application encompasses a wide range of freight transportation activities, including moving raw materials, finished products, and commodities. Factors such as infrastructure development, trade liberalization, and e-commerce growth contribute to the steady expansion of the goods carrier segment, driving its projected CAGR.

Railway Segment to Hold a Dominant Share in the Market

The railway management segment is expected to experience a CAGR of 6.1% by 2034, reflecting sustained investments in railway infrastructure and operations management. Effective management of railway systems is essential for ensuring safe, reliable, and efficient transportation services.

The railway management segment encompasses various activities such as scheduling, maintenance, asset management, and passenger services. Factors driving the growth of this segment include technological advancements in railway management systems, increasing urbanization leading to higher demand for public transportation, and government initiatives aimed at modernizing railway infrastructure.

The anticipated CAGR underscores the importance of efficient railway management in meeting the evolving needs of passengers and freight operators while ensuring the sustainability and competitiveness of railway transportation.
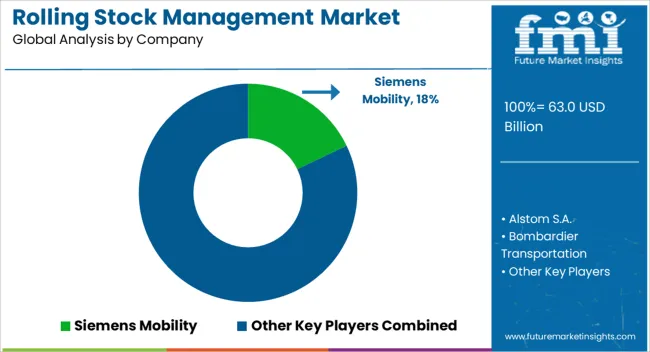
Competitive Landscape of the Rolling Stock Management Market

The presence of established players such as Siemens AG, Alstom SA, Bombardier Inc., and General Electric Company characterizes the competitive landscape of the rolling stock management market. These companies offer various rolling stock management solutions, including predictive maintenance systems, asset management software, and remote monitoring services.

Competition in the market is driven by factors such as technological innovation, service quality, geographic reach, and pricing strategies. Collaborations, partnerships, and mergers are common strategies market players employ to enhance their capabilities, expand their market presence, and address evolving customer needs in the global railway industry. Some of the key developments are:

  • In March 2022, Saudi Arabia Railways (SAR) unveiled the Al-Qurayyat passenger train station as part of its initiative to introduce northbound passenger trains. This development aligns with SAR's efforts to enhance railway infrastructure and expand regional transportation services.
  • In March 2023, the Indian Central Railways (CR) Authority disclosed plans to build six new suburban railway stations to accommodate Mumbai's local trains. With CR Mumbai already operating 80 stations, adding these six stations will raise the total count to 86, aiming to improve commuter accessibility and alleviate congestion on Mumbai's extensive suburban rail network.

Key Coverage of Circuit Monitoring Market Report

  • Adjacent Study on Rolling Stock Management Market
  • Rolling Stock Management Market Size, Current Insights and Demographic Trends
  • Rolling Stock Management Market Revenue & Trends
  • Reasons for Expanding Rolling Stock Management Market
  • Government’s Role Behind the Flourishing Rolling Stock Management Market in Japan

Scope and Coverage of the Rolling Stock Management Market Report

Attributes Details
Estimated Market Size in 2024 USD 59.2 billion
Projected Market Valuation in 2034 USD 111 billion
Value-based CAGR 2024 to 2034 6.5%
Forecast Period 2024 to 2034
Historical Data Available for 2019 to 2023
Market Analysis Value in USD billion
Key Regions Covered North America; Latin America; Western Europe; Eastern Europe; South Asia and Pacific; East Asia; Middle East and Africa
Key Market Segments Covered Application Type, Management Type, Maintenance, Region
Key Countries Profiled The United States, Canada, Brazil, Mexico, Rest of Latin America, Germany, The United Kingdom, France, Spain, Italy, Russia, Poland, Czech Republic, Romania, India, Bangladesh, Australia, New Zealand, China, Japan, South Korea, GCC countries, South Africa, Israel
Key Companies Profiled Alstom S.A.; Siemens Mobility; Bombardier Transportation; General Electric; ABB; Hitachi; Mitsubishi Heavy Industries; Talgo; Thales Group; Tech Mahindra

Top Segments Studied in the Rolling Stock Management Market

By Application Type:

  • Goods Carrier
  • Passenger Carrier

By Management Type:

  • Railway
  • Infrastructure

By Maintenance:

  • Predictive Maintenance
  • Corrective Maintenance
  • Preventive Maintenance

By Region:

  • North America
  • Latin America
  • Western Europe
  • Eastern Europe
  • South Asia and Pacific
  • East Asia
  • Middle East and Africa

Table of Content

  • 1. Executive Summary
  • 2. Market Overview
  • 3. Market Background
  • 4. Global Market Analysis 2019 to 2023 and Forecast, 2024 to 2034
  • 5. Global Market Analysis 2019 to 2023 and Forecast 2024 to 2034, By Application Type
    • 5.1. Goods Carrier
    • 5.2. Passenger Carrier
  • 6. Global Market Analysis 2019 to 2023 and Forecast 2024 to 2034, By Management Type
    • 6.1. Railway
    • 6.2. Infrastructure
  • 7. Global Market Analysis 2019 to 2023 and Forecast 2024 to 2034, By Maintenance
    • 7.1. Predictive Maintenance
    • 7.2. Corrective Maintenance
    • 7.3. Preventive Maintenance
  • 8. Global Market Analysis 2019 to 2023 and Forecast 2024 to 2034, By Region
    • 8.1. North America
    • 8.2. Latin America
    • 8.3. Western Europe
    • 8.4. Eastern Europe
    • 8.5. South Asia and Pacific
    • 8.6. East Asia
    • 8.7. Middle East and Africa
  • 9. North America Market Analysis 2019 to 2023 and Forecast 2024 to 2034, By Country
  • 10. Latin America Market Analysis 2019 to 2023 and Forecast 2024 to 2034, By Country
  • 11. Western Europe Market Analysis 2019 to 2023 and Forecast 2024 to 2034, By Country
  • 12. Eastern Europe Market Analysis 2019 to 2023 and Forecast 2024 to 2034, By Country
  • 13. South Asia and Pacific Market Analysis 2019 to 2023 and Forecast 2024 to 2034, By Country
  • 14. East Asia Market Analysis 2019 to 2023 and Forecast 2024 to 2034, By Country
  • 15. Middle East and Africa Market Analysis 2019 to 2023 and Forecast 2024 to 2034, By Country
  • 16. Key Countries Market Analysis
  • 17. Market Structure Analysis
  • 18. Competition Analysis
    • 18.1. Alstom S.A.
    • 18.2. Siemens Mobility
    • 18.3. Bombardier Transportation
    • 18.4. General Electric
    • 18.5. ABB
    • 18.6. Hitachi
    • 18.7. Mitsubishi Heavy Industries
    • 18.8. Talgo
    • 18.9. Thales Group
    • 18.10. Tech Mahindra
  • 19. Assumptions & Acronyms Used
  • 20. Research Methodology

List of Tables

Table 1: Global Market Value (US$ Million) Forecast by Region, 2019 to 2034

Table 2: Global Market Value (US$ Million) Forecast by Application Type, 2019 to 2034

Table 3: Global Market Value (US$ Million) Forecast by Management Type, 2019 to 2034

Table 4: Global Market Value (US$ Million) Forecast by Maintenance, 2019 to 2034

Table 5: North America Market Value (US$ Million) Forecast by Country, 2019 to 2034

Table 6: North America Market Value (US$ Million) Forecast by Application Type, 2019 to 2034

Table 7: North America Market Value (US$ Million) Forecast by Management Type, 2019 to 2034

Table 8: North America Market Value (US$ Million) Forecast by Maintenance, 2019 to 2034

Table 9: Latin America Market Value (US$ Million) Forecast by Country, 2019 to 2034

Table 10: Latin America Market Value (US$ Million) Forecast by Application Type, 2019 to 2034

Table 11: Latin America Market Value (US$ Million) Forecast by Management Type, 2019 to 2034

Table 12: Latin America Market Value (US$ Million) Forecast by Maintenance, 2019 to 2034

Table 13: Western Europe Market Value (US$ Million) Forecast by Country, 2019 to 2034

Table 14: Western Europe Market Value (US$ Million) Forecast by Application Type, 2019 to 2034

Table 15: Western Europe Market Value (US$ Million) Forecast by Management Type, 2019 to 2034

Table 16: Western Europe Market Value (US$ Million) Forecast by Maintenance, 2019 to 2034

Table 17: Eastern Europe Market Value (US$ Million) Forecast by Country, 2019 to 2034

Table 18: Eastern Europe Market Value (US$ Million) Forecast by Application Type, 2019 to 2034

Table 19: Eastern Europe Market Value (US$ Million) Forecast by Management Type, 2019 to 2034

Table 20: Eastern Europe Market Value (US$ Million) Forecast by Maintenance, 2019 to 2034

Table 21: South Asia and Pacific Market Value (US$ Million) Forecast by Country, 2019 to 2034

Table 22: South Asia and Pacific Market Value (US$ Million) Forecast by Application Type, 2019 to 2034

Table 23: South Asia and Pacific Market Value (US$ Million) Forecast by Management Type, 2019 to 2034

Table 24: South Asia and Pacific Market Value (US$ Million) Forecast by Maintenance, 2019 to 2034

Table 25: East Asia Market Value (US$ Million) Forecast by Country, 2019 to 2034

Table 26: East Asia Market Value (US$ Million) Forecast by Application Type, 2019 to 2034

Table 27: East Asia Market Value (US$ Million) Forecast by Management Type, 2019 to 2034

Table 28: East Asia Market Value (US$ Million) Forecast by Maintenance, 2019 to 2034

Table 29: Middle East and Africa Market Value (US$ Million) Forecast by Country, 2019 to 2034

Table 30: Middle East and Africa Market Value (US$ Million) Forecast by Application Type, 2019 to 2034

Table 31: Middle East and Africa Market Value (US$ Million) Forecast by Management Type, 2019 to 2034

Table 32: Middle East and Africa Market Value (US$ Million) Forecast by Maintenance, 2019 to 2034

List of Figures

Figure 1: Global Market Value (US$ Million) by Application Type, 2024 to 2034

Figure 2: Global Market Value (US$ Million) by Management Type, 2024 to 2034

Figure 3: Global Market Value (US$ Million) by Maintenance, 2024 to 2034

Figure 4: Global Market Value (US$ Million) by Region, 2024 to 2034

Figure 5: Global Market Value (US$ Million) Analysis by Region, 2019 to 2034

Figure 6: Global Market Value Share (%) and BPS Analysis by Region, 2024 to 2034

Figure 7: Global Market Y-o-Y Growth (%) Projections by Region, 2024 to 2034

Figure 8: Global Market Value (US$ Million) Analysis by Application Type, 2019 to 2034

Figure 9: Global Market Value Share (%) and BPS Analysis by Application Type, 2024 to 2034

Figure 10: Global Market Y-o-Y Growth (%) Projections by Application Type, 2024 to 2034

Figure 11: Global Market Value (US$ Million) Analysis by Management Type, 2019 to 2034

Figure 12: Global Market Value Share (%) and BPS Analysis by Management Type, 2024 to 2034

Figure 13: Global Market Y-o-Y Growth (%) Projections by Management Type, 2024 to 2034

Figure 14: Global Market Value (US$ Million) Analysis by Maintenance, 2019 to 2034

Figure 15: Global Market Value Share (%) and BPS Analysis by Maintenance, 2024 to 2034

Figure 16: Global Market Y-o-Y Growth (%) Projections by Maintenance, 2024 to 2034

Figure 17: Global Market Attractiveness by Application Type, 2024 to 2034

Figure 18: Global Market Attractiveness by Management Type, 2024 to 2034

Figure 19: Global Market Attractiveness by Maintenance, 2024 to 2034

Figure 20: Global Market Attractiveness by Region, 2024 to 2034

Figure 21: North America Market Value (US$ Million) by Application Type, 2024 to 2034

Figure 22: North America Market Value (US$ Million) by Management Type, 2024 to 2034

Figure 23: North America Market Value (US$ Million) by Maintenance, 2024 to 2034

Figure 24: North America Market Value (US$ Million) by Country, 2024 to 2034

Figure 25: North America Market Value (US$ Million) Analysis by Country, 2019 to 2034

Figure 26: North America Market Value Share (%) and BPS Analysis by Country, 2024 to 2034

Figure 27: North America Market Y-o-Y Growth (%) Projections by Country, 2024 to 2034

Figure 28: North America Market Value (US$ Million) Analysis by Application Type, 2019 to 2034

Figure 29: North America Market Value Share (%) and BPS Analysis by Application Type, 2024 to 2034

Figure 30: North America Market Y-o-Y Growth (%) Projections by Application Type, 2024 to 2034

Figure 31: North America Market Value (US$ Million) Analysis by Management Type, 2019 to 2034

Figure 32: North America Market Value Share (%) and BPS Analysis by Management Type, 2024 to 2034

Figure 33: North America Market Y-o-Y Growth (%) Projections by Management Type, 2024 to 2034

Figure 34: North America Market Value (US$ Million) Analysis by Maintenance, 2019 to 2034

Figure 35: North America Market Value Share (%) and BPS Analysis by Maintenance, 2024 to 2034

Figure 36: North America Market Y-o-Y Growth (%) Projections by Maintenance, 2024 to 2034

Figure 37: North America Market Attractiveness by Application Type, 2024 to 2034

Figure 38: North America Market Attractiveness by Management Type, 2024 to 2034

Figure 39: North America Market Attractiveness by Maintenance, 2024 to 2034

Figure 40: North America Market Attractiveness by Country, 2024 to 2034

Figure 41: Latin America Market Value (US$ Million) by Application Type, 2024 to 2034

Figure 42: Latin America Market Value (US$ Million) by Management Type, 2024 to 2034

Figure 43: Latin America Market Value (US$ Million) by Maintenance, 2024 to 2034

Figure 44: Latin America Market Value (US$ Million) by Country, 2024 to 2034

Figure 45: Latin America Market Value (US$ Million) Analysis by Country, 2019 to 2034

Figure 46: Latin America Market Value Share (%) and BPS Analysis by Country, 2024 to 2034

Figure 47: Latin America Market Y-o-Y Growth (%) Projections by Country, 2024 to 2034

Figure 48: Latin America Market Value (US$ Million) Analysis by Application Type, 2019 to 2034

Figure 49: Latin America Market Value Share (%) and BPS Analysis by Application Type, 2024 to 2034

Figure 50: Latin America Market Y-o-Y Growth (%) Projections by Application Type, 2024 to 2034

Figure 51: Latin America Market Value (US$ Million) Analysis by Management Type, 2019 to 2034

Figure 52: Latin America Market Value Share (%) and BPS Analysis by Management Type, 2024 to 2034

Figure 53: Latin America Market Y-o-Y Growth (%) Projections by Management Type, 2024 to 2034

Figure 54: Latin America Market Value (US$ Million) Analysis by Maintenance, 2019 to 2034

Figure 55: Latin America Market Value Share (%) and BPS Analysis by Maintenance, 2024 to 2034

Figure 56: Latin America Market Y-o-Y Growth (%) Projections by Maintenance, 2024 to 2034

Figure 57: Latin America Market Attractiveness by Application Type, 2024 to 2034

Figure 58: Latin America Market Attractiveness by Management Type, 2024 to 2034

Figure 59: Latin America Market Attractiveness by Maintenance, 2024 to 2034

Figure 60: Latin America Market Attractiveness by Country, 2024 to 2034

Figure 61: Western Europe Market Value (US$ Million) by Application Type, 2024 to 2034

Figure 62: Western Europe Market Value (US$ Million) by Management Type, 2024 to 2034

Figure 63: Western Europe Market Value (US$ Million) by Maintenance, 2024 to 2034

Figure 64: Western Europe Market Value (US$ Million) by Country, 2024 to 2034

Figure 65: Western Europe Market Value (US$ Million) Analysis by Country, 2019 to 2034

Figure 66: Western Europe Market Value Share (%) and BPS Analysis by Country, 2024 to 2034

Figure 67: Western Europe Market Y-o-Y Growth (%) Projections by Country, 2024 to 2034

Figure 68: Western Europe Market Value (US$ Million) Analysis by Application Type, 2019 to 2034

Figure 69: Western Europe Market Value Share (%) and BPS Analysis by Application Type, 2024 to 2034

Figure 70: Western Europe Market Y-o-Y Growth (%) Projections by Application Type, 2024 to 2034

Figure 71: Western Europe Market Value (US$ Million) Analysis by Management Type, 2019 to 2034

Figure 72: Western Europe Market Value Share (%) and BPS Analysis by Management Type, 2024 to 2034

Figure 73: Western Europe Market Y-o-Y Growth (%) Projections by Management Type, 2024 to 2034

Figure 74: Western Europe Market Value (US$ Million) Analysis by Maintenance, 2019 to 2034

Figure 75: Western Europe Market Value Share (%) and BPS Analysis by Maintenance, 2024 to 2034

Figure 76: Western Europe Market Y-o-Y Growth (%) Projections by Maintenance, 2024 to 2034

Figure 77: Western Europe Market Attractiveness by Application Type, 2024 to 2034

Figure 78: Western Europe Market Attractiveness by Management Type, 2024 to 2034

Figure 79: Western Europe Market Attractiveness by Maintenance, 2024 to 2034

Figure 80: Western Europe Market Attractiveness by Country, 2024 to 2034

Figure 81: Eastern Europe Market Value (US$ Million) by Application Type, 2024 to 2034

Figure 82: Eastern Europe Market Value (US$ Million) by Management Type, 2024 to 2034

Figure 83: Eastern Europe Market Value (US$ Million) by Maintenance, 2024 to 2034

Figure 84: Eastern Europe Market Value (US$ Million) by Country, 2024 to 2034

Figure 85: Eastern Europe Market Value (US$ Million) Analysis by Country, 2019 to 2034

Figure 86: Eastern Europe Market Value Share (%) and BPS Analysis by Country, 2024 to 2034

Figure 87: Eastern Europe Market Y-o-Y Growth (%) Projections by Country, 2024 to 2034

Figure 88: Eastern Europe Market Value (US$ Million) Analysis by Application Type, 2019 to 2034

Figure 89: Eastern Europe Market Value Share (%) and BPS Analysis by Application Type, 2024 to 2034

Figure 90: Eastern Europe Market Y-o-Y Growth (%) Projections by Application Type, 2024 to 2034

Figure 91: Eastern Europe Market Value (US$ Million) Analysis by Management Type, 2019 to 2034

Figure 92: Eastern Europe Market Value Share (%) and BPS Analysis by Management Type, 2024 to 2034

Figure 93: Eastern Europe Market Y-o-Y Growth (%) Projections by Management Type, 2024 to 2034

Figure 94: Eastern Europe Market Value (US$ Million) Analysis by Maintenance, 2019 to 2034

Figure 95: Eastern Europe Market Value Share (%) and BPS Analysis by Maintenance, 2024 to 2034

Figure 96: Eastern Europe Market Y-o-Y Growth (%) Projections by Maintenance, 2024 to 2034

Figure 97: Eastern Europe Market Attractiveness by Application Type, 2024 to 2034

Figure 98: Eastern Europe Market Attractiveness by Management Type, 2024 to 2034

Figure 99: Eastern Europe Market Attractiveness by Maintenance, 2024 to 2034

Figure 100: Eastern Europe Market Attractiveness by Country, 2024 to 2034

Figure 101: South Asia and Pacific Market Value (US$ Million) by Application Type, 2024 to 2034

Figure 102: South Asia and Pacific Market Value (US$ Million) by Management Type, 2024 to 2034

Figure 103: South Asia and Pacific Market Value (US$ Million) by Maintenance, 2024 to 2034

Figure 104: South Asia and Pacific Market Value (US$ Million) by Country, 2024 to 2034

Figure 105: South Asia and Pacific Market Value (US$ Million) Analysis by Country, 2019 to 2034

Figure 106: South Asia and Pacific Market Value Share (%) and BPS Analysis by Country, 2024 to 2034

Figure 107: South Asia and Pacific Market Y-o-Y Growth (%) Projections by Country, 2024 to 2034

Figure 108: South Asia and Pacific Market Value (US$ Million) Analysis by Application Type, 2019 to 2034

Figure 109: South Asia and Pacific Market Value Share (%) and BPS Analysis by Application Type, 2024 to 2034

Figure 110: South Asia and Pacific Market Y-o-Y Growth (%) Projections by Application Type, 2024 to 2034

Figure 111: South Asia and Pacific Market Value (US$ Million) Analysis by Management Type, 2019 to 2034

Figure 112: South Asia and Pacific Market Value Share (%) and BPS Analysis by Management Type, 2024 to 2034

Figure 113: South Asia and Pacific Market Y-o-Y Growth (%) Projections by Management Type, 2024 to 2034

Figure 114: South Asia and Pacific Market Value (US$ Million) Analysis by Maintenance, 2019 to 2034

Figure 115: South Asia and Pacific Market Value Share (%) and BPS Analysis by Maintenance, 2024 to 2034

Figure 116: South Asia and Pacific Market Y-o-Y Growth (%) Projections by Maintenance, 2024 to 2034

Figure 117: South Asia and Pacific Market Attractiveness by Application Type, 2024 to 2034

Figure 118: South Asia and Pacific Market Attractiveness by Management Type, 2024 to 2034

Figure 119: South Asia and Pacific Market Attractiveness by Maintenance, 2024 to 2034

Figure 120: South Asia and Pacific Market Attractiveness by Country, 2024 to 2034

Figure 121: East Asia Market Value (US$ Million) by Application Type, 2024 to 2034

Figure 122: East Asia Market Value (US$ Million) by Management Type, 2024 to 2034

Figure 123: East Asia Market Value (US$ Million) by Maintenance, 2024 to 2034

Figure 124: East Asia Market Value (US$ Million) by Country, 2024 to 2034

Figure 125: East Asia Market Value (US$ Million) Analysis by Country, 2019 to 2034

Figure 126: East Asia Market Value Share (%) and BPS Analysis by Country, 2024 to 2034

Figure 127: East Asia Market Y-o-Y Growth (%) Projections by Country, 2024 to 2034

Figure 128: East Asia Market Value (US$ Million) Analysis by Application Type, 2019 to 2034

Figure 129: East Asia Market Value Share (%) and BPS Analysis by Application Type, 2024 to 2034

Figure 130: East Asia Market Y-o-Y Growth (%) Projections by Application Type, 2024 to 2034

Figure 131: East Asia Market Value (US$ Million) Analysis by Management Type, 2019 to 2034

Figure 132: East Asia Market Value Share (%) and BPS Analysis by Management Type, 2024 to 2034

Figure 133: East Asia Market Y-o-Y Growth (%) Projections by Management Type, 2024 to 2034

Figure 134: East Asia Market Value (US$ Million) Analysis by Maintenance, 2019 to 2034

Figure 135: East Asia Market Value Share (%) and BPS Analysis by Maintenance, 2024 to 2034

Figure 136: East Asia Market Y-o-Y Growth (%) Projections by Maintenance, 2024 to 2034

Figure 137: East Asia Market Attractiveness by Application Type, 2024 to 2034

Figure 138: East Asia Market Attractiveness by Management Type, 2024 to 2034

Figure 139: East Asia Market Attractiveness by Maintenance, 2024 to 2034

Figure 140: East Asia Market Attractiveness by Country, 2024 to 2034

Figure 141: Middle East and Africa Market Value (US$ Million) by Application Type, 2024 to 2034

Figure 142: Middle East and Africa Market Value (US$ Million) by Management Type, 2024 to 2034

Figure 143: Middle East and Africa Market Value (US$ Million) by Maintenance, 2024 to 2034

Figure 144: Middle East and Africa Market Value (US$ Million) by Country, 2024 to 2034

Figure 145: Middle East and Africa Market Value (US$ Million) Analysis by Country, 2019 to 2034

Figure 146: Middle East and Africa Market Value Share (%) and BPS Analysis by Country, 2024 to 2034

Figure 147: Middle East and Africa Market Y-o-Y Growth (%) Projections by Country, 2024 to 2034

Figure 148: Middle East and Africa Market Value (US$ Million) Analysis by Application Type, 2019 to 2034

Figure 149: Middle East and Africa Market Value Share (%) and BPS Analysis by Application Type, 2024 to 2034

Figure 150: Middle East and Africa Market Y-o-Y Growth (%) Projections by Application Type, 2024 to 2034

Figure 151: Middle East and Africa Market Value (US$ Million) Analysis by Management Type, 2019 to 2034

Figure 152: Middle East and Africa Market Value Share (%) and BPS Analysis by Management Type, 2024 to 2034

Figure 153: Middle East and Africa Market Y-o-Y Growth (%) Projections by Management Type, 2024 to 2034

Figure 154: Middle East and Africa Market Value (US$ Million) Analysis by Maintenance, 2019 to 2034

Figure 155: Middle East and Africa Market Value Share (%) and BPS Analysis by Maintenance, 2024 to 2034

Figure 156: Middle East and Africa Market Y-o-Y Growth (%) Projections by Maintenance, 2024 to 2034

Figure 157: Middle East and Africa Market Attractiveness by Application Type, 2024 to 2034

Figure 158: Middle East and Africa Market Attractiveness by Management Type, 2024 to 2034

Figure 159: Middle East and Africa Market Attractiveness by Maintenance, 2024 to 2034

Figure 160: Middle East and Africa Market Attractiveness by Country, 2024 to 2034

Frequently Asked Questions

What is the expected worth of the rolling stock management market in 2024?

As of 2024, the market for rolling stock management is expected to be valued at USD 59.2 billion.

What is the anticipated market value for the rolling stock management in 2034?

By 2034, the market value of the rolling stock management is expected to reach USD 111 billion.

What is the projected forecast CAGR for the rolling stock management market from 2024 to 2034?

From 2024 to 2034, the rolling stock management market is expected to flourish at a CAGR of 6.5%.

Based on application type, which segment dominates the rolling stock management market?

The goods carrier segment is expected to expand at 6.3% CAGR by 2034.

Which country is likely to dominate the rolling stock management market?

Japan is likely the top-performing market, with a CAGR of 8%.

Explore Automotive Smart & Connected Technologies Insights

Future Market Insights

Rolling Stock Management Market