Reports

- Global Locations -

Headquarters

Future Market Insights, Inc.

Christiana Corporate, 200
Continental Drive, Suite 401,
Newark, Delaware - 19713,
United States

T: +1-845-579-5705

Americas

Future Market Insights, Inc.

616 Corporate Way, Suite 2-9018,
Valley Cottage, NY 10989, United States

T: +1-347-918-3531

MEA

Future Market Insights

1602-6 Jumeirah Bay X2 Tower, Plot No: JLT-PH2-X2A,
Jumeirah Lakes Towers, Dubai,
United Arab Emirates

Europe

Future Market Insights

3rd Floor, 207 Regent Street,
W1B 3HH London
United Kingdom

T: + 44 (0) 20 8123 9659
D: +44 (0) 20 3287 4268

Asia Pacific

Future Market Insights

IndiaLand Global Tech Park, Unit UG-1, Behind Grand HighStreet, Phase 1, Hinjawadi, MH, Pune – 411057, India

Stock Trading App Market Outlook (2023 to 2033)

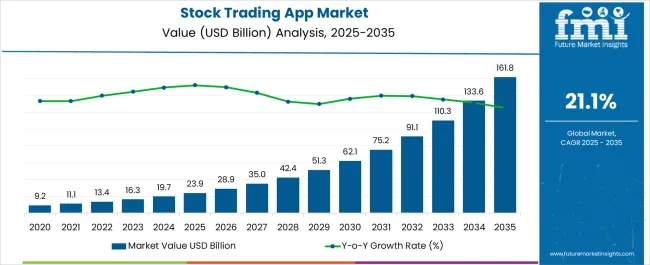
The stock trading app market is estimated to be worth US$ 16266.1 million in 2023, with a projected value of US$ 1,10,624.4 million by 2033. Therefore, the market size is estimated to be 21.1% through 2033.

Demand for stock trading apps from financial institutions to help them manage their day-to-day operations is growing. Further, the stock trading app market includes audit, risk, integration, compliance, and consulting features, which boost the market's key trends and opportunities.

Many new changes are being implemented in the market at a significant pace. Customer satisfaction is a critical driver of stock trading app adoption trends. Also, the stock trading app is a fantastic platform that can be used for a variety of purposes. Market firms have a high level of risk and workload.

Automation is required to perform operations efficiently to skyrocket the demand for stock trading apps along with the sales of stock trading apps. Also, the financial complexity is going to draw much attention to the market.

Financial institutions can achieve new developments and profitability with this stock trading app development shift. In the market, online solutions are becoming prevalent. The stock trading app promotes traction details, alerts, online payments, and transfers.

Stock trading app services improve monitoring and decision-making capabilities. In addition, the stock trading app market business analytics can be effectively managed by the app platform. According to the forecast, all these factors are expected to increase the value of market share in the future period.

Attributes Details
Stock Trading App Market CAGR (2023 to 2033) 21.1%
Stock Trading App Market Size (2023) US$ 16266.1 million
Stock Trading App Market Size (2033) US$ 1,10,624.4 million

Don't pay for what you don't need

Customize your report by selecting specific countries or regions and save 30%!

What is Propelling the Stock Trading App Market?

Demand for stock trading apps is driven by cloud-integrated stock trading apps. Cloud-based financial solutions offer numerous advantages. Additionally, stock trading apps provide performance, analytics, and analyses of the stock trading app market's financial status.

Numerous tasks can be accomplished with stock trading apps solution risk management. Monitoring and intelligence features are available on the platform. These elements might boost stock trading app market profit.

In enterprises, there is driving demand for stock trading apps. Further, there is a high demand for data-driven financial decision-making tasks. The stock trading apps' reports and features are useful to any business. These reports' precision and efficiency aid in making better decisions.

The market's end users include banks, financial institutions, and accounting firms. The market's demand for these end-users is increasing as the stock trading app's market fluctuations and risks are analyzed by the stock trading app. The stock trading apps can send alerts to assist with transaction processing. All of these advantageous features contribute to significant stock trading app growth.

What Restrains the Stock Trading App Market?

Stock trading apps can protect users from financial risk and fraud. This exceptional solution aids in the regulation of stock trading apps-critical financial decisions. Compliance with regulatory requirements, on the other hand, is a stumbling block.

In the stock trading app, there are several rules and a standard. Stock trading apps necessitate proper and skilled use. Further, the stock trading apps market's changing compliance standards can stifle growth as well as future trends of stock trading apps. Also, decisions may differ depending on the compliances and standards.

Poor stock trading app management can result in financial losses. These difficulties in the stock trading app market negatively affect the adoption of stock trading apps.

Sudip Saha
Sudip Saha

Principal Consultant

Talk to Analyst

Find your sweet spots for generating winning opportunities in this market.

What are the Trends in the Stock Trading App Market?

Growing digitization in various industries creates market growth along with market opportunities. These factors are to blame for the stock trading app's increased penetration to influence the stock trading apps market adoption trends. Further, the rise of big data is increasing the demand for stock trading apps.

The growing digitization provides many app market opportunities. Furthermore, the key players are taking the initiative to improve the stock trading app to affect the market trends. Furthermore, stock trading app awareness might grow in the coming years. Various banks contribute to the creation of camp gains and programs to increase product awareness resulting in market opportunities.

BI and analytics are driving factors in the market. Stock trading apps' operations might be expanded by BI and analytics. Further, the stock trading app includes features such as knowledge measurement, KPI functions, analytics, and reporting. The stock trading apps market's services are likely to expand as a result of this BI.

Large-scale industries are likely to drive demand for stock trading apps. All of these market expansions and market opportunities might have a significant impact on market growth. Further, business intelligence has the potential to take the stock trading app market to the next level of financial services. Also, these market developments are going to result in high revenue rates.

Comparative View of the Adjacent Stock Trading App Market

Stock Trading App Market:

Attributes Stock Trading App Market
CAGR (2023 to 2033) 21.1%
Market Value (2023) US$ 34.98 billion
Growth Factor Customer satisfaction is a critical driver of progress in the market.
Opportunity Growing digitization in various industries creates growth opportunities.
Key Trends Financial institutions can achieve new developments and profitability with this shift in stock trading app development.

Bioanalytical Testing Services Market:

Attributes Bioanalytical Testing Services Market
CAGR (2023 to 2033) 15.6%
Market Value (2023) US$ 6.0 billion
Growth Factor Growing emphasis on biologics and biosimilar analytical testing.
Opportunity Outsourcing analytical testing is becoming more popular.
Key Trends The demand for specialized bioanalytical testing services is increasing.

Cold Pain Therapy Market:

Attributes Cold Pain Therapy Market
CAGR (2023 to 2033) 5.1%
Market Value (2023) US$ 2.4 billion
Growth Factor The growing geriatric population, rising prevalence of musculoskeletal disorders, and easy availability of cold pain therapy products are driving the market growth.
Opportunity Analgesic patches are becoming more popular.
Key Trends An increase in the number of hip and knee replacement surgeries

Get the data you need at a Fraction of the cost

Personalize your report by choosing insights you need
and save 40%!

Which is the Leading Segment in the Stock Trading App Market by Component?

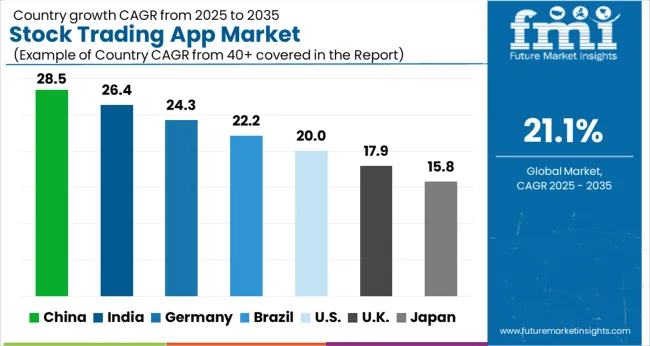
The professional traders lead the stock trading app market share based on end users with a projected market share of 52% through 2033. The individuals category is estimated to hold a CAGR of 22.2% through 2033 by end users in the stock trading app market.
Which is the Leading Segment in the Stock Trading App Market by Platform?

The Android segment leads the market share by platform, with a market share of 50.7% by 2033. The iOS segment holds the market by platform with a projected CAGR of 24.0% through 2033.

Regions CAGR (2023 to 2033)
The United States 18.5%
The United Kingdom 17.4%
China 22.3%
Japan 5.2%
India 25.6%

North America is estimated to have a great stock trading app market share. It is a significant player in the global stock trading apps market. This region has a high awareness of the market.

Using the stock trading app, the market increases customer satisfaction in financial institutions. Further, the region has more investment in North America. In the market, added features and upgrades are prevalent. Furthermore, North America has a few compliance issues. The presence of key players results in a significant rate of adoption of stock trading apps.

The stock trading apps market might see the addition of new features and services in the coming years. Also, the market is segmented into key regional players such as Asia Pacific, Europe, and North America. There is a great deal of interest in the market. Market-empowering innovations and upgrades are also going to result in notable market growth.

The stock trading apps market is likely to expand significantly in the Asia Pacific region. China, Japan, and India are the market’s three most important players. Furthermore, big analytics is a highly sought-after solution in China.

The stock trading app market’s primary driving force is the demand for stock trading apps and analytical technology. Moreover, banks and institutions are significantly expanding in India surging market opportunities. In addition, high-growth nations are merging in Europe and Latin America to affect the market's key trends and opportunities.
How Competition Influences the Stock Trading App Market?

The stock trading app market is becoming increasingly competitive. In a competitive market, market expansion, acquisitions, mergers, and collaborations are more common. The adoption of stock trading apps is being witnessed by central financial systems. In these regions of the market, the stock trading app is witnessing market future trends and becoming widely used.

Companies primarily focus on providing stock trading apps with a zero-based budget methodology. Further, the key market players are promoting the significant development of wealth management apps.

Several companies offer built-in intelligence-based financial solutions. Moreover, rising global demand for Android and Apple iOS-based devices in the stock trading app market might create key market opportunities for global key players. Also, the key market players are working on a transparent financial analysis app.

Recent Developments:

  • Wealthfront announced on Wednesday, January 26, 2022, that it has agreed to be acquired by UBS, one of the world's leading app market firms, in a $ 1.4 billion transaction.
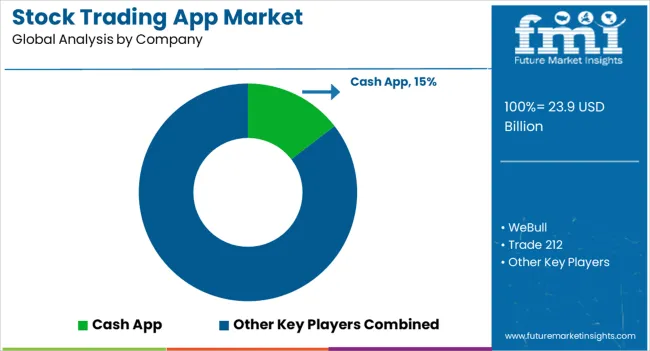
  • One of the well-known fintech apps that provides stock trading services is Cash App, which is owned by Square Inc. Cash App makes it simple for customers to invest in pricey stocks with little capital by enabling commission-free stock buying and selling as well as fractional share trading.

Cash App has revealed its intention to let customers deposit their salaries directly into the app. This change might make it simple for Cash App customers to manage their money and make stock investments by allowing them to have their wages directly transferred into their Cash App accounts.

Key Players Profiled in the Market

Start-ups:

  • Cash App
  • WeBull
  • Trade 212
  • Trade Republic
  • Revolut
  • Freetrade
  • CoinDCX
  • Navi
  • Groww
  • CoinSwitch
  • Investing.com
  • Angel One

Established Vendors:

  • TD Ameritrade
  • Charles Schwab
  • Robinhood
  • Plus500
  • E-Trade
  • eToro
  • Degiro
  • FinShell Pay
  • Binomo
  • Upstox Old
  • Fidelity Investments

Key Segmentation

By Platform:

  • Android
  • iOS
  • Others

By End User:

  • Professional Traders
  • Individuals

By Region:

  • North America
  • Latin America
  • Europe
  • Asia Pacific
  • The Middle East & Africa

Frequently Asked Questions

How Much is the Global Stock Trading App Market Value in Present Time?

The global market value is likely to be around US$ 16,266.1 million in 2023.

What is the Projected Growth Rate for Global Demand for Stock Trading Apps?

Stock trading over mobile apps is expected to rise at a 21.1% CAGR through 2033.

What will be the Global Stock Trading App Market Size in Next Ten Years?

The global stock trading app activities are forecasted to accrue US$ 110,624.4 million by 2033.

What is the Contribution of the United States in the Global Stock Trading App Market?

The leading market, United States, is poised to expand further with an 18.5% CAGR through 2033.

Which Country is Going to Augment the Asia Pacific Stock Trading App Market?

The business over stock trading apps in India is expected to register a 25.6% CAGR till 2033.

Table of Content

1. Executive Summary

    1.1. Global Market Outlook

    1.2. Demand-side Trends

    1.3. Supply-side Trends

    1.4. Technology Roadmap Analysis

    1.5. Analysis and Recommendations

2. Market Overview

    2.1. Market Coverage / Taxonomy

    2.2. Market Definition / Scope / Limitations

3. Market Background

    3.1. Market Dynamics

        3.1.1. Drivers

        3.1.2. Restraints

        3.1.3. Opportunity

        3.1.4. Trends

    3.2. Scenario Forecast

        3.2.1. Demand in Optimistic Scenario

        3.2.2. Demand in Likely Scenario

        3.2.3. Demand in Conservative Scenario

    3.3. Opportunity Map Analysis

    3.4. Investment Feasibility Matrix

    3.5. PESTLE and Porter’s Analysis

    3.6. Regulatory Landscape

        3.6.1. By Key Regions

        3.6.2. By Key Countries

    3.7. Regional Parent Market Outlook

4. Global Market Analysis 2018 to 2022 and Forecast, 2023 to 2033

    4.1. Historical Market Size Value (US$ Million) Analysis, 2018 to 2022

    4.2. Current and Future Market Size Value (US$ Million) Projections, 2023 to 2033

        4.2.1. Y-o-Y Growth Trend Analysis

        4.2.2. Absolute $ Opportunity Analysis

5. Global Market Analysis 2018 to 2022 and Forecast 2023 to 2033, By Platform

    5.1. Introduction / Key Findings

    5.2. Historical Market Size Value (US$ Million) Analysis By Platform, 2018 to 2022

    5.3. Current and Future Market Size Value (US$ Million) Analysis and Forecast By Platform, 2023 to 2033

        5.3.1. Android

        5.3.2. iOS

        5.3.3. Others

    5.4. Y-o-Y Growth Trend Analysis By Platform, 2018 to 2022

    5.5. Absolute $ Opportunity Analysis By Platform, 2023 to 2033

6. Global Market Analysis 2018 to 2022 and Forecast 2023 to 2033, By End User

    6.1. Introduction / Key Findings

    6.2. Historical Market Size Value (US$ Million) Analysis By End User, 2018 to 2022

    6.3. Current and Future Market Size Value (US$ Million) Analysis and Forecast By End User, 2023 to 2033

        6.3.1. Professional Traders

        6.3.2. Individuals

    6.4. Y-o-Y Growth Trend Analysis By End User, 2018 to 2022

    6.5. Absolute $ Opportunity Analysis By End User, 2023 to 2033

7. Global Market Analysis 2018 to 2022 and Forecast 2023 to 2033, By Region

    7.1. Introduction

    7.2. Historical Market Size Value (US$ Million) Analysis By Region, 2018 to 2022

    7.3. Current Market Size Value (US$ Million) Analysis and Forecast By Region, 2023 to 2033

        7.3.1. North America

        7.3.2. Latin America

        7.3.3. Western Europe

        7.3.4. Eastern Europe

        7.3.5. South Asia and Pacific

        7.3.6. East Asia

        7.3.7. Middle East and Africa

    7.4. Market Attractiveness Analysis By Region

8. North America Market Analysis 2018 to 2022 and Forecast 2023 to 2033, By Country

    8.1. Historical Market Size Value (US$ Million) Trend Analysis By Market Taxonomy, 2018 to 2022

    8.2. Market Size Value (US$ Million) Forecast By Market Taxonomy, 2023 to 2033

        8.2.1. By Country

            8.2.1.1. The USA

            8.2.1.2. Canada

        8.2.2. By Platform

        8.2.3. By End User

    8.3. Market Attractiveness Analysis

        8.3.1. By Country

        8.3.2. By Platform

        8.3.3. By End User

    8.4. Key Takeaways

9. Latin America Market Analysis 2018 to 2022 and Forecast 2023 to 2033, By Country

    9.1. Historical Market Size Value (US$ Million) Trend Analysis By Market Taxonomy, 2018 to 2022

    9.2. Market Size Value (US$ Million) Forecast By Market Taxonomy, 2023 to 2033

        9.2.1. By Country

            9.2.1.1. Brazil

            9.2.1.2. Mexico

            9.2.1.3. Rest of Latin America

        9.2.2. By Platform

        9.2.3. By End User

    9.3. Market Attractiveness Analysis

        9.3.1. By Country

        9.3.2. By Platform

        9.3.3. By End User

    9.4. Key Takeaways

10. Western Europe Market Analysis 2018 to 2022 and Forecast 2023 to 2033, By Country

    10.1. Historical Market Size Value (US$ Million) Trend Analysis By Market Taxonomy, 2018 to 2022

    10.2. Market Size Value (US$ Million) Forecast By Market Taxonomy, 2023 to 2033

        10.2.1. By Country

            10.2.1.1. Germany

            10.2.1.2. United Kingdom

            10.2.1.3. France

            10.2.1.4. Spain

            10.2.1.5. Italy

            10.2.1.6. Rest of Western Europe

        10.2.2. By Platform

        10.2.3. By End User

    10.3. Market Attractiveness Analysis

        10.3.1. By Country

        10.3.2. By Platform

        10.3.3. By End User

    10.4. Key Takeaways

11. Eastern Europe Market Analysis 2018 to 2022 and Forecast 2023 to 2033, By Country

    11.1. Historical Market Size Value (US$ Million) Trend Analysis By Market Taxonomy, 2018 to 2022

    11.2. Market Size Value (US$ Million) Forecast By Market Taxonomy, 2023 to 2033

        11.2.1. By Country

            11.2.1.1. Poland

            11.2.1.2. Russia

            11.2.1.3. Czech Republic

            11.2.1.4. Romania

            11.2.1.5. Rest of Eastern Europe

        11.2.2. By Platform

        11.2.3. By End User

    11.3. Market Attractiveness Analysis

        11.3.1. By Country

        11.3.2. By Platform

        11.3.3. By End User

    11.4. Key Takeaways

12. South Asia and Pacific Market Analysis 2018 to 2022 and Forecast 2023 to 2033, By Country

    12.1. Historical Market Size Value (US$ Million) Trend Analysis By Market Taxonomy, 2018 to 2022

    12.2. Market Size Value (US$ Million) Forecast By Market Taxonomy, 2023 to 2033

        12.2.1. By Country

            12.2.1.1. India

            12.2.1.2. Bangladesh

            12.2.1.3. Australia

            12.2.1.4. New Zealand

            12.2.1.5. Rest of South Asia and Pacific

        12.2.2. By Platform

        12.2.3. By End User

    12.3. Market Attractiveness Analysis

        12.3.1. By Country

        12.3.2. By Platform

        12.3.3. By End User

    12.4. Key Takeaways

13. East Asia Market Analysis 2018 to 2022 and Forecast 2023 to 2033, By Country

    13.1. Historical Market Size Value (US$ Million) Trend Analysis By Market Taxonomy, 2018 to 2022

    13.2. Market Size Value (US$ Million) Forecast By Market Taxonomy, 2023 to 2033

        13.2.1. By Country

            13.2.1.1. China

            13.2.1.2. Japan

            13.2.1.3. South Korea

        13.2.2. By Platform

        13.2.3. By End User

    13.3. Market Attractiveness Analysis

        13.3.1. By Country

        13.3.2. By Platform

        13.3.3. By End User

    13.4. Key Takeaways

14. Middle East and Africa Market Analysis 2018 to 2022 and Forecast 2023 to 2033, By Country

    14.1. Historical Market Size Value (US$ Million) Trend Analysis By Market Taxonomy, 2018 to 2022

    14.2. Market Size Value (US$ Million) Forecast By Market Taxonomy, 2023 to 2033

        14.2.1. By Country

            14.2.1.1. GCC Countries

            14.2.1.2. South Africa

            14.2.1.3. Israel

            14.2.1.4. Rest of MEA

        14.2.2. By Platform

        14.2.3. By End User

    14.3. Market Attractiveness Analysis

        14.3.1. By Country

        14.3.2. By Platform

        14.3.3. By End User

    14.4. Key Takeaways

15. Key Countries Market Analysis

    15.1. USA

        15.1.1. Pricing Analysis

        15.1.2. Market Share Analysis, 2022

            15.1.2.1. By Platform

            15.1.2.2. By End User

    15.2. Canada

        15.2.1. Pricing Analysis

        15.2.2. Market Share Analysis, 2022

            15.2.2.1. By Platform

            15.2.2.2. By End User

    15.3. Brazil

        15.3.1. Pricing Analysis

        15.3.2. Market Share Analysis, 2022

            15.3.2.1. By Platform

            15.3.2.2. By End User

    15.4. Mexico

        15.4.1. Pricing Analysis

        15.4.2. Market Share Analysis, 2022

            15.4.2.1. By Platform

            15.4.2.2. By End User

    15.5. Germany

        15.5.1. Pricing Analysis

        15.5.2. Market Share Analysis, 2022

            15.5.2.1. By Platform

            15.5.2.2. By End User

    15.6. United Kingdom

        15.6.1. Pricing Analysis

        15.6.2. Market Share Analysis, 2022

            15.6.2.1. By Platform

            15.6.2.2. By End User

    15.7. France

        15.7.1. Pricing Analysis

        15.7.2. Market Share Analysis, 2022

            15.7.2.1. By Platform

            15.7.2.2. By End User

    15.8. Spain

        15.8.1. Pricing Analysis

        15.8.2. Market Share Analysis, 2022

            15.8.2.1. By Platform

            15.8.2.2. By End User

    15.9. Italy

        15.9.1. Pricing Analysis

        15.9.2. Market Share Analysis, 2022

            15.9.2.1. By Platform

            15.9.2.2. By End User

    15.10. Poland

        15.10.1. Pricing Analysis

        15.10.2. Market Share Analysis, 2022

            15.10.2.1. By Platform

            15.10.2.2. By End User

    15.11. Russia

        15.11.1. Pricing Analysis

        15.11.2. Market Share Analysis, 2022

            15.11.2.1. By Platform

            15.11.2.2. By End User

    15.12. Czech Republic

        15.12.1. Pricing Analysis

        15.12.2. Market Share Analysis, 2022

            15.12.2.1. By Platform

            15.12.2.2. By End User

    15.13. Romania

        15.13.1. Pricing Analysis

        15.13.2. Market Share Analysis, 2022

            15.13.2.1. By Platform

            15.13.2.2. By End User

    15.14. India

        15.14.1. Pricing Analysis

        15.14.2. Market Share Analysis, 2022

            15.14.2.1. By Platform

            15.14.2.2. By End User

    15.15. Bangladesh

        15.15.1. Pricing Analysis

        15.15.2. Market Share Analysis, 2022

            15.15.2.1. By Platform

            15.15.2.2. By End User

    15.16. Australia

        15.16.1. Pricing Analysis

        15.16.2. Market Share Analysis, 2022

            15.16.2.1. By Platform

            15.16.2.2. By End User

    15.17. New Zealand

        15.17.1. Pricing Analysis

        15.17.2. Market Share Analysis, 2022

            15.17.2.1. By Platform

            15.17.2.2. By End User

    15.18. China

        15.18.1. Pricing Analysis

        15.18.2. Market Share Analysis, 2022

            15.18.2.1. By Platform

            15.18.2.2. By End User

    15.19. Japan

        15.19.1. Pricing Analysis

        15.19.2. Market Share Analysis, 2022

            15.19.2.1. By Platform

            15.19.2.2. By End User

    15.20. South Korea

        15.20.1. Pricing Analysis

        15.20.2. Market Share Analysis, 2022

            15.20.2.1. By Platform

            15.20.2.2. By End User

    15.21. GCC Countries

        15.21.1. Pricing Analysis

        15.21.2. Market Share Analysis, 2022

            15.21.2.1. By Platform

            15.21.2.2. By End User

    15.22. South Africa

        15.22.1. Pricing Analysis

        15.22.2. Market Share Analysis, 2022

            15.22.2.1. By Platform

            15.22.2.2. By End User

    15.23. Israel

        15.23.1. Pricing Analysis

        15.23.2. Market Share Analysis, 2022

            15.23.2.1. By Platform

            15.23.2.2. By End User

16. Market Structure Analysis

    16.1. Competition Dashboard

    16.2. Competition Benchmarking

    16.3. Market Share Analysis of Top Players

        16.3.1. By Regional

        16.3.2. By Platform

        16.3.3. By End User

17. Competition Analysis

    17.1. Competition Deep Dive

        17.1.1. Cash App

            17.1.1.1. Overview

            17.1.1.2. Product Portfolio

            17.1.1.3. Profitability by Market Segments

            17.1.1.4. Sales Footprint

            17.1.1.5. Strategy Overview

                17.1.1.5.1. Marketing Strategy

        17.1.2. WeBull

            17.1.2.1. Overview

            17.1.2.2. Product Portfolio

            17.1.2.3. Profitability by Market Segments

            17.1.2.4. Sales Footprint

            17.1.2.5. Strategy Overview

                17.1.2.5.1. Marketing Strategy

        17.1.3. Trade 212

            17.1.3.1. Overview

            17.1.3.2. Product Portfolio

            17.1.3.3. Profitability by Market Segments

            17.1.3.4. Sales Footprint

            17.1.3.5. Strategy Overview

                17.1.3.5.1. Marketing Strategy

        17.1.4. Trade Republic

            17.1.4.1. Overview

            17.1.4.2. Product Portfolio

            17.1.4.3. Profitability by Market Segments

            17.1.4.4. Sales Footprint

            17.1.4.5. Strategy Overview

                17.1.4.5.1. Marketing Strategy

        17.1.5. Revolut

            17.1.5.1. Overview

            17.1.5.2. Product Portfolio

            17.1.5.3. Profitability by Market Segments

            17.1.5.4. Sales Footprint

            17.1.5.5. Strategy Overview

                17.1.5.5.1. Marketing Strategy

        17.1.6. Freetrade

            17.1.6.1. Overview

            17.1.6.2. Product Portfolio

            17.1.6.3. Profitability by Market Segments

            17.1.6.4. Sales Footprint

            17.1.6.5. Strategy Overview

                17.1.6.5.1. Marketing Strategy

        17.1.7. CoinDCX

            17.1.7.1. Overview

            17.1.7.2. Product Portfolio

            17.1.7.3. Profitability by Market Segments

            17.1.7.4. Sales Footprint

            17.1.7.5. Strategy Overview

                17.1.7.5.1. Marketing Strategy

        17.1.8. Navi

            17.1.8.1. Overview

            17.1.8.2. Product Portfolio

            17.1.8.3. Profitability by Market Segments

            17.1.8.4. Sales Footprint

            17.1.8.5. Strategy Overview

                17.1.8.5.1. Marketing Strategy

        17.1.9. Groww

            17.1.9.1. Overview

            17.1.9.2. Product Portfolio

            17.1.9.3. Profitability by Market Segments

            17.1.9.4. Sales Footprint

            17.1.9.5. Strategy Overview

                17.1.9.5.1. Marketing Strategy

        17.1.10. CoinSwitch

            17.1.10.1. Overview

            17.1.10.2. Product Portfolio

            17.1.10.3. Profitability by Market Segments

            17.1.10.4. Sales Footprint

            17.1.10.5. Strategy Overview

                17.1.10.5.1. Marketing Strategy

        17.1.11. Investing.com

            17.1.11.1. Overview

            17.1.11.2. Product Portfolio

            17.1.11.3. Profitability by Market Segments

            17.1.11.4. Sales Footprint

            17.1.11.5. Strategy Overview

                17.1.11.5.1. Marketing Strategy

        17.1.12. Angel One

            17.1.12.1. Overview

            17.1.12.2. Product Portfolio

            17.1.12.3. Profitability by Market Segments

            17.1.12.4. Sales Footprint

            17.1.12.5. Strategy Overview

                17.1.12.5.1. Marketing Strategy

18. Assumptions & Acronyms Used

19. Research Methodology

Don't pay for what you don't need

Customize your report by selecting specific countries or regions and save 30%!

List of Tables

Table 1: Global Market Value (US$ Million) Forecast by Region, 2018 to 2033

Table 2: Global Market Value (US$ Million) Forecast by Platform, 2018 to 2033

Table 3: Global Market Value (US$ Million) Forecast by End User, 2018 to 2033

Table 4: North America Market Value (US$ Million) Forecast by Country, 2018 to 2033

Table 5: North America Market Value (US$ Million) Forecast by Platform, 2018 to 2033

Table 6: North America Market Value (US$ Million) Forecast by End User, 2018 to 2033

Table 7: Latin America Market Value (US$ Million) Forecast by Country, 2018 to 2033

Table 8: Latin America Market Value (US$ Million) Forecast by Platform, 2018 to 2033

Table 9: Latin America Market Value (US$ Million) Forecast by End User, 2018 to 2033

Table 10: Western Europe Market Value (US$ Million) Forecast by Country, 2018 to 2033

Table 11: Western Europe Market Value (US$ Million) Forecast by Platform, 2018 to 2033

Table 12: Western Europe Market Value (US$ Million) Forecast by End User, 2018 to 2033

Table 13: Eastern Europe Market Value (US$ Million) Forecast by Country, 2018 to 2033

Table 14: Eastern Europe Market Value (US$ Million) Forecast by Platform, 2018 to 2033

Table 15: Eastern Europe Market Value (US$ Million) Forecast by End User, 2018 to 2033

Table 16: South Asia and Pacific Market Value (US$ Million) Forecast by Country, 2018 to 2033

Table 17: South Asia and Pacific Market Value (US$ Million) Forecast by Platform, 2018 to 2033

Table 18: South Asia and Pacific Market Value (US$ Million) Forecast by End User, 2018 to 2033

Table 19: East Asia Market Value (US$ Million) Forecast by Country, 2018 to 2033

Table 20: East Asia Market Value (US$ Million) Forecast by Platform, 2018 to 2033

Table 21: East Asia Market Value (US$ Million) Forecast by End User, 2018 to 2033

Table 22: Middle East and Africa Market Value (US$ Million) Forecast by Country, 2018 to 2033

Table 23: Middle East and Africa Market Value (US$ Million) Forecast by Platform, 2018 to 2033

Table 24: Middle East and Africa Market Value (US$ Million) Forecast by End User, 2018 to 2033
Sudip Saha
Sudip Saha

Principal Consultant

Talk to Analyst

Find your sweet spots for generating winning opportunities in this market.

List of Charts

Figure 1: Global Market Value (US$ Million) by Platform, 2023 to 2033

Figure 2: Global Market Value (US$ Million) by End User, 2023 to 2033

Figure 3: Global Market Value (US$ Million) by Region, 2023 to 2033

Figure 4: Global Market Value (US$ Million) Analysis by Region, 2018 to 2033

Figure 5: Global Market Value Share (%) and BPS Analysis by Region, 2023 to 2033

Figure 6: Global Market Y-o-Y Growth (%) Projections by Region, 2023 to 2033

Figure 7: Global Market Value (US$ Million) Analysis by Platform, 2018 to 2033

Figure 8: Global Market Value Share (%) and BPS Analysis by Platform, 2023 to 2033

Figure 9: Global Market Y-o-Y Growth (%) Projections by Platform, 2023 to 2033

Figure 10: Global Market Value (US$ Million) Analysis by End User, 2018 to 2033

Figure 11: Global Market Value Share (%) and BPS Analysis by End User, 2023 to 2033

Figure 12: Global Market Y-o-Y Growth (%) Projections by End User, 2023 to 2033

Figure 13: Global Market Attractiveness by Platform, 2023 to 2033

Figure 14: Global Market Attractiveness by End User, 2023 to 2033

Figure 15: Global Market Attractiveness by Region, 2023 to 2033

Figure 16: North America Market Value (US$ Million) by Platform, 2023 to 2033

Figure 17: North America Market Value (US$ Million) by End User, 2023 to 2033

Figure 18: North America Market Value (US$ Million) by Country, 2023 to 2033

Figure 19: North America Market Value (US$ Million) Analysis by Country, 2018 to 2033

Figure 20: North America Market Value Share (%) and BPS Analysis by Country, 2023 to 2033

Figure 21: North America Market Y-o-Y Growth (%) Projections by Country, 2023 to 2033

Figure 22: North America Market Value (US$ Million) Analysis by Platform, 2018 to 2033

Figure 23: North America Market Value Share (%) and BPS Analysis by Platform, 2023 to 2033

Figure 24: North America Market Y-o-Y Growth (%) Projections by Platform, 2023 to 2033

Figure 25: North America Market Value (US$ Million) Analysis by End User, 2018 to 2033

Figure 26: North America Market Value Share (%) and BPS Analysis by End User, 2023 to 2033

Figure 27: North America Market Y-o-Y Growth (%) Projections by End User, 2023 to 2033

Figure 28: North America Market Attractiveness by Platform, 2023 to 2033

Figure 29: North America Market Attractiveness by End User, 2023 to 2033

Figure 30: North America Market Attractiveness by Country, 2023 to 2033

Figure 31: Latin America Market Value (US$ Million) by Platform, 2023 to 2033

Figure 32: Latin America Market Value (US$ Million) by End User, 2023 to 2033

Figure 33: Latin America Market Value (US$ Million) by Country, 2023 to 2033

Figure 34: Latin America Market Value (US$ Million) Analysis by Country, 2018 to 2033

Figure 35: Latin America Market Value Share (%) and BPS Analysis by Country, 2023 to 2033

Figure 36: Latin America Market Y-o-Y Growth (%) Projections by Country, 2023 to 2033

Figure 37: Latin America Market Value (US$ Million) Analysis by Platform, 2018 to 2033

Figure 38: Latin America Market Value Share (%) and BPS Analysis by Platform, 2023 to 2033

Figure 39: Latin America Market Y-o-Y Growth (%) Projections by Platform, 2023 to 2033

Figure 40: Latin America Market Value (US$ Million) Analysis by End User, 2018 to 2033

Figure 41: Latin America Market Value Share (%) and BPS Analysis by End User, 2023 to 2033

Figure 42: Latin America Market Y-o-Y Growth (%) Projections by End User, 2023 to 2033

Figure 43: Latin America Market Attractiveness by Platform, 2023 to 2033

Figure 44: Latin America Market Attractiveness by End User, 2023 to 2033

Figure 45: Latin America Market Attractiveness by Country, 2023 to 2033

Figure 46: Western Europe Market Value (US$ Million) by Platform, 2023 to 2033

Figure 47: Western Europe Market Value (US$ Million) by End User, 2023 to 2033

Figure 48: Western Europe Market Value (US$ Million) by Country, 2023 to 2033

Figure 49: Western Europe Market Value (US$ Million) Analysis by Country, 2018 to 2033

Figure 50: Western Europe Market Value Share (%) and BPS Analysis by Country, 2023 to 2033

Figure 51: Western Europe Market Y-o-Y Growth (%) Projections by Country, 2023 to 2033

Figure 52: Western Europe Market Value (US$ Million) Analysis by Platform, 2018 to 2033

Figure 53: Western Europe Market Value Share (%) and BPS Analysis by Platform, 2023 to 2033

Figure 54: Western Europe Market Y-o-Y Growth (%) Projections by Platform, 2023 to 2033

Figure 55: Western Europe Market Value (US$ Million) Analysis by End User, 2018 to 2033

Figure 56: Western Europe Market Value Share (%) and BPS Analysis by End User, 2023 to 2033

Figure 57: Western Europe Market Y-o-Y Growth (%) Projections by End User, 2023 to 2033

Figure 58: Western Europe Market Attractiveness by Platform, 2023 to 2033

Figure 59: Western Europe Market Attractiveness by End User, 2023 to 2033

Figure 60: Western Europe Market Attractiveness by Country, 2023 to 2033

Figure 61: Eastern Europe Market Value (US$ Million) by Platform, 2023 to 2033

Figure 62: Eastern Europe Market Value (US$ Million) by End User, 2023 to 2033

Figure 63: Eastern Europe Market Value (US$ Million) by Country, 2023 to 2033

Figure 64: Eastern Europe Market Value (US$ Million) Analysis by Country, 2018 to 2033

Figure 65: Eastern Europe Market Value Share (%) and BPS Analysis by Country, 2023 to 2033

Figure 66: Eastern Europe Market Y-o-Y Growth (%) Projections by Country, 2023 to 2033

Figure 67: Eastern Europe Market Value (US$ Million) Analysis by Platform, 2018 to 2033

Figure 68: Eastern Europe Market Value Share (%) and BPS Analysis by Platform, 2023 to 2033

Figure 69: Eastern Europe Market Y-o-Y Growth (%) Projections by Platform, 2023 to 2033

Figure 70: Eastern Europe Market Value (US$ Million) Analysis by End User, 2018 to 2033

Figure 71: Eastern Europe Market Value Share (%) and BPS Analysis by End User, 2023 to 2033

Figure 72: Eastern Europe Market Y-o-Y Growth (%) Projections by End User, 2023 to 2033

Figure 73: Eastern Europe Market Attractiveness by Platform, 2023 to 2033

Figure 74: Eastern Europe Market Attractiveness by End User, 2023 to 2033

Figure 75: Eastern Europe Market Attractiveness by Country, 2023 to 2033

Figure 76: South Asia and Pacific Market Value (US$ Million) by Platform, 2023 to 2033

Figure 77: South Asia and Pacific Market Value (US$ Million) by End User, 2023 to 2033

Figure 78: South Asia and Pacific Market Value (US$ Million) by Country, 2023 to 2033

Figure 79: South Asia and Pacific Market Value (US$ Million) Analysis by Country, 2018 to 2033

Figure 80: South Asia and Pacific Market Value Share (%) and BPS Analysis by Country, 2023 to 2033

Figure 81: South Asia and Pacific Market Y-o-Y Growth (%) Projections by Country, 2023 to 2033

Figure 82: South Asia and Pacific Market Value (US$ Million) Analysis by Platform, 2018 to 2033

Figure 83: South Asia and Pacific Market Value Share (%) and BPS Analysis by Platform, 2023 to 2033

Figure 84: South Asia and Pacific Market Y-o-Y Growth (%) Projections by Platform, 2023 to 2033

Figure 85: South Asia and Pacific Market Value (US$ Million) Analysis by End User, 2018 to 2033

Figure 86: South Asia and Pacific Market Value Share (%) and BPS Analysis by End User, 2023 to 2033

Figure 87: South Asia and Pacific Market Y-o-Y Growth (%) Projections by End User, 2023 to 2033

Figure 88: South Asia and Pacific Market Attractiveness by Platform, 2023 to 2033

Figure 89: South Asia and Pacific Market Attractiveness by End User, 2023 to 2033

Figure 90: South Asia and Pacific Market Attractiveness by Country, 2023 to 2033

Figure 91: East Asia Market Value (US$ Million) by Platform, 2023 to 2033

Figure 92: East Asia Market Value (US$ Million) by End User, 2023 to 2033

Figure 93: East Asia Market Value (US$ Million) by Country, 2023 to 2033

Figure 94: East Asia Market Value (US$ Million) Analysis by Country, 2018 to 2033

Figure 95: East Asia Market Value Share (%) and BPS Analysis by Country, 2023 to 2033

Figure 96: East Asia Market Y-o-Y Growth (%) Projections by Country, 2023 to 2033

Figure 97: East Asia Market Value (US$ Million) Analysis by Platform, 2018 to 2033

Figure 98: East Asia Market Value Share (%) and BPS Analysis by Platform, 2023 to 2033

Figure 99: East Asia Market Y-o-Y Growth (%) Projections by Platform, 2023 to 2033

Figure 100: East Asia Market Value (US$ Million) Analysis by End User, 2018 to 2033

Figure 101: East Asia Market Value Share (%) and BPS Analysis by End User, 2023 to 2033

Figure 102: East Asia Market Y-o-Y Growth (%) Projections by End User, 2023 to 2033

Figure 103: East Asia Market Attractiveness by Platform, 2023 to 2033

Figure 104: East Asia Market Attractiveness by End User, 2023 to 2033

Figure 105: East Asia Market Attractiveness by Country, 2023 to 2033

Figure 106: Middle East and Africa Market Value (US$ Million) by Platform, 2023 to 2033

Figure 107: Middle East and Africa Market Value (US$ Million) by End User, 2023 to 2033

Figure 108: Middle East and Africa Market Value (US$ Million) by Country, 2023 to 2033

Figure 109: Middle East and Africa Market Value (US$ Million) Analysis by Country, 2018 to 2033

Figure 110: Middle East and Africa Market Value Share (%) and BPS Analysis by Country, 2023 to 2033

Figure 111: Middle East and Africa Market Y-o-Y Growth (%) Projections by Country, 2023 to 2033

Figure 112: Middle East and Africa Market Value (US$ Million) Analysis by Platform, 2018 to 2033

Figure 113: Middle East and Africa Market Value Share (%) and BPS Analysis by Platform, 2023 to 2033

Figure 114: Middle East and Africa Market Y-o-Y Growth (%) Projections by Platform, 2023 to 2033

Figure 115: Middle East and Africa Market Value (US$ Million) Analysis by End User, 2018 to 2033

Figure 116: Middle East and Africa Market Value Share (%) and BPS Analysis by End User, 2023 to 2033

Figure 117: Middle East and Africa Market Y-o-Y Growth (%) Projections by End User, 2023 to 2033

Figure 118: Middle East and Africa Market Attractiveness by Platform, 2023 to 2033

Figure 119: Middle East and Africa Market Attractiveness by End User, 2023 to 2033

Figure 120: Middle East and Africa Market Attractiveness by Country, 2023 to 2033

Recommendations

Technology

App Analytics Market

Published : July 2023

Technology

Mobile Application Market

Published : January 2023

Explore Technology Insights

View Reports