

- Market Size (2026)
- USD 18.2 Bn
- Forecast (2036)
- USD 30.0 Bn
- CAGR (2026 to 2036)
- 5.1%
How big is Submersible Pump Market in 2026?
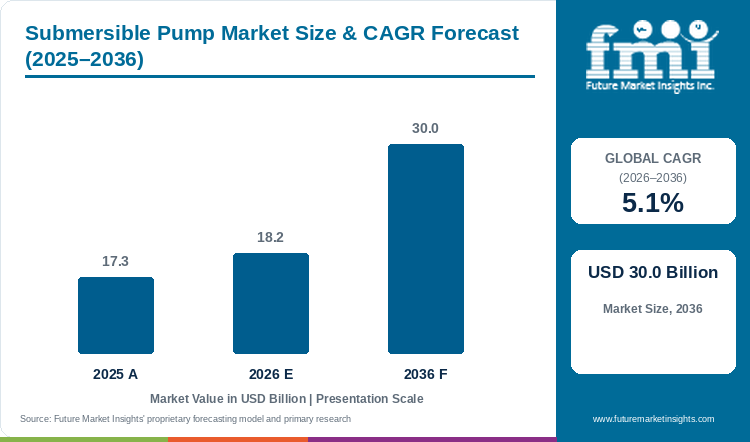
Submersible pump sales advance by a 5.1% CAGR until 2036. Sales total USD 17.3 billion in 2025. For 2026 the estimate reads USD 18.2 billion. Market size is projected to reach USD 30.0 billion at the close of 2036.
Demand for submersible pumps is estimated at USD 18.2 billion in 2026, up from USD 17.3 billion in 2025. FMI finds that sales will post a 5.1% CAGR from 2026 to 2036 and reach USD 30.0 billion by 2036.
Floods and sewage flows create the municipal core of submersible pump sales. For instance, the Asian Development Bank said in December 2025 that Asia and the Pacific accounts for 41% of the world's floods.[1] Each flood brings drainage and dewatering work, so Asian cities will keep buying large non clog units. Municipal buyers hold an estimated 28.7% of 2026 sales, the top end use.
Mine and foundation contractors hire submersible sets from the dewatering pump market, on a 4.0% CAGR from 2026 to 2036. Submersible pumps grow faster at 5.1% because bore wells and sewage lifts add orders beyond site drainage, so pump makers will lean less on construction cycles. Solar sets compete with grid-powered units for each new farm bore well, and the solar pumps market records a 13.5% CAGR across the same decade. Solar powered units will therefore claim more bore well orders.
However, small farms and households will face high prices for efficient motors and variable frequency drives. Suppliers will therefore bundle entry bore well models with financing and village-level service. India posts the fastest profiled CAGR at 7.8%, so dealers in Indian farm districts will see the quickest gains.
Key Market Trends & Insights
- Product type: bore well submersible pumps held 42.5% of 2025 sales, with open well and non clog models behind.
- End use: municipal systems took 28.5% and residential users 22.6% of 2025 sales, and residential buyers will add sales at a fast pace through 2036.
- Power source: IANS reported in March 2026 that India had installed over 10 lakh standalone solar agricultural pumps under PM-KUSUM.[2]
Regional Highlights
- East Asia held 24.5% of 2025 sales according to FMI, ahead of North America at 17.8% and Western Europe at 14.7%.
- Faster than the 5.1% global CAGR for 2026 to 2036, sales will grow in South Asia and Pacific, in Latin America, and in Middle East and Africa.
- India leads the five profiled countries on growth, with a 7.8% CAGR from 2026 to 2036, and Germany posts the lowest CAGR at 3.2%.
Market Size & Forecast
Table 1: Market Size and Forecast for the Submersible Pump Market (USD billion and percentage), 2025 to 2036
| Metric | Value |
|---|---|
| 2025 Market Size | USD 17.3 billion |
| Estimated Market Size in 2026 | USD 18.2 billion |
| Projected Market Size by 2036 | USD 30.0 billion |
| CAGR, 2026 to 2036 | 5.1% |
| Added Revenue, 2026 to 2036 | USD 11.8 billion |
| Market Expansion Multiple | 1.6x |
Submersible units form one product family inside the pumps market, so pump makers with surface and submersible ranges can move factory capacity between the two lines. Surface dewatering sets compete with submersible units on mine and building sites, and the dewatering pump market advances on a 4.0% CAGR from 2026 to 2036. On FMI data, submersible pumps outpace dewatering pumps with a 5.1% CAGR over the same years. Bore well, sewage and drainage pumps placed inside the fluid will take a growing portion of new pump orders from surface-mounted designs.
Flood, Sewage and Irrigation Volumes Behind Pump Duty
Water volumes in three settings decide the duty of a submersible pump. Urban India generates approximately 52,644 million litres per day of sewage against installed treatment capacity of around 31,885 MLD, Water Today reported in August 2026 from a parliamentary panel.[3] The urban gap of more than 20,700 MLD will call for new collection and transfer pumping in Indian cities.[3] About 17,500 publicly owned treatment works operate in the United States, the Congressional Research Service noted in June 2025.[4] EPA estimated national wastewater infrastructure needs of $630 billion over 20 years.[4] Repair and replacement of aging US wastewater assets will bring a long run of sewage pump orders.
Farm water forms the largest pool of water use in China. Agriculture made up 62% of Chinese water use in 2025 at 368.38 billion cubic metres, the Ministry of Water Resources reported.[5] California had 8.2 million acres of irrigated cropland, or 14.9% of all irrigated cropland in the United States, USDA's Economic Research Service said.[6] Large irrigation districts in China and California will buy bore well and open well pumps in large lots. Farm buyers will rank models on energy use per cubic metre of water moved.
Table 2: Water Volume and Pumping Duty Indicators for the Submersible Pump Market (percentage, volumes, counts and USD), mixed reporting years from 2025 to 2026
| Indicator | Data Point | Relevance | Source |
|---|---|---|---|
| Asia and the Pacific share of world floods, December 2025 | 41% | Flood drainage and dewatering work for municipal pumps. | [1] |
| Urban India sewage generation, August 2026 | About 52,644 MLD | Collection and transfer duty for sewage pumps. | [3] |
| Urban India installed sewage treatment capacity, August 2026 | Around 31,885 MLD | Treatment capacity still to be built and pumped. | [3] |
| US publicly owned treatment works, June 2025 | About 17,500 | Installed base for replacement sewage pumps. | [4] |
| EPA wastewater infrastructure needs, 20 years | $630 billion | Scale of US repair and replacement work. | [4] |
| China agricultural water use, 2025 | 62% (368.38 billion cubic metres) | Irrigation pumping from wells and canals. | [5] |
| China industrial water use, 2025 | 95.37 billion cubic metres | Drainage and process water in factories. | [5] |
| California irrigated cropland | 8.2 million acres (14.9% of US) | Farm pumping base in the largest irrigated state. | [6] |
| India grid-connected agricultural pumps solarised under PM-KUSUM, March 2026 | More than 13 lakh | Solar conversion of farm pump sets. | [2] |
Analyst Perspective
“Groundwater extraction, municipal wastewater networks, construction dewatering and mine drainage will all call for more submersible pumps through 2036, and the biggest opening I expect is efficient bore well and sewage units sold with remote monitoring. Water scarcity and urban growth will push utilities and farms toward pumps that cut energy use and downtime.”
- Nikhil Kaitwade, Principal Consultant, Future Market Insights.
How is the submersible pump market segmented?
Four product axes and seven regions frame the submersible pump market. Bore well units headed the product split with 42.5% in 2025, and municipal systems headed the end use split with 28.5%.
By product type: non clog, open well and bore well units.
By power rating: up to 1 HP, >1 to 5 HP, >5 to 20 HP, >20 to 50 HP, and above 50 HP.
By power source: electric powered, solar powered, and hydraulic powered.
By end use: residential, commercial, municipal, industrial, and institutional.
By region: seven regions from East Asia to Latin America.
Why does municipal use lead end use sales?
Municipal systems accounted for 28.5% of 2025 end use demand. In 2026 the municipal slice stands at an estimated 28.7%, against about 22.9% for residential users.
Table 3: End Use Share for the Submersible Pump Market (percentage share), 2026
| End Use | Estimated Share (2026) |
|---|---|
| Municipal | 28.7% |
| Residential | 22.9% |
| Industrial | 21.6% |
| Commercial | 15.3% |
| Institutional | 11.5% |
| Total | 100.0% |
Table 4: End Use Leadership and Market Growth for the Submersible Pump Market (segment and CAGR percentage), 2026 to 2036
| Metric | Value |
|---|---|
| Global CAGR (2026 to 2036) | 5.1% |
| Leading Segment | Municipal |
Sewage collection, wastewater transfer, drainage, pumping stations and flood control all run on submersible units, and sewage, drainage and flood duties give municipal buyers the largest end use slice. FMI data show municipal use at 28.5% of 2025 sales. A submersible pump works inside the fluid, so a wet well or pit needs no separate suction line and the unit fits confined chambers. Residential users rank second with 22.6% of 2025 sales and an estimated 22.9% in 2026. Industrial sites follow at an estimated 21.6%, commercial buildings at about 15.3% and institutions at 11.5% (estimated). Each new urban district adds sewage volume and drainage load, so municipal buyers will stay ahead through 2036.
- Most homes will fit pumps in the up to 1 HP class for borehole supply and waste water removal.
- Household demand will also come from replacement of worn units and from household water management.
Why do bore well pumps lead product type sales?
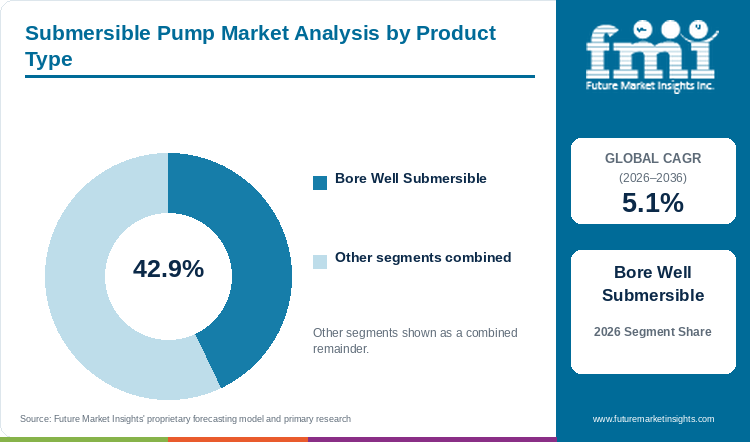
With 42.5% of 2025 product demand, bore well submersible pumps keep the top slot, at an estimated 42.9% in 2026.
Table 5: Product Type Share for the Submersible Pump Market (percentage share), 2026
| Product Type | Estimated Share (2026) |
|---|---|
| Bore Well Submersible | 42.9% |
| Open Well Submersible | 31.6% |
| Non Clog Submersible | 25.5% |
| Total | 100.0% |
Table 6: Product Type Leadership and Market Growth for the Submersible Pump Market (segment and CAGR percentage), 2026 to 2036
| Metric | Value |
|---|---|
| Global CAGR (2026 to 2036) | 5.1% |
| Leading Segment | Bore Well Submersible |
Open well and non clog pumps serve shallow sumps and sewage, and bore well units reach water far below ground. In the FMI split, bore well units held 42.5% of 2025 sales. The compact body of a bore well pump fits inside the well casing and stays submerged as the water table moves, so output holds up through dry months. Open well models hold an estimated 31.6% of 2026 demand, and non clog units hold close to 25.5% (estimated). A large installed base of bore wells across water-stressed regions will keep orders coming for new wells, replacements and upgrades.
- Homes, farms, commercial buildings, institutions and small factories draw on bore wells for primary or backup water.
- India had solarised more than 13 lakh grid-connected agricultural pumps under PM-KUSUM by March 2026.[2]
Why do >1 to 5 HP pumps lead power rating sales?
Pumps rated >1 to 5 HP account for an estimated 31.8% of 2026 power rating sales, ahead of the up to 1 HP class at about 24.3%.
Table 7: Power Rating Share for the Submersible Pump Market (percentage share), 2026
| Power Rating | Estimated Share (2026) |
|---|---|
| >1 to 5 HP | 31.8% |
| Up to 1 HP | 24.3% |
| >5 to 20 HP | 22.6% |
| >20 to 50 HP | 12.4% |
| Above 50 HP | 8.9% |
| Total | 100.0% |
Table 8: Power Rating Leadership and Market Growth for the Submersible Pump Market (segment and CAGR percentage), 2026 to 2036
| Metric | Value |
|---|---|
| Global CAGR (2026 to 2036) | 5.1% |
| Leading Segment | >1 to 5 HP |
Farm bore wells and small commercial buildings need higher flow and head than a single home, and the >1 to 5 HP class serves both groups. Mid-sized pumps of >1 to 5 HP take an estimated 31.8% of 2026 sales. Up to 1 HP units for homes follow at about 24.3%. The >5 to 20 HP class holds an estimated 22.6% in municipal pits and larger irrigation wells. Heavy units of >20 to 50 HP and above 50 HP take 12.4% and 8.9% (estimated), mainly in mine dewatering and flood stations. Solar farm sets will add volume to the low and mid HP classes through 2036.
- Above 50 HP pumps will sell to mines, flood control stations and large water utilities.
- KSB offers IE3 Premium Efficiency and IE4 Super Premium Efficiency motor options on the AmaCan P series.[7]
Why do electric powered pumps lead power source sales?
Electric powered pumps hold an estimated 86.4% of 2026 power source sales, with solar powered units at about 10.2% and hydraulic powered units at 3.4% (estimated).
Table 9: Power Source Share for the Submersible Pump Market (percentage share), 2026
| Power Source | Estimated Share (2026) |
|---|---|
| Electric Powered | 86.4% |
| Solar Powered | 10.2% |
| Hydraulic Powered | 3.4% |
| Total | 100.0% |
Table 10: Power Source Leadership and Market Growth for the Submersible Pump Market (segment and CAGR percentage), 2026 to 2036
| Metric | Value |
|---|---|
| Global CAGR (2026 to 2036) | 5.1% |
| Leading Segment | Electric Powered |
Grid power reaches most cities, factories and farm feeders, so electric motors drive the large majority of submersible pumps. Electric units claim an estimated 86.4% of 2026 sales. Solar powered pumps take about 10.2%, and the solar pumps market shows a 13.5% CAGR from 2026 to 2036. Hydraulic powered units keep an estimated 3.4% on mine and construction sites with hydraulic power packs on hand. Off-grid farms will move toward solar sets, and electric units will stay the default for municipal stations and industrial sumps.
- Electric units at an estimated 86.4% of 2026 sales overlap with the adjacent electric submersible pumps market, so suppliers to municipal stations and industrial sumps sell into both.
- Solar powered units will gain fastest in India, with over 10 lakh standalone solar farm pumps installed under PM-KUSUM by March 2026.[2]
What are the drivers, restraints, and opportunities in the submersible pump market?
Demand for submersible pumps rises with water scarcity, flood control work, mine dewatering and industrial wastewater. Key challenges faced by manufacturers include high purchase prices, hard maintenance access and volatile input costs, with connected pumps and solar pumping as the main sales openings.
- Driver: Water scarcity, floods, mining and industrial wastewater add pumping duty.
- Restraint: Upfront cost, service access and raw material prices slow purchases.
- Opportunity: Sensor-equipped and solar-powered pumps open new sales.
Scarce Water and Deep Mines Add Pumping Duty
Water scarcity drives growth of the submersible pump market, because scarce surface water pushes users toward deeper wells, water reuse and storage. Industrial water use in China reached 95.37 billion cubic metres in 2025, or 16% of total use.[5] Mines pump water out of pits, shafts and tunnels around the clock, so operators buy tough pumps rated for continuous duty. Chemical, food and beverage and pharmaceutical plants will generate more wastewater as plants expand output, and each site will need pumps for collection, transfer and treatment. Flood and dredging work adds a further pool of orders for the heavy-duty units tracked in the submersible dredge pumps market.
Purchase Price, Service Access and Input Costs Weigh on Buyers
High purchase prices hold back residential, farm and small commercial buyers. Energy-efficient motors, variable frequency drives, monitoring kits and custom materials all add to the initial price. Service access is a second barrier, since a pump below the water line in a tank or pit comes out only with hoisting gear, special tools and trained staff. Xylem cited volatility in the prices of commodities, parts, raw materials, energy, utilities, freight, logistics and labor as a risk to manufacturing and operating costs in the 10-K filed in February 2026.[8] Input cost swings will push suppliers toward price escalation clauses in utility contracts.
Connected Monitoring and Solar Sets Open New Sales
Connected pumps offer the clearest new opening. Sales potential is expected to emerge from pumps fitted with sensors, digital controls and connectivity. Connected pumps track motor temperature, vibration, pressure, flow and energy use, so operators spot faults early and cut downtime. Solar pumping systems combine photovoltaic panels, a solar controller and a submersible pump, and give water to farms beyond the grid or to sites with costly grid extensions. India had solarised more than 13 lakh grid-connected agricultural pumps under PM-KUSUM by March 2026.[2] Utilities and farm agencies will favour suppliers that bundle remote monitoring with field service.
Which country CAGRs are profiled in the submersible pump market?
Table 11: Country CAGR Comparison for the Submersible Pump Market (CAGR percentage), 2026 to 2036
| Country | CAGR |
|---|---|
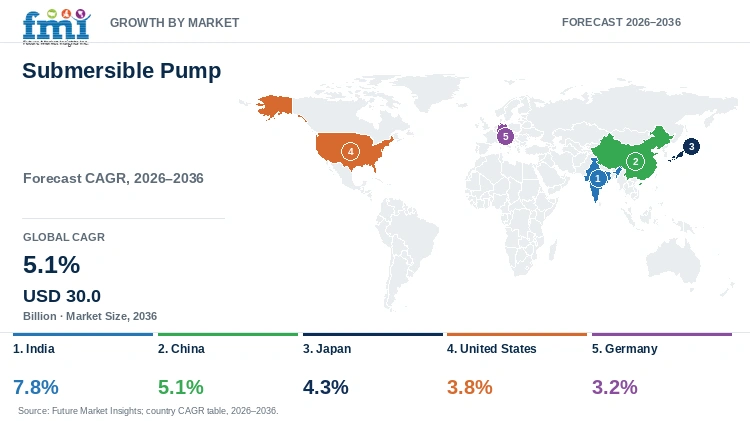
| India | 7.8% |
| China | 5.1% |
| Japan | 4.3% |
| United States | 3.8% |
| Germany | 3.2% |
How do country-level CAGRs compare in the submersible pump market?
FMI places India first of the five countries profiled, with 7.8% as the 2026 to 2036 CAGR. China matches the 5.1% global CAGR, and Japan follows on a 4.3% CAGR. American sales post a 3.8% CAGR on a large installed base of farm and municipal pumps. Germany records the slowest profiled CAGR at 3.2%, since German demand will come mostly from replacement.
- India combines solar farm pumps with urban sewage projects.
- China pairs irrigation on a vast scale with factory water efficiency targets.
- Japan grows on flood drainage and the renewal of municipal stations.
- The United States grows on irrigated farmland and aging wastewater plants.
- Germany grows slowest on mature sewer and treatment networks.
Full report country CAGRs cover: Eastern Europe, East Asia (China, Japan), Latin America, South Asia and Pacific (India), Middle East and Africa, North America (United States) and Western Europe (Germany).
Country-wise Analysis
India Submersible Pump Market Outlook (2026 to 2036)
India held 11.8% of 2025 sales as per FMI, and Indian demand advances on a 7.8% CAGR from 2026 to 2036. Farms draw heavily on groundwater, and agriculture accounts for an estimated 25% to 42% of Indian demand for submersible pumps. Over 10 lakh standalone solar agricultural pumps had been installed under PM-KUSUM by March 2026.[2] Cities add a second stream of orders. Urban India generates approximately 52,644 MLD of sewage, and installed treatment capacity stands at around 31,885 MLD.[3] Of 594 approved AMRUT 2.0 projects, 104 were complete at the time of the parliamentary review.[3] New treatment plants and sewer links under AMRUT will need submersible pumps for collection and transfer.
Key takeaway: Rural dealer networks for solar farm pumps and tender teams for city sewage projects will decide supplier gains in India.
China Submersible Pump Market Outlook (2026 to 2036)
Irrigation dominates Chinese water use. Agriculture made up 62% of total water use in 2025, according to the Ministry of Water Resources.[5] Water consumption per 10,000 yuan of industrial added value dropped 7.2% in 2025.[5] The efficiency drive will move factories toward pumps with variable speed control for drainage, wastewater transfer and process water in tanks, pits and sumps. Mining of construction and industrial minerals will add dewatering orders. FMI reports a 17.4% share of 2025 sales for China. Chinese demand grows on a 5.1% CAGR from 2026 to 2036, equal to the global figure.
Key takeaway: Chinese buyers will favour pumps that cut water and power use per unit of factory output.
United States Submersible Pump Market Outlook (2026 to 2036)
US demand rises on a 3.8% CAGR from 2026 to 2036, backed by a large base of farms and wastewater plants. California had the most irrigated land of any state, with 8.2 million acres of irrigated cropland.[6] Irrigated fields across 8.2 million Californian acres need pumps to move groundwater and surface water. About 17,500 publicly owned treatment works serve roughly 270 million people.[4] Residential water supply and drainage add a third pool of orders. Utility upgrades will favour efficient sewage pumps with remote monitoring.
Key takeaway: Utility capital plans and farm pump replacement in California and other irrigated states will steer American orders.
Japan Submersible Pump Market Outlook (2026 to 2036)
At a 4.3% CAGR from 2026 to 2036, Japan grows faster than Germany and the United States. River basins and urban stormwater systems will set much of Japanese demand. Municipal buyers will replace older units with energy-efficient models. Compact drainage pumps will also serve construction sites in dense cities. Suppliers with service teams close to municipal stations will gain repeat orders.
Key takeaway: Flood readiness and station renewal will carry Japanese sales through 2036.
Germany Submersible Pump Market Outlook (2026 to 2036)
Sewer and treatment networks in Germany are mature, so most orders will replace aging pumps. Germany grows on a 3.2% CAGR from 2026 to 2036, the slowest pace among the five profiled countries. Utilities will rank pumps on lifecycle energy cost, and higher motor efficiency classes will gain in tenders. Stormwater retention and flood protection projects will add orders for large drainage pumps.
Key takeaway: Upgrades of installed stations with efficient motors and controls will carry German orders.
Who are the notable companies in the submersible pump market?
Grundfos Holding A/S, Kubota Corporation, Wacker Neuson Group, Atlas Copco AB, KSB SE & Co. KGaA, Xylem Inc., Ebara Corporation, Sulzer AG, The Weir Group PLC and Tsurumi Manufacturing Co. Ltd. are key suppliers, and Sundram Fasteners Limited entered in 2026.
Competition in submersible pumps is fragmented across multinational pump groups, regional producers and application specialists. Buyers compare energy use, efficiency, price, total cost of ownership and after-sales service. The mix of performance, price and service support lets both global and regional suppliers hold positions in separate end uses and regions.
Recent moves show consolidation at the top and new entry at the base. Xylem agreed to acquire Cornell Pump and Roper Pump from Indicor for $1.46 billion, WaterWorld reported in August 2026.[9] Sundram Fasteners entered with a V4 range of 4-inch submersible pumps for agriculture, starting as a pilot in four Tamil Nadu districts.[10] KSB launched the AmaCan P series for large municipal and industrial water volumes in July 2025.[7]
- Global pump groups: Grundfos Holding A/S, Kubota Corporation, Wacker Neuson Group, Atlas Copco AB, KSB SE & Co. KGaA, Xylem Inc., and Ebara Corporation.
- Emerging and specialist players: Sulzer AG, The Weir Group PLC, and Tsurumi Manufacturing Co. Ltd.
- New entrants: Sundram Fasteners Limited.
Competitive Benchmarking: Submersible Pump Market
Table 12: Competitive Benchmarking for the Submersible Pump Market (qualitative documentation ratings), 2026
| Company | Municipal and Flood Range | Agricultural Range | Acquisitions | Disclosure |
|---|---|---|---|---|
| Xylem Inc. | High | Medium | High | High |
| KSB SE & Co. KGaA | High | Low | Low | Medium |
| Sundram Fasteners Limited | Low | High | Low | Medium |
Grades of High, Medium and Low follow the volume of dated company filings, releases and trade coverage on each item.
Key Developments in the Submersible Pump Market
- In August 2026, Autocar Professional reported that Sundram Fasteners entered the submersible pump segment with V4 4-inch pumps for agriculture, with Tirunelveli as the first launch market.[10]
- In August 2026, WaterWorld reported that Xylem will acquire Cornell Pump and Roper Pump from Indicor for $1.46 billion, with closing expected in the fourth quarter of 2026.[9]
- In July 2026, China News Service reported Ministry of Water Resources data showing a 7.2% drop in water use per 10,000 yuan of industrial added value for 2025.[5]
- In March 2026, IANS reported over 10 lakh standalone solar agricultural pumps installed under PM-KUSUM.[2]
- In December 2025, the Asian Development Bank released the Asian Water Development Outlook 2025.[1]
- In August 2025, impeller.net reported the KSB AmaCan P series of submersible motor pumps with axial propellers, launched in July 2025.[7]
Key Players in the Submersible Pump Market
Global Pump Groups
- Grundfos Holding A/S
- Kubota Corporation
- Wacker Neuson Group
- Atlas Copco AB
- KSB SE & Co. KGaA
- Xylem Inc.
- Ebara Corporation
Emerging and Specialist Players
- Sulzer AG
- The Weir Group PLC
- Tsurumi Manufacturing Co. Ltd.
New Entrants
- Sundram Fasteners Limited
Submersible Pump Market - Report Scope
Table 13: Report Scope for the Submersible Pump Market (coverage fields and definitions), 2026 to 2036
| Coverage field | Report scope |
|---|---|
| Market breakdown | Product type; power rating; power source; end use; region |
| Quantitative units | USD billion |
| Market definition | Submersible pump market covering non clog, open well and bore well submersible pumps from up to 1 HP to above 50 HP, driven by electric, solar or hydraulic power, for residential, commercial, municipal, industrial and institutional use. |
| Regions covered | North America; Latin America; Western Europe; Eastern Europe; East Asia; South Asia and Pacific; Middle East and Africa |
| Countries covered | India; China; Japan; United States; Germany |
| Key companies profiled | Grundfos Holding A/S, Kubota Corporation, Wacker Neuson Group, Atlas Copco AB, KSB SE & Co. KGaA, Xylem Inc., Ebara Corporation, Sulzer AG, The Weir Group PLC, Tsurumi Manufacturing Co. Ltd., Sundram Fasteners Limited |
| Forecast period | 2026 to 2036 |
Submersible Pump Market - Research Methodology
Table 14: Research Methodology for the Submersible Pump Market (research methods and approach), 2026 edition
| Method | Approach |
|---|---|
| Data Sources | Water use, sewage, irrigation and company facts are drawn from ministry bulletins, congressional research, development bank releases, company filings and trade press dated May 2025 or later. |
| Desk Research | Desk research covers flood exposure, sewage volumes, irrigated land, solar pump programs, input costs, acquisitions and product launches. |
| Market Sizing and Forecasting | The forecast builds on a 2025 market size of USD 17.3 billion and a 5.1% CAGR for 2026 to 2036. |
| Data Validation | Water volume figures were matched against ministry and agency releases of the same reporting year. |
Submersible Pump Market by Segments
Submersible Pump Market segmented by Product Type:
- Non Clog Submersible
- Open Well Submersible
-
Bore Well Submersible
Submersible Pump Market segmented by Power Rating:
- Up to 1 HP
- >1 to 5 HP
- >5 to 20 HP
- >20 to 50 HP
- Above 50 HP
Submersible Pump Market segmented by Power Source:
- Electric Powered
- Solar Powered
- Hydraulic Powered
Submersible Pump Market segmented by End Use:
- Residential
- Commercial
- Municipal
- Industrial
- Institutional
Submersible Pump Market by Region
- North America
- Latin America
- Western Europe
- Eastern Europe
- East Asia
- South Asia and Pacific
- Middle East and Africa
Research Sources and Bibliography
- [1] Asian Development Bank. (2025, December 8). Asia and Pacific Lifts 2.7 Billion People from Water Insecurity, but Ecosystem Decline Threatens Progress. https://www.adb.org/news/asia-and-pacific-lifts-2-7-billion-people-water-insecurity-ecosystem-decline-threatens-progress
- [2] newKerala (IANS). (2026, March 11). Over 10 Lakh Solar Pumps Installed, Transforming India's Rural Economy. https://www.newkerala.com/news/a/over-10-lakh-standalone-solar-pumps-installed-13-463.htm
- [3] Water Today. (2026, August 5). India's Urban Sewage-Treatment Gap Crosses 20,700 MLD, Parliamentary Panel Warns. https://magazine.watertoday.org/news/national/india-urban-sewage-treatment-gap-20700-mld-amrut-2026
- [4] Congressional Research Service. (2025, June 10). Wastewater Infrastructure Funding: Background and Affordability Issues (R48565). https://www.everycrsreport.com/files/2025-06-10_R48565_b85ed1e704d1932d387553d022da544988d8ee48.html
- [5] China News Service. (2026, July 2). China sees improving water use efficiency in 2025: report. https://www.ecns.cn/cns-wire/2026-07-02/detail-ihffyeqp1384189.shtml
- [6] USDA Economic Research Service. (2026, January 27). Irrigation & Water Use. https://www.ers.usda.gov/topics/farm-practices-management/irrigation-water-use
- [7] impeller.net. (2025, August 11). New Submersible Motor Pumps with Axial Propeller. https://impeller.net/magazin/new-submersible-motor-pumps-with-axial-propeller/
- [8] Xylem Inc. (2026, February 25). Annual Report on Form 10-K for the fiscal year ended December 31, 2025. https://www.sec.gov/Archives/edgar/data/1524472/000152447226000012/xyl-20251231.htm
- [9] WaterWorld. (2026, August 11). Xylem to acquire Cornell Pump and Roper Pump businesses for $1.46B. https://www.waterworld.com/drinking-water-treatment/distribution/news/55397171/xylem-to-acquire-cornell-pump-and-roper-pump-businesses-for-146b
- [10] Autocar Professional. (2026, August 27). Sundram Fasteners Enters Submersible Pump Segment with V4 Range. https://www.autocarpro.in/news/sundram-fasteners-enters-submersible-pump-segment-with-v4-range-134310
This bibliography is provided for reader reference. The full report contains the complete reference list and detailed citations.
This Report Answers
- What will submersible pump sales total in 2026 and 2036?
- What CAGR will the market record from 2026 to 2036?
- Which end use and product type will hold the largest shares?
- Will solar powered pumps gain ground on electric units?
- Which countries will post the fastest growth?
- Which suppliers will shape competition through 2036?
Frequently Asked Questions
What is the size of the submersible pump market in 2026?
A USD 18.2 billion market will take shape in 2026, with USD 30.0 billion due by 2036 in the FMI forecast. At what rate will the submersible pump market grow? A 5.1% CAGR will carry the market from 2026 to 2036, with groundwater pumping, sewage networks and mine dewatering behind the 5.1% CAGR.
Which end use will lead in 2026?
Municipal systems will keep the largest end use share at an estimated 28.7%, and residential users will follow at about 22.9%.
Which product type will sell the most?
Bore well submersible pumps will stay ahead with an estimated 42.9% of 2026 sales.
Which country will grow fastest?
India, on FMI numbers, will post the quickest country CAGR for 2026 to 2036 at 7.8%, and China will follow on a 5.1% CAGR.
Which companies will matter most in this market?
Grundfos, Kubota, KSB, Xylem and Ebara will compete with Sulzer, Weir, Tsurumi and new entrants such as Sundram Fasteners.
Preview the report firsthand - request a free sample
Get SampleGet the brochure for pricing and purchase details.
Get PDFTable of Content
- Key Takeaways
- Market Size and CAGR
- Top Growth Driver
- Fastest Growing Segment
- Leading Region
- Key Companies
- Emerging Opportunities
- Executive Summary
- Global Market Outlook
- Demand-side Trends
- Supply-side Trends
- Technology Roadmap Analysis
- Analysis and Recommendations
- Analyst Perspective (What is happening? Why now? What should investors know?)
- Key Questions Answered
- How large is the market?
- What is the CAGR?
- What are key trends?
- Which region dominates?
- Who are the leaders?
- Market Overview
- Market Coverage / Taxonomy
- Market Definition / Scope / Limitations
- Research Methodology
- Chapter Orientation
- Analytical Lens and Working Hypotheses
- Market Structure, Signals, and Trend Drivers
- Benchmarking and Cross-market Comparability
- Market Sizing, Forecasting, and Opportunity Mapping
- Research Design and Evidence Framework
- Desk Research Programme (Secondary Evidence)
- Expert Input and Fieldwork (Primary Evidence)
- Tooling, Models, and Reference Databases
- Data Engineering and Model Build
- Quality Assurance and Audit Trail
- Market Background
- Market Dynamics (Drivers, Restraints, Opportunity, Trends)
- Scenario Forecast (Optimistic, Likely, Conservative)
- Impact Analysis
- AI Impact
- Sustainability Impact
- Regulatory Impact
- Technology Impact
- Consumer / Buyer Analysis
- Purchase Drivers
- Adoption Barriers
- Buyer Journey
- Opportunity Map Analysis
- Product Life Cycle Analysis
- Supply Chain Analysis
- Investment Feasibility Matrix
- Value Chain Analysis
- PESTLE and Porter's Analysis
- Regulatory Landscape
- Regional Parent Market Outlook
- Production and Consumption Statistics
- Import and Export Statistics
- Global Market Analysis and Forecast, 2021 to 2036
- Historical Market Size Value (USD Billion) Analysis, 2021 to 2025
- Current and Future Market Size Value (USD Billion) Projections, 2026 to 2036
- Y-o-Y Growth Trend Analysis
- Absolute $ Opportunity Analysis
- Global Market Pricing Analysis, 2021 to 2036
- Global Market Analysis and Forecast, By Product Type, 2021 to 2036
- Introduction / Key Findings
- Historical Market Size Value (USD Billion) Analysis By Product Type, 2021 to 2025
- Current and Future Market Size Value (USD Billion) Analysis and Forecast By Product Type, 2026 to 2036
- Non Clog Submersible
- Open Well Submersible
- Bore Well Submersible
- Y-o-Y Growth Trend Analysis By Product Type, 2021 to 2025
- Absolute $ Opportunity Analysis By Product Type, 2026 to 2036
- Global Market Analysis and Forecast, By Power Rating, 2021 to 2036
- Introduction / Key Findings
- Historical Market Size Value (USD Billion) Analysis By Power Rating, 2021 to 2025
- Current and Future Market Size Value (USD Billion) Analysis and Forecast By Power Rating, 2026 to 2036
- Up to 1 HP
- >1 to 5 HP
- >5 to 20 HP
- >20 to 50 HP
- Above 50 HP
- Y-o-Y Growth Trend Analysis By Power Rating, 2021 to 2025
- Absolute $ Opportunity Analysis By Power Rating, 2026 to 2036
- Global Market Analysis and Forecast, By Power Source, 2021 to 2036
- Introduction / Key Findings
- Historical Market Size Value (USD Billion) Analysis By Power Source, 2021 to 2025
- Current and Future Market Size Value (USD Billion) Analysis and Forecast By Power Source, 2026 to 2036
- Electric Powered
- Solar Powered
- Hydraulic Powered
- Y-o-Y Growth Trend Analysis By Power Source, 2021 to 2025
- Absolute $ Opportunity Analysis By Power Source, 2026 to 2036
- Global Market Analysis and Forecast, By End Use, 2021 to 2036
- Introduction / Key Findings
- Historical Market Size Value (USD Billion) Analysis By End Use, 2021 to 2025
- Current and Future Market Size Value (USD Billion) Analysis and Forecast By End Use, 2026 to 2036
- Residential
- Commercial
- Municipal
- Industrial
- Institutional
- Y-o-Y Growth Trend Analysis By End Use, 2021 to 2025
- Absolute $ Opportunity Analysis By End Use, 2026 to 2036
- Global Market Analysis and Forecast, By Region, 2021 to 2036
- Introduction
- Historical Market Size Value (USD Billion) Analysis By Region, 2021 to 2025
- Current Market Size Value (USD Billion) Analysis and Forecast By Region, 2026 to 2036
- North America
- Latin America
- Western Europe
- Eastern Europe
- East Asia
- South Asia and Pacific
- Middle East and Africa
- Market Attractiveness Analysis By Region
- North America Market Analysis and Forecast, By Country, 2021 to 2036
- Historical Market Size Value (USD Billion) Trend Analysis By Market Taxonomy, 2021 to 2025
- Market Size Value (USD Billion) Forecast By Market Taxonomy, 2026 to 2036
- By Country
- By Product Type
- By Power Rating
- By Power Source
- By End Use
- Market Attractiveness Analysis
- By Country
- By Product Type
- By Power Rating
- By Power Source
- By End Use
- Key Takeaways
- Latin America Market Analysis and Forecast, By Country
- Historical Market Size Value (USD Billion) Trend Analysis By Market Taxonomy, 2021 to 2025
- Market Size Value (USD Billion) Forecast By Market Taxonomy, 2026 to 2036
- By Country
- By Product Type
- By Power Rating
- By Power Source
- By End Use
- Market Attractiveness Analysis
- By Country
- By Product Type
- By Power Rating
- By Power Source
- By End Use
- Key Takeaways
- Western Europe Market Analysis and Forecast, By Country
- Historical Market Size Value (USD Billion) Trend Analysis By Market Taxonomy, 2021 to 2025
- Market Size Value (USD Billion) Forecast By Market Taxonomy, 2026 to 2036
- By Country
- By Product Type
- By Power Rating
- By Power Source
- By End Use
- Market Attractiveness Analysis
- By Country
- By Product Type
- By Power Rating
- By Power Source
- By End Use
- Key Takeaways
- Eastern Europe Market Analysis and Forecast, By Country
- Historical Market Size Value (USD Billion) Trend Analysis By Market Taxonomy, 2021 to 2025
- Market Size Value (USD Billion) Forecast By Market Taxonomy, 2026 to 2036
- By Country
- By Product Type
- By Power Rating
- By Power Source
- By End Use
- Market Attractiveness Analysis
- By Country
- By Product Type
- By Power Rating
- By Power Source
- By End Use
- Key Takeaways
- East Asia Market Analysis and Forecast, By Country
- Historical Market Size Value (USD Billion) Trend Analysis By Market Taxonomy, 2021 to 2025
- Market Size Value (USD Billion) Forecast By Market Taxonomy, 2026 to 2036
- By Country
- By Product Type
- By Power Rating
- By Power Source
- By End Use
- Market Attractiveness Analysis
- By Country
- By Product Type
- By Power Rating
- By Power Source
- By End Use
- Key Takeaways
- South Asia and Pacific Market Analysis and Forecast, By Country
- Historical Market Size Value (USD Billion) Trend Analysis By Market Taxonomy, 2021 to 2025
- Market Size Value (USD Billion) Forecast By Market Taxonomy, 2026 to 2036
- By Country
- By Product Type
- By Power Rating
- By Power Source
- By End Use
- Market Attractiveness Analysis
- By Country
- By Product Type
- By Power Rating
- By Power Source
- By End Use
- Key Takeaways
- Middle East and Africa Market Analysis and Forecast, By Country
- Historical Market Size Value (USD Billion) Trend Analysis By Market Taxonomy, 2021 to 2025
- Market Size Value (USD Billion) Forecast By Market Taxonomy, 2026 to 2036
- By Country
- By Product Type
- By Power Rating
- By Power Source
- By End Use
- Market Attractiveness Analysis
- By Country
- By Product Type
- By Power Rating
- By Power Source
- By End Use
- Key Takeaways
- Key Countries Market Analysis
- India
- Pricing Analysis
- Market Share Analysis, 2025
- By Product Type
- By Power Rating
- By Power Source
- By End Use
- China
- Pricing Analysis
- Market Share Analysis, 2025
- By Product Type
- By Power Rating
- By Power Source
- By End Use
- Japan
- Pricing Analysis
- Market Share Analysis, 2025
- By Product Type
- By Power Rating
- By Power Source
- By End Use
- United States
- Pricing Analysis
- Market Share Analysis, 2025
- By Product Type
- By Power Rating
- By Power Source
- By End Use
- Germany
- Pricing Analysis
- Market Share Analysis, 2025
- By Product Type
- By Power Rating
- By Power Source
- By End Use
- India
- Market Structure Analysis
- Competition Dashboard
- Competition Benchmarking
- Market Share Analysis of Top Players
- By Regional
- By Product Type
- By Power Rating
- By Power Source
- By End Use
- Emerging Startups
- Innovation Benchmarking
- Competition Analysis
- Competition Deep Dive
- Xylem Inc.
- Overview
- Product Portfolio
- Profitability by Market Segments
- Sales Footprint
- Strategy Overview
- Marketing Strategy
- Product Strategy
- Channel Strategy
- KSB SE & Co. KGaA
- Sundram Fasteners Limited
- Grundfos Holding A/S
- Kubota Corporation
- Wacker Neuson Group
- Atlas Copco AB
- Ebara Corporation
- Sulzer AG
- The Weir Group PLC
- Tsurumi Manufacturing Co. Ltd.
- Xylem Inc.
- Case Studies
- Success Stories
- Recent Developments
- Competition Deep Dive
- Assumptions & Acronyms Used


