
- Market Size (2026)
- USD 720.7 Mn
- Forecast (2036)
- USD 1185.2 Mn
- CAGR (2026 to 2036)
- 5.1%
How big is Surface Well Test Manifolds Market in 2026?
The surface well test chokes market is valued at USD 620.7 million in 2026 and is projected to reach USD 1,011.1 million by 2036, expanding at a CAGR of 5.0% over the 2026–2036 period.
Sales of surface well test manifolds are estimated to grow from USD 720.7 million in 2026 to USD 1,185.2 million by 2036, at a CAGR of 5.1%. The market was valued at USD 685.7 million in 2025. These manifolds are used to control pressure as fluids move from the well to testing equipment. They help isolate the well and reduce pressure before the flow reaches measurement or separation systems. Buyers typically look for systems that can handle the required pressure, can be set up quickly, and can be prepared for the next test without long delays.
Demand also varies by how the equipment is used. Field service companies often move the same manifold from one well to another, so equipment utilization and turnaround time matter. Offshore projects have different needs, with more focus on compact systems and remote operation. In the Gulf, new oil and gas projects are supporting demand for well testing equipment. Mature producing regions see more demand from replacement and recertification. The UAE, for example, is expanding its hydrocarbon production capacity toward 5 million barrels per day by 2027. Expro also secured a two-year well testing and flowback contract in the UAE in June 2026. High-utilization field services fleets earn returns by moving the same manifold between wells, while offshore programs place greater weight on footprint and remote operation.
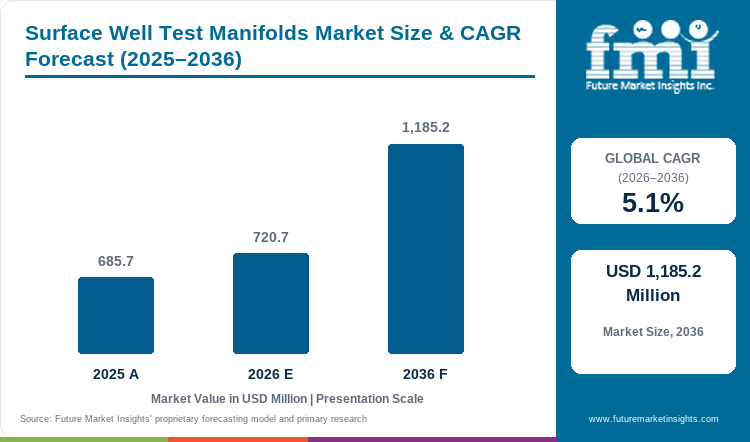
Key Takeaways of surface well test chokes market
- Exploration, appraisal and flowback projects create demand for manifolds because well fluids need to pass through a controlled pressure-reduction stage before they reach measurement or processing equipment.
- Choke manifolds are expected to account for 29.0% of demand by Manifold Type in 2026. They are widely used to control flow and isolate pressure during surface well testing.
- Surface well testing is expected to hold 33.0% of the Application segment in 2026. Well testing firms are projected to account for 35.0% of End Use revenue.
- Higher pressure levels and more demanding well conditions increase qualification requirements. Regular recertification also makes service support an important factor when choosing a supplier.
- Among the countries covered, the UAE is expected to grow at a 5.9% CAGR through 2036, followed by KSA at 5.6%. Growth is supported by ongoing upstream activity in the Gulf.
- Suppliers active in the market include NOV, SLB, Halliburton, Expro, TechnipFMC, SPM Oil & Gas, Worldwide Oilfield Machine and Forum Energy
Analyst Perspective
“Pressure rating is important for getting a manifold approved, but repeat orders depend on how well the equipment performs in the field. Well testing companies often use the same equipment across several jobs, so choke life and the time needed to prepare the manifold for its next job can affect utilization. Remote operation is useful when it makes well testing easier without creating extra maintenance work for field teams.”
- Nikhil Kaitwade, Principal Consultant, Future Market Insights
How is the Surface Well Test Manifolds Market segmented?
The surface well test chokes market is segmented five ways: by choke type, pressure rating, application, end use, and sales channel. Adjustable chokes lead the choke type category with 29.0% of 2026 revenue.
The Manifold Type category includes Choke manifolds, Test manifolds, Flowline manifolds, High-pressure manifolds and Modular well test manifolds. Pressure Rating covers Below 5,000 psi, 5,000-10,000 psi, 10,000-15,000 psi and Above 15,000 psi. Application includes Surface well testing, Flowback testing, Production testing, Cleanup operations and Emergency pressure control. End Use covers Well testing firms, E&P operators, Drilling contractors, Rental fleets and Offshore service providers. Sales Channel includes Direct OEM, Rental equipment suppliers, Oilfield service companies and Regional fabricators.
Why do choke manifolds lead demand within the manifold type category?
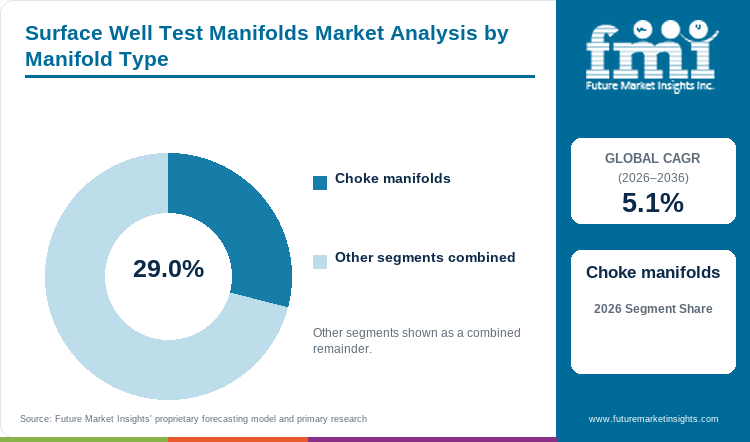
Temporary well tests rarely hold one operating condition from start to finish. Early cleanup may involve solids and unstable flow, and conditions then move toward controlled drawdown and stable measurement. A fixed bean forces crews to stop and replace hardware whenever a different rate is needed, which adds time and handling risk on location. Adjustable chokes let crews change the flow restriction without a changeout. Automated well testing systems extend this further by using electrically actuated adjustable chokes, so settings can be changed remotely as well conditions shift. This flexibility suits test spreads where flow behavior cannot be fully predicted in advance.
- Adjustable chokes are expected to hold 29.0% share in 2026, driven by their ability to cover cleanup, step-rate changes, and stabilized flow with one unit. Fewer hardware changeouts reduce nonproductive time and limit crew exposure during pressure work. Test designers gain a wider operating window from a single installed choke, which simplifies planning across wells with different fluid conditions and rate targets. The value case strengthens when a test program includes several flow stages instead of one fixed rate.
- Well testing firms and oilfield service companies favor adjustable chokes because they reduce the number of spare beans and trim sizes that must be carried to location. Remote actuation also keeps personnel farther from high-pressure lines during rate changes. Procurement teams can standardize on fewer choke families across the fleet, which improves spare part availability and crew familiarity. Commercial value depends on trim durability, because erosive fluids can shorten service life and reduce the benefit of adjustability if repair intervals become too frequent.
Why does below 5,000 psi lead demand within the pressure rating category?
Lower pressure classes lead where planned surface duties do not justify the weight, cost, and qualification burden of a higher-pressure envelope. The commercial choice is a fit-for-purpose pressure class with sufficient safety margin, not the highest rating available. Higher classes remain necessary for severe wells, but they bring heavier bodies, more demanding connections, and more expensive service parts. The same pressure-class discipline appears in adjacent pressure control applications, where equipment selection is tied to the required acceptance pressure rather than maximum theoretical capability. Buyers therefore match the choke to expected duty instead of defaulting to the top of the range.
- Below 5,000 psi is projected to account for 18.0% share in 2026, attributable to its lower equipment weight and simpler connection requirements. Lighter units are easier to mobilize, rig up, and service across multiple well sites. Operators gain a more economical route for wells with moderate differential pressure and predictable fluid behavior. The segment benefits from a broad installed base of compatible flanges, manifolds, and spare parts that shorten procurement lead times.
- Suppliers compete by matching the working pressure envelope to expected differential pressure, fluid condition, connection standard, and service plan. Buyers assess whether a lower class still leaves adequate margin for surges during cleanup and flowback. Clear duty definition before purchase avoids overspecification, which raises cost without improving test quality. Higher classes retain a firm position in demanding wells, yet the volume of moderate-pressure jobs keeps the lower tier commercially important for rental fleets and routine testing programs.
Why does surface well testing lead demand within the application category?
Surface well testing places the choke directly between the producing well and the measurement or separation package. Its setting affects downstream pressure, flow stability, and the conditions under which reservoir performance is observed. This makes the choke an operating control point rather than an accessory. Surface testing also complements the reservoir evidence generated by downhole pressure and temperature surveys, because downhole test objectives still require safe and stable control once produced fluids reach the surface. Any instability at the choke can distort rate readings and weaken the value of the data collected during the test.
- Surface well testing is anticipated to represent 33.0% share in 2026, supported by its direct link between choke performance and data quality. Reliable control allows engineers to hold a rate long enough for pressure and flow measurements to stabilize. Test programs depend on this repeatability when comparing rate steps and interpreting reservoir response. Weak control forces repeat runs, which raise cost and extend time on location.
- Well test contractors and operators prefer purpose-built surface choke setups because the choke, manifold, and separator must work as one controlled system. Early planning defines expected rates, sand risk, and pressure drop so the correct trim and body are selected before mobilization. Purchase decisions increasingly weigh control accuracy and repeatability alongside price. Demand stays tied to drilling completion activity and appraisal programs, where surface testing remains a standard step before production decisions.
Why do well testing firms lead demand within the end use category?
Well testing firms carry utilization risk across repeated jobs. They need chokes that can be mobilized, configured, cleaned, repaired, and returned to service without holding a portable test spread out of revenue-generating work. That makes standardization and field service more important than they are for a one-off equipment purchase. Operators increasingly buy surface well testing equipment together with operational support rather than managing each component separately, which places the equipment and service burden on the testing contractor. Choke selection therefore reflects fleet economics as much as single-job technical fit.
- Well testing firms are expected to hold 36.0% share in 2026, driven by their ownership of large equipment pools and repeated deployment cycles. Fleet economics reward repairable trim, repeatable actuation, and common spare parts because one failed choke can make a larger test package unavailable. Buyers in this group value predictable maintenance intervals and clear failure analysis. Purchasing volume across multiple spreads also gives these firms stronger leverage in supplier negotiations.
- Oilfield service firms, E&P operators, and rental companies buy for different priorities, but well testing firms set the benchmark for field reliability. Their crews handle chokes under changing fluids, sand, and pressure, which exposes weaknesses quickly and shapes supplier reputation. Standard interfaces across choke sizes reduce training needs and speed turnaround between jobs. Commercial value depends on service support, because fast repair and spare availability protect utilization and keep test spreads earning across the year.
Why does direct OEM lead demand within the sales channel category?
Direct OEM purchasing is strongest when the choke must be engineered around an unusual pressure window, erosive fluid, actuation scheme, or package interface. In those jobs, the buyer needs one technical route for trim selection, deviations, spares, and failure analysis. Custom designs that combine fine low-flow control with high-end capacity often require direct engineering discussion before manufacture. Application-specific assemblies can lead to repeat orders once they prove reliable in the field, which reinforces the direct relationship between buyer and manufacturer over later purchase cycles.
- Direct choke OEM is projected to account for 35.0% share in 2026, attributable to its control over design, testing, and documentation. Buyers gain a single point of accountability when performance problems arise in service. Manufacturers can adjust materials, coatings, and trim geometry to match fluid conditions and erosion risk. This engineering depth matters most for high-value jobs where a choke failure would delay the full test program.
- Package suppliers and rental fleets remain important where the operator buys an executed test rather than equipment, and regional distributors serve routine replacement needs. Direct OEM engagement gains weight when choke performance is the main technical bottleneck in the package. Long-term supply agreements, aftermarket parts, and field service support strengthen this channel further. Commercial success depends on delivery reliability and responsiveness, because test schedules leave little room for extended lead times on critical control components.
What are the drivers, restraints and opportunities in the Surface Well Test Manifolds Market?
In the surface well test chokes market, the key driver is exploration, appraisal, cleanup and flowback programs that create repeat demand for controlled surface pressure and rate management, the key restraint is erosive solids, sour fluids and high differential pressure that raise qualification, maintenance and switching costs, and the key opportunity is automated and remotely operated chokes that shift supplier value from standalone hardware toward connected surface-test control.
- Driver: Exploration, appraisal and unconventional flowback add test events that require controlled surface pressure and routing.
- Restraint: Pressure-class qualification, fluid-service compatibility and recertification can lengthen fleet expansion cycles.
- Opportunity: Modular manifolds with remote actuation can reduce field exposure and shorten rig-up work when maintenance remains straightforward.
More wells turn test activity into equipment demand
Manifold purchases follow the number and complexity of wells that must be flowed before commercial decisions are made. U.S. crude production reached a record 13.6 million barrels per day in 2025 even though rig activity declined, showing how drilling productivity can keep test fleets busy without a proportional increase in rig count. For manifold suppliers, that raises the value of reusable packages that can be inspected and returned to service quickly.
Qualification becomes expensive when fleet variety grows
A service company may need different pressure ratings or material configurations across its customer base. Every additional configuration creates its own inspection and spare-parts burden. Current SLB choke manifold specifications span demanding pressure and sour-service applications, illustrating why the component envelope changes substantially between jobs. A manifold that technically meets the working pressure can still become commercially unattractive when maintaining a mixed fleet creates excess turnaround time.
Remote control can improve utilization when field support remains simple
The monetizable opportunity is not automation for its own sake. It is the removal of manual interventions at the highest-energy points in the test spread. Halliburton's FloConnect platform allows remote choke-manifold control and health monitoring, while SLB's automated well testing equipment combines electrically actuated choke and gate valves with remote operation. Suppliers can capture higher-value orders when those controls shorten operating steps without making the package harder to troubleshoot between jobs.
Which country CAGRs are profiled in the Surface Well Test Manifolds Market?
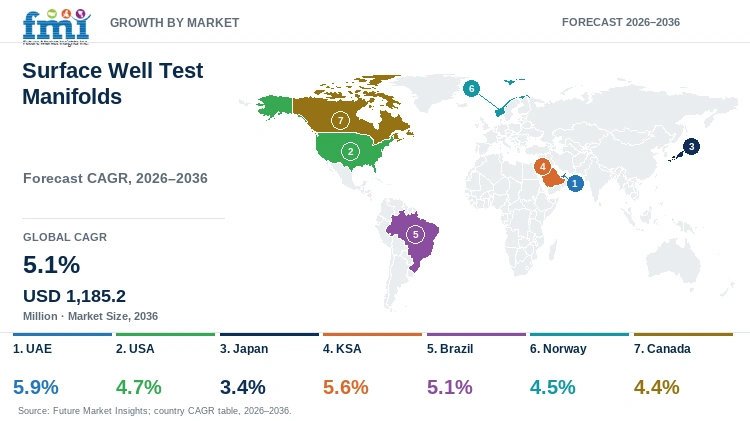
| Country | CAGR |
|---|---|
| UAE | 5.9% |
| USA | 4.7% |
| Japan | 3.4% |
| KSA | 5.6% |
| Brazil | 5.1% |
| Norway | 4.5% |
| Canada | 4.4% |
The profiled country rates range from 3.4% to 5.9% between 2026 and 2036.
How do country-level CAGRs compare in the Surface Well Test Manifolds Market?
UAE and KSA form the highest-growth pair because large hydrocarbon programs create fresh surface-testing requirements. Brazil sits at the global market CAGR, supported by technically demanding offshore production. USA, Norway and Canada form a narrower mature-market band where replacement and fleet utilization matter alongside new capacity. Japan grows more slowly because its domestic E&P base is smaller.
- UAE leads KSA by 0.3 percentage points, placing both Gulf markets in a similar expansion band.
- KSA leads Brazil by 0.5 percentage points as Jafurah and wider gas development add testing intensity.
- Brazil exceeds USA by 0.4 percentage points, with deepwater activity supporting high-specification packages.
- USA, Norway and Canada sit between 4.4% and 4.7%, while Japan remains lower at 3.4%.
Country-wise Analysis
- UAE, 5.9% CAGR: Demand in the UAE is supported by conventional and unconventional oil and gas activity. ADNOC is working toward production capacity of 5 million barrels per day by 2027. Expro also secured a surface well testing and flowback contract for unconventional wells in June 2026. Suppliers therefore need manifold systems that can be used across different well programs without requiring major changes to their fleets.
- USA, 4.7% CAGR: The United States continues to produce more oil while improving drilling efficiency. EIA reported crude oil production of 13.6 million barrels per day in 2025. This creates demand for manifold systems that can be reused across jobs and serviced quickly. Well testing companies also benefit from standardized connections that make it easier to move equipment between sites.
- Japan, 3.4% CAGR: Demand in Japan is more limited because domestic oil and gas production is concentrated across fewer assets. JAPEX reorganized its domestic E&P operations in 2025 around Nagaoka and centralized the management of producing facilities. Demand is therefore more likely to come from targeted equipment replacement and compact systems that can be used at existing sites.
- KSA, 5.6% CAGR: Gas development is becoming an important source of demand in Saudi Arabia. Aramco announced in February 2026 that production had started at Jafurah. The company also plans to increase sales gas production capacity by around 80% by 2030 compared with 2021. These gas projects can require equipment capable of handling higher pressures, supporting demand for high-pressure choke systems and reliable shutdown systems.
- Brazil, 5.1% CAGR: Offshore and pre-salt production shape equipment requirements in Brazil. ANP reported oil production of 3.8 million barrels per day in 2025, including around 3.0 million barrels per day from the pre-salt. Offshore operators have limited deck space and tighter maintenance windows, increasing the value of compact manifold systems that can be serviced efficiently.
- Norway, 4.5% CAGR: Norway has mature oil and gas infrastructure but continues to see exploration around existing producing areas. The Norwegian Offshore Directorate reported 49 completed exploration wells and 21 discoveries in 2025. Development around existing infrastructure creates demand for specialized well testing equipment, although equipment volumes are generally more limited than in large new Gulf projects.
- Canada, 4.4% CAGR: Demand in Canada is concentrated in the western producing provinces. The Canada Energy Regulator reported record crude oil and equivalent production of 5.35 million barrels per day in 2025, with Alberta accounting for 83.8%. This concentration supports mobile manifold fleets that can be moved between jobs and serviced through regional facilities.
Who are the notable companies in the Surface Well Test Manifolds Market?
NOV, SLB, Halliburton, Expro, TechnipFMC, SPM Oil & Gas, Worldwide Oilfield Machine and Forum Energy Technologies are notable companies serving the market.
Competition includes both well testing companies and equipment suppliers. SLB and Halliburton provide surface well testing services along with automated flow control systems. Expro also competes through its well testing and flowback services. NOV, TechnipFMC, SPM Oil & Gas and Worldwide Oilfield Machine have a stronger focus on pressure-control equipment. Forum Energy Technologies supplies choke and valve technologies used in production and well intervention operations.
The buying process differs between these groups. A well testing contractor usually considers the manifold as part of the complete testing setup, while an equipment buyer may purchase the manifold separately from field services. SLB includes floor choke manifolds within its well testing control equipment. Halliburton uses an intelligent choke manifold in its FloConnect system. TechnipFMC also combines manifold systems with automated well testing technology.
Competitive Benchmarking: Surface Well Test Manifolds Market
| Company | Surface Test Manifold Breadth | High-Pressure Control Engineering | Automation / Integrated Deployment | Geographic Reach |
|---|---|---|---|---|
| NOV | High | High | Medium | North America, Middle East, Europe and Asia |
| SLB | High | High | High | Global |
| Halliburton | High | High | High | Global |
| Expro | Medium | High | High | Americas, Europe, Middle East, Africa and Asia-Pacific |
| TechnipFMC | High | High | High | Americas, Middle East, Europe and offshore markets |
| SPM Oil & Gas | Medium | High | Medium | North America and selected international oilfield regions |
| Worldwide Oilfield Machine | High | High | Medium | North America, Middle East, Europe and Asia-Pacific |
| Forum Energy Technologies | Medium | Medium | Medium | North America and selected international markets |
Surface Test Manifold Breadth reflects documented well-test, choke or related manifold capability. High-Pressure Control Engineering considers pressure-rated valves and chokes together with control architecture. Automation / Integrated Deployment reflects remote control, field execution or the ability to integrate the manifold with a wider service package. Current product material supports broad manifold and pressure-control positions for NOV, SLB, Halliburton, TechnipFMC, SPM Oil & Gas and Worldwide Oilfield Machine.
Key Developments in the Surface Well Test Manifolds Market
- In June 2026, Expro secured a two-year contract in the UAE for unconventional well testing and flowback. The scope includes surface well testing equipment plus operating support, linking manifold utilization directly to a multi-year drilling program.
- In Q1 2025, NOV developed and delivered a custom hybrid choke solution for a major Middle East operator. The assembly combined low-end flow control with high-capacity operation in a single trim design, enabling more effective flow management and leading to follow-on orders from the same operator.
- In March 2025, SLB launched EWC electric well control technologies at the SPE/IADC International Drilling Conference in Stavanger, Norway. The system replaces hydraulic BOP control networks with an electric power architecture delivering real-time data and on-demand pressure, reducing installation and maintenance costs for drilling operations.
Key Players in the Surface Well Test Manifolds Market
Integrated Well Testing and Automation Providers
- SLB
- Halliburton
- Expro
Pressure-Control and Manifold OEM Platforms
- NOV
- TechnipFMC
- SPM Oil & Gas
- Worldwide Oilfield Machine
Specialized Flow-Control Providers
- Forum Energy Technologies
Surface Well Test Manifolds Market - Report Scope
| Coverage field | Report scope |
|---|---|
| Market breakdown | By Manifold Type, Pressure Rating, Application, End Use, Sales Channel and Region |
| Quantitative Units | USD million |
| Market Definition | Revenue from surface well test manifold assemblies used to route, isolate and throttle well fluids within surface testing and flowback spreads. The assembly may include valves, chokes, controls and associated manifold piping. |
| Regions Covered | North America, Latin America, Western Europe, Eastern Europe, East Asia, South Asia and Pacific, Middle East and Africa |
| Countries Covered | UAE, USA, Japan, KSA, Brazil, Norway, Canada and more than twenty-five additional countries |
| Key Companies Profiled | NOV, SLB, Halliburton, Expro, TechnipFMC, SPM Oil & Gas, Worldwide Oilfield Machine and Forum Energy Technologies |
| Forecast Period | 2026 to 2036 |
| Approach | Market sizing considers equipment demand, replacement cycles, pressure-rating mix, application requirements and sales-channel structure across upstream testing activity. |
Surface Well Test Manifolds Market - Research Methodology
| Method | Approach |
|---|---|
| Primary Research | Interviews and industry discussions cover manufacturers, well testing companies, rental providers, E&P procurement teams and technical specialists. Topics include pressure classes, fleet utilization, service intervals and purchasing criteria. |
| Desk Research | Analysis reviews government production statistics, current company product material, corporate announcements and technical information relevant to surface pressure control and testing. |
| Market Sizing and Forecasting | Forecasting combines upstream testing activity with equipment replacement requirements, pressure-rating mix, end-use deployment and expected adoption of modular or remotely controlled systems. |
| Data Validation | Market values and qualitative conclusions are tested across demand conditions, supplier portfolios and the defined segmentation to maintain consistent treatment across the forecast period. |
Surface Well Test Manifolds Market by Segments
Surface Well Test Manifolds Market segmented by Manifold Type:
- Choke manifolds
- Test manifolds
- Flowline manifolds
- High-pressure manifolds
- Modular well test manifolds
Surface Well Test Manifolds Market segmented by Pressure Rating:
- Below 5,000 psi
- 5,000-10,000 psi
- 10,000-15,000 psi
- Above 15,000 psi
Surface Well Test Manifolds Market segmented by Application:
- Surface well testing
- Flowback testing
- Production testing
- Cleanup operations
- Emergency pressure control
Surface Well Test Manifolds Market segmented by End Use:
- Well testing firms
- E&P operators
- Drilling contractors
- Rental fleets
- Offshore service providers
Surface Well Test Manifolds Market segmented by Sales Channel:
- Direct OEM
- Rental equipment suppliers
- Oilfield service companies
- Regional fabricators
Surface Well Test Manifolds Market by Region:
- North America
- United States
- Canada
- Mexico
- Latin America
- Brazil
- Mexico
- Argentina
- Chile
- Western Europe
- Germany
- France
- United Kingdom
- Italy
- Spain
- Benelux
- Nordics
- Eastern Europe
- Poland
- Czech Republic
- Romania
- Hungary
- East Asia
- China
- Japan
- South Korea
- South Asia and Pacific
- India
- ASEAN
- Australia and New Zealand
- Middle East and Africa
- GCC Countries
- South Africa
- Türkiye
- Israel
Research Sources and Bibliography
- U.S. Energy Information Administration. July 9, 2026. The United States produced more crude oil than any other country in 2025.
- ADNOC. Accessed 2026. Responsible Growth.
- Saudi Aramco. February 26, 2026. Aramco's gas strategy builds momentum with major progress towards growth target.
- Agência Nacional do Petróleo, Gás Natural e Biocombustíveis. 2026. ANP divulga dados consolidados do setor regulado em 2025.
- Norwegian Offshore Directorate. 2026. Oil and gas on the NCS moving forward.
- Canada Energy Regulator. June 17, 2026. Canada sets new record in crude oil production in 2025.
- Japan Petroleum Exploration Co., Ltd. May 13, 2025. Reorganization to Reinforce Business Execution Structure for Domestic Oil and Natural Gas E&P Business and Natural Gas and LNG Supply Business.
- Expro. June 11, 2026. Expro Secures Two-Year Contract for Unconventional Well Testing in the UAE.
- SLB. March 4, 2025. SLB Electrifies Well Control With Latest Tech.
- NOV. 2025. First Quarter 2025 Results.
- NOV. Accessed 2026. Well Service Manifolds.
- SLB. Accessed 2026. Well Testing Control Equipment.
- Halliburton. Accessed 2026. FloConnect Surface Automation Platform.
- TechnipFMC. Accessed 2026. Pressure Control.
- SPM Oil & Gas. Accessed 2026. Mathena Choke Manifold Surface Control Rental.
- Worldwide Oilfield Machine. Accessed 2026. Worldwide Oilfield Machine product portfolio.
- Forum Energy Technologies. Accessed 2026. Produced Fluid Handling and Production Products.
This Report Answers
- What is the Surface Well Test Manifolds Market size in 2026 and what value is forecast for 2036?
- Why do Choke manifolds lead the Manifold Type category?
- How does Pressure Rating influence manifold cost and fleet deployment?
- Why does Surface well testing lead Application demand?
- How do well testing firms evaluate manifold utilization and maintenance?
- How do growth rates differ across UAE, USA, Japan, KSA, Brazil, Norway and Canada?
- Which companies combine pressure-control equipment with integrated well testing?
- How are automation and remote actuation changing surface well test manifold purchasing?
Table of Content
Table of Content
- Key Takeaways
- Market Size and CAGR
- Top Growth Driver
- Fastest Growing Segment
- Leading Region
- Key Companies
- Emerging Opportunities
- Executive Summary
- Global Market Outlook
- Demand-side Trends
- Supply-side Trends
- Technology Roadmap Analysis
- Analysis and Recommendations
- Analyst Perspective (What is happening? Why now? What should investors know?)
- Key Questions Answered
- How large is the market?
- What is the CAGR?
- What are key trends?
- Which region dominates?
- Who are the leaders?
Read More...
- Market Overview
- Market Coverage / Taxonomy
- Market Definition / Scope / Limitations
- Research Methodology
- Chapter Orientation
- Analytical Lens and Working Hypotheses
- Market Structure, Signals, and Trend Drivers
- Benchmarking and Cross-market Comparability
- Market Sizing, Forecasting, and Opportunity Mapping
- Research Design and Evidence Framework
- Desk Research Programme (Secondary Evidence)
- Expert Input and Fieldwork (Primary Evidence)
- Tooling, Models, and Reference Databases
- Data Engineering and Model Build
- Quality Assurance and Audit Trail
- Market Background
- Market Dynamics (Drivers, Restraints, Opportunity, Trends)
- Scenario Forecast (Optimistic, Likely, Conservative)
- Impact Analysis
- AI Impact
- Sustainability Impact
- Regulatory Impact
- Technology Impact
- Consumer / Buyer Analysis
- Purchase Drivers
- Adoption Barriers
- Buyer Journey
- Opportunity Map Analysis
- Product Life Cycle Analysis
- Supply Chain Analysis
- Investment Feasibility Matrix
- Value Chain Analysis
- PESTLE and Porter's Analysis
- Regulatory Landscape
- Regional Parent Market Outlook
- Production and Consumption Statistics
- Import and Export Statistics
- Global Market Analysis and Forecast, 2021 to 2036
- Historical Market Size Value (USD Million) Analysis, 2021 to 2025
- Current and Future Market Size Value (USD Million) Projections, 2026 to 2036
- Y-o-Y Growth Trend Analysis
- Absolute $ Opportunity Analysis
- Global Market Pricing Analysis, 2021 to 2036
- Global Market Analysis and Forecast, By Manifold Type, 2021 to 2036
- Introduction / Key Findings
- Historical Market Size Value (USD Million) Analysis By Manifold Type, 2021 to 2025
- Current and Future Market Size Value (USD Million) Analysis and Forecast By Manifold Type, 2026 to 2036
- Choke manifolds
- Test manifolds
- Flowline manifolds
- High-pressure manifolds
- Modular well test manifolds
- Y-o-Y Growth Trend Analysis By Manifold Type, 2021 to 2025
- Absolute $ Opportunity Analysis By Manifold Type, 2026 to 2036
- Global Market Analysis and Forecast, By Pressure Rating, 2021 to 2036
- Introduction / Key Findings
- Historical Market Size Value (USD Million) Analysis By Pressure Rating, 2021 to 2025
- Current and Future Market Size Value (USD Million) Analysis and Forecast By Pressure Rating, 2026 to 2036
- Below 5,000 psi
- 5,000-10,000 psi
- 10,000-15,000 psi
- Above 15,000 psi
- Y-o-Y Growth Trend Analysis By Pressure Rating, 2021 to 2025
- Absolute $ Opportunity Analysis By Pressure Rating, 2026 to 2036
- Global Market Analysis and Forecast, By Application, 2021 to 2036
- Introduction / Key Findings
- Historical Market Size Value (USD Million) Analysis By Application, 2021 to 2025
- Current and Future Market Size Value (USD Million) Analysis and Forecast By Application, 2026 to 2036
- Surface well testing
- Flowback testing
- Production testing
- Cleanup operations
- Emergency pressure control
- Y-o-Y Growth Trend Analysis By Application, 2021 to 2025
- Absolute $ Opportunity Analysis By Application, 2026 to 2036
- Global Market Analysis and Forecast, By End Use, 2021 to 2036
- Introduction / Key Findings
- Historical Market Size Value (USD Million) Analysis By End Use, 2021 to 2025
- Current and Future Market Size Value (USD Million) Analysis and Forecast By End Use, 2026 to 2036
- Well testing firms
- E&P operators
- Drilling contractors
- Rental fleets
- Offshore service providers
- Y-o-Y Growth Trend Analysis By End Use, 2021 to 2025
- Absolute $ Opportunity Analysis By End Use, 2026 to 2036
- Global Market Analysis and Forecast, By Sales Channel, 2021 to 2036
- Introduction / Key Findings
- Historical Market Size Value (USD Million) Analysis By Sales Channel, 2021 to 2025
- Current and Future Market Size Value (USD Million) Analysis and Forecast By Sales Channel, 2026 to 2036
- Direct OEM
- Rental equipment suppliers
- Oilfield service companies
- Regional fabricators
- Y-o-Y Growth Trend Analysis By Sales Channel, 2021 to 2025
- Absolute $ Opportunity Analysis By Sales Channel, 2026 to 2036
- Global Market Analysis and Forecast, By Region, 2021 to 2036
- Introduction
- Historical Market Size Value (USD Million) Analysis By Region, 2021 to 2025
- Current Market Size Value (USD Million) Analysis and Forecast By Region, 2026 to 2036
- North America
- Latin America
- Western Europe
- Eastern Europe
- East Asia
- South Asia and Pacific
- Middle East and Africa
- Market Attractiveness Analysis By Region
- North America Market Analysis and Forecast, By Country, 2021 to 2036
- Historical Market Size Value (USD Million) Trend Analysis By Market Taxonomy, 2021 to 2025
- Market Size Value (USD Million) Forecast By Market Taxonomy, 2026 to 2036
- By Country
- United States
- Canada
- Mexico
- By Manifold Type
- By Pressure Rating
- By Application
- By End Use
- By Sales Channel
- By Country
- Market Attractiveness Analysis
- By Country
- By Manifold Type
- By Pressure Rating
- By Application
- By End Use
- By Sales Channel
- Key Takeaways
- Latin America Market Analysis and Forecast, By Country
- Historical Market Size Value (USD Million) Trend Analysis By Market Taxonomy, 2021 to 2025
- Market Size Value (USD Million) Forecast By Market Taxonomy, 2026 to 2036
- By Country
- Brazil
- Mexico
- Argentina
- Chile
- By Manifold Type
- By Pressure Rating
- By Application
- By End Use
- By Sales Channel
- By Country
- Market Attractiveness Analysis
- By Country
- By Manifold Type
- By Pressure Rating
- By Application
- By End Use
- By Sales Channel
- Key Takeaways
- Western Europe Market Analysis and Forecast, By Country
- Historical Market Size Value (USD Million) Trend Analysis By Market Taxonomy, 2021 to 2025
- Market Size Value (USD Million) Forecast By Market Taxonomy, 2026 to 2036
- By Country
- Germany
- France
- United Kingdom
- Italy
- Spain
- Benelux
- Nordics
- By Manifold Type
- By Pressure Rating
- By Application
- By End Use
- By Sales Channel
- By Country
- Market Attractiveness Analysis
- By Country
- By Manifold Type
- By Pressure Rating
- By Application
- By End Use
- By Sales Channel
- Key Takeaways
- Eastern Europe Market Analysis and Forecast, By Country
- Historical Market Size Value (USD Million) Trend Analysis By Market Taxonomy, 2021 to 2025
- Market Size Value (USD Million) Forecast By Market Taxonomy, 2026 to 2036
- By Country
- Poland
- Czech Republic
- Romania
- Hungary
- By Manifold Type
- By Pressure Rating
- By Application
- By End Use
- By Sales Channel
- By Country
- Market Attractiveness Analysis
- By Country
- By Manifold Type
- By Pressure Rating
- By Application
- By End Use
- By Sales Channel
- Key Takeaways
- East Asia Market Analysis and Forecast, By Country
- Historical Market Size Value (USD Million) Trend Analysis By Market Taxonomy, 2021 to 2025
- Market Size Value (USD Million) Forecast By Market Taxonomy, 2026 to 2036
- By Country
- China
- Japan
- South Korea
- By Manifold Type
- By Pressure Rating
- By Application
- By End Use
- By Sales Channel
- By Country
- Market Attractiveness Analysis
- By Country
- By Manifold Type
- By Pressure Rating
- By Application
- By End Use
- By Sales Channel
- Key Takeaways
- South Asia and Pacific Market Analysis and Forecast, By Country
- Historical Market Size Value (USD Million) Trend Analysis By Market Taxonomy, 2021 to 2025
- Market Size Value (USD Million) Forecast By Market Taxonomy, 2026 to 2036
- By Country
- India
- ASEAN
- Australia and New Zealand
- By Manifold Type
- By Pressure Rating
- By Application
- By End Use
- By Sales Channel
- By Country
- Market Attractiveness Analysis
- By Country
- By Manifold Type
- By Pressure Rating
- By Application
- By End Use
- By Sales Channel
- Key Takeaways
- Middle East and Africa Market Analysis and Forecast, By Country
- Historical Market Size Value (USD Million) Trend Analysis By Market Taxonomy, 2021 to 2025
- Market Size Value (USD Million) Forecast By Market Taxonomy, 2026 to 2036
- By Country
- GCC Countries
- South Africa
- Türkiye
- Israel
- By Manifold Type
- By Pressure Rating
- By Application
- By End Use
- By Sales Channel
- By Country
- Market Attractiveness Analysis
- By Country
- By Manifold Type
- By Pressure Rating
- By Application
- By End Use
- By Sales Channel
- Key Takeaways
- Key Countries Market Analysis
- United States
- Pricing Analysis
- Market Share Analysis, 2025
- By Manifold Type
- By Pressure Rating
- By Application
- By End Use
- By Sales Channel
- Canada
- Pricing Analysis
- Market Share Analysis, 2025
- By Manifold Type
- By Pressure Rating
- By Application
- By End Use
- By Sales Channel
- Mexico
- Pricing Analysis
- Market Share Analysis, 2025
- By Manifold Type
- By Pressure Rating
- By Application
- By End Use
- By Sales Channel
- Brazil
- Pricing Analysis
- Market Share Analysis, 2025
- By Manifold Type
- By Pressure Rating
- By Application
- By End Use
- By Sales Channel
- Chile
- Pricing Analysis
- Market Share Analysis, 2025
- By Manifold Type
- By Pressure Rating
- By Application
- By End Use
- By Sales Channel
- Germany
- Pricing Analysis
- Market Share Analysis, 2025
- By Manifold Type
- By Pressure Rating
- By Application
- By End Use
- By Sales Channel
- United Kingdom
- Pricing Analysis
- Market Share Analysis, 2025
- By Manifold Type
- By Pressure Rating
- By Application
- By End Use
- By Sales Channel
- Italy
- Pricing Analysis
- Market Share Analysis, 2025
- By Manifold Type
- By Pressure Rating
- By Application
- By End Use
- By Sales Channel
- Spain
- Pricing Analysis
- Market Share Analysis, 2025
- By Manifold Type
- By Pressure Rating
- By Application
- By End Use
- By Sales Channel
- France
- Pricing Analysis
- Market Share Analysis, 2025
- By Manifold Type
- By Pressure Rating
- By Application
- By End Use
- By Sales Channel
- India
- Pricing Analysis
- Market Share Analysis, 2025
- By Manifold Type
- By Pressure Rating
- By Application
- By End Use
- By Sales Channel
- ASEAN
- Pricing Analysis
- Market Share Analysis, 2025
- By Manifold Type
- By Pressure Rating
- By Application
- By End Use
- By Sales Channel
- Australia and New Zealand
- Pricing Analysis
- Market Share Analysis, 2025
- By Manifold Type
- By Pressure Rating
- By Application
- By End Use
- By Sales Channel
- China
- Pricing Analysis
- Market Share Analysis, 2025
- By Manifold Type
- By Pressure Rating
- By Application
- By End Use
- By Sales Channel
- Japan
- Pricing Analysis
- Market Share Analysis, 2025
- By Manifold Type
- By Pressure Rating
- By Application
- By End Use
- By Sales Channel
- South Korea
- Pricing Analysis
- Market Share Analysis, 2025
- By Manifold Type
- By Pressure Rating
- By Application
- By End Use
- By Sales Channel
- Poland
- Pricing Analysis
- Market Share Analysis, 2025
- By Manifold Type
- By Pressure Rating
- By Application
- By End Use
- By Sales Channel
- Hungary
- Pricing Analysis
- Market Share Analysis, 2025
- By Manifold Type
- By Pressure Rating
- By Application
- By End Use
- By Sales Channel
- Türkiye
- Pricing Analysis
- Market Share Analysis, 2025
- By Manifold Type
- By Pressure Rating
- By Application
- By End Use
- By Sales Channel
- South Africa
- Pricing Analysis
- Market Share Analysis, 2025
- By Manifold Type
- By Pressure Rating
- By Application
- By End Use
- By Sales Channel
- UAE
- Pricing Analysis
- Market Share Analysis, 2025
- By Manifold Type
- By Pressure Rating
- By Application
- By End Use
- By Sales Channel
- KSA
- Pricing Analysis
- Market Share Analysis, 2025
- By Manifold Type
- By Pressure Rating
- By Application
- By End Use
- By Sales Channel
- Norway
- Pricing Analysis
- Market Share Analysis, 2025
- By Manifold Type
- By Pressure Rating
- By Application
- By End Use
- By Sales Channel
- United States
- Market Structure Analysis
- Competition Dashboard
- Competition Benchmarking
- Market Share Analysis of Top Players
- By Regional
- By Manifold Type
- By Pressure Rating
- By Application
- By End Use
- By Sales Channel
- Emerging Startups
- Innovation Benchmarking
- Competition Analysis
- Competition Deep Dive
- NOV
- Overview
- Product Portfolio
- Profitability by Market Segments
- Sales Footprint
- Strategy Overview
- Marketing Strategy
- Product Strategy
- Channel Strategy
- SLB
- Halliburton
- Expro
- TechnipFMC
- SPM Oil & Gas
- Worldwide Oilfield Machine
- Forum Energy Technologies
- NOV
- Case Studies
- Success Stories
- Recent Developments
- Competition Deep Dive
- Assumptions & Acronyms Used
List of Tables
- Table 1: Global Market Value (USD Million) Forecast by Region, 2021 to 2036
- Table 2: Global Market Value (USD Million) Forecast by Manifold Type, 2021 to 2036
- Table 3: Global Market Value (USD Million) Forecast by Pressure Rating, 2021 to 2036
- Table 4: Global Market Value (USD Million) Forecast by Application, 2021 to 2036
- Table 5: Global Market Value (USD Million) Forecast by End Use, 2021 to 2036
- Table 6: Global Market Value (USD Million) Forecast by Sales Channel, 2021 to 2036
- Table 7: North America Market Value (USD Million) Forecast by Country, 2021 to 2036
- Table 8: North America Market Value (USD Million) Forecast by Manifold Type, 2021 to 2036
- Table 9: North America Market Value (USD Million) Forecast by Pressure Rating, 2021 to 2036
- Table 10: North America Market Value (USD Million) Forecast by Application, 2021 to 2036
- Table 11: North America Market Value (USD Million) Forecast by End Use, 2021 to 2036
- Table 12: North America Market Value (USD Million) Forecast by Sales Channel, 2021 to 2036
- Table 13: Latin America Market Value (USD Million) Forecast by Country, 2021 to 2036
- Table 14: Latin America Market Value (USD Million) Forecast by Manifold Type, 2021 to 2036
- Table 15: Latin America Market Value (USD Million) Forecast by Pressure Rating, 2021 to 2036
- Table 16: Latin America Market Value (USD Million) Forecast by Application, 2021 to 2036
- Table 17: Latin America Market Value (USD Million) Forecast by End Use, 2021 to 2036
- Table 18: Latin America Market Value (USD Million) Forecast by Sales Channel, 2021 to 2036
- Table 19: Western Europe Market Value (USD Million) Forecast by Country, 2021 to 2036
- Table 20: Western Europe Market Value (USD Million) Forecast by Manifold Type, 2021 to 2036
- Table 21: Western Europe Market Value (USD Million) Forecast by Pressure Rating, 2021 to 2036
- Table 22: Western Europe Market Value (USD Million) Forecast by Application, 2021 to 2036
- Table 23: Western Europe Market Value (USD Million) Forecast by End Use, 2021 to 2036
- Table 24: Western Europe Market Value (USD Million) Forecast by Sales Channel, 2021 to 2036
- Table 25: Eastern Europe Market Value (USD Million) Forecast by Country, 2021 to 2036
- Table 26: Eastern Europe Market Value (USD Million) Forecast by Manifold Type, 2021 to 2036
- Table 27: Eastern Europe Market Value (USD Million) Forecast by Pressure Rating, 2021 to 2036
- Table 28: Eastern Europe Market Value (USD Million) Forecast by Application, 2021 to 2036
- Table 29: Eastern Europe Market Value (USD Million) Forecast by End Use, 2021 to 2036
- Table 30: Eastern Europe Market Value (USD Million) Forecast by Sales Channel, 2021 to 2036
- Table 31: East Asia Market Value (USD Million) Forecast by Country, 2021 to 2036
- Table 32: East Asia Market Value (USD Million) Forecast by Manifold Type, 2021 to 2036
- Table 33: East Asia Market Value (USD Million) Forecast by Pressure Rating, 2021 to 2036
- Table 34: East Asia Market Value (USD Million) Forecast by Application, 2021 to 2036
- Table 35: East Asia Market Value (USD Million) Forecast by End Use, 2021 to 2036
- Table 36: East Asia Market Value (USD Million) Forecast by Sales Channel, 2021 to 2036
- Table 37: South Asia and Pacific Market Value (USD Million) Forecast by Country, 2021 to 2036
- Table 38: South Asia and Pacific Market Value (USD Million) Forecast by Manifold Type, 2021 to 2036
- Table 39: South Asia and Pacific Market Value (USD Million) Forecast by Pressure Rating, 2021 to 2036
- Table 40: South Asia and Pacific Market Value (USD Million) Forecast by Application, 2021 to 2036
- Table 41: South Asia and Pacific Market Value (USD Million) Forecast by End Use, 2021 to 2036
- Table 42: South Asia and Pacific Market Value (USD Million) Forecast by Sales Channel, 2021 to 2036
- Table 43: Middle East and Africa Market Value (USD Million) Forecast by Country, 2021 to 2036
- Table 44: Middle East and Africa Market Value (USD Million) Forecast by Manifold Type, 2021 to 2036
- Table 45: Middle East and Africa Market Value (USD Million) Forecast by Pressure Rating, 2021 to 2036
- Table 46: Middle East and Africa Market Value (USD Million) Forecast by Application, 2021 to 2036
- Table 47: Middle East and Africa Market Value (USD Million) Forecast by End Use, 2021 to 2036
- Table 48: Middle East and Africa Market Value (USD Million) Forecast by Sales Channel, 2021 to 2036
List of Figures
- Figure 1: Global Market Pricing Analysis
- Figure 2: Global Market Value (USD Million) Forecast 2021-2036
- Figure 3: Global Market Value Share and BPS Analysis by Manifold Type, 2026 and 2036
- Figure 4: Global Market Y-o-Y Growth Comparison by Manifold Type, 2026-2036
- Figure 5: Global Market Attractiveness Analysis by Manifold Type
- Figure 6: Global Market Value Share and BPS Analysis by Pressure Rating, 2026 and 2036
- Figure 7: Global Market Y-o-Y Growth Comparison by Pressure Rating, 2026-2036
- Figure 8: Global Market Attractiveness Analysis by Pressure Rating
- Figure 9: Global Market Value Share and BPS Analysis by Application, 2026 and 2036
- Figure 10: Global Market Y-o-Y Growth Comparison by Application, 2026-2036
- Figure 11: Global Market Attractiveness Analysis by Application
- Figure 12: Global Market Value Share and BPS Analysis by End Use, 2026 and 2036
- Figure 13: Global Market Y-o-Y Growth Comparison by End Use, 2026-2036
- Figure 14: Global Market Attractiveness Analysis by End Use
- Figure 15: Global Market Value Share and BPS Analysis by Sales Channel, 2026 and 2036
- Figure 16: Global Market Y-o-Y Growth Comparison by Sales Channel, 2026-2036
- Figure 17: Global Market Attractiveness Analysis by Sales Channel
- Figure 18: Global Market Value (USD Million) Share and BPS Analysis by Region, 2026 and 2036
- Figure 19: Global Market Y-o-Y Growth Comparison by Region, 2026-2036
- Figure 20: Global Market Attractiveness Analysis by Region
- Figure 21: North America Market Incremental Dollar Opportunity, 2026-2036
- Figure 22: Latin America Market Incremental Dollar Opportunity, 2026-2036
- Figure 23: Western Europe Market Incremental Dollar Opportunity, 2026-2036
- Figure 24: Eastern Europe Market Incremental Dollar Opportunity, 2026-2036
- Figure 25: East Asia Market Incremental Dollar Opportunity, 2026-2036
- Figure 26: South Asia and Pacific Market Incremental Dollar Opportunity, 2026-2036
- Figure 27: Middle East and Africa Market Incremental Dollar Opportunity, 2026-2036
- Figure 28: North America Market Value Share and BPS Analysis by Country, 2026 and 2036
- Figure 29: North America Market Value Share and BPS Analysis by Manifold Type, 2026 and 2036
- Figure 30: North America Market Y-o-Y Growth Comparison by Manifold Type, 2026-2036
- Figure 31: North America Market Attractiveness Analysis by Manifold Type
- Figure 32: North America Market Value Share and BPS Analysis by Pressure Rating, 2026 and 2036
- Figure 33: North America Market Y-o-Y Growth Comparison by Pressure Rating, 2026-2036
- Figure 34: North America Market Attractiveness Analysis by Pressure Rating
- Figure 35: North America Market Value Share and BPS Analysis by Application, 2026 and 2036
- Figure 36: North America Market Y-o-Y Growth Comparison by Application, 2026-2036
- Figure 37: North America Market Attractiveness Analysis by Application
- Figure 38: North America Market Value Share and BPS Analysis by End Use, 2026 and 2036
- Figure 39: North America Market Y-o-Y Growth Comparison by End Use, 2026-2036
- Figure 40: North America Market Attractiveness Analysis by End Use
- Figure 41: North America Market Value Share and BPS Analysis by Sales Channel, 2026 and 2036
- Figure 42: North America Market Y-o-Y Growth Comparison by Sales Channel, 2026-2036
- Figure 43: North America Market Attractiveness Analysis by Sales Channel
- Figure 44: Latin America Market Value Share and BPS Analysis by Country, 2026 and 2036
- Figure 45: Latin America Market Value Share and BPS Analysis by Manifold Type, 2026 and 2036
- Figure 46: Latin America Market Y-o-Y Growth Comparison by Manifold Type, 2026-2036
- Figure 47: Latin America Market Attractiveness Analysis by Manifold Type
- Figure 48: Latin America Market Value Share and BPS Analysis by Pressure Rating, 2026 and 2036
- Figure 49: Latin America Market Y-o-Y Growth Comparison by Pressure Rating, 2026-2036
- Figure 50: Latin America Market Attractiveness Analysis by Pressure Rating
- Figure 51: Latin America Market Value Share and BPS Analysis by Application, 2026 and 2036
- Figure 52: Latin America Market Y-o-Y Growth Comparison by Application, 2026-2036
- Figure 53: Latin America Market Attractiveness Analysis by Application
- Figure 54: Latin America Market Value Share and BPS Analysis by End Use, 2026 and 2036
- Figure 55: Latin America Market Y-o-Y Growth Comparison by End Use, 2026-2036
- Figure 56: Latin America Market Attractiveness Analysis by End Use
- Figure 57: Latin America Market Value Share and BPS Analysis by Sales Channel, 2026 and 2036
- Figure 58: Latin America Market Y-o-Y Growth Comparison by Sales Channel, 2026-2036
- Figure 59: Latin America Market Attractiveness Analysis by Sales Channel
- Figure 60: Western Europe Market Value Share and BPS Analysis by Country, 2026 and 2036
- Figure 61: Western Europe Market Value Share and BPS Analysis by Manifold Type, 2026 and 2036
- Figure 62: Western Europe Market Y-o-Y Growth Comparison by Manifold Type, 2026-2036
- Figure 63: Western Europe Market Attractiveness Analysis by Manifold Type
- Figure 64: Western Europe Market Value Share and BPS Analysis by Pressure Rating, 2026 and 2036
- Figure 65: Western Europe Market Y-o-Y Growth Comparison by Pressure Rating, 2026-2036
- Figure 66: Western Europe Market Attractiveness Analysis by Pressure Rating
- Figure 67: Western Europe Market Value Share and BPS Analysis by Application, 2026 and 2036
- Figure 68: Western Europe Market Y-o-Y Growth Comparison by Application, 2026-2036
- Figure 69: Western Europe Market Attractiveness Analysis by Application
- Figure 70: Western Europe Market Value Share and BPS Analysis by End Use, 2026 and 2036
- Figure 71: Western Europe Market Y-o-Y Growth Comparison by End Use, 2026-2036
- Figure 72: Western Europe Market Attractiveness Analysis by End Use
- Figure 73: Western Europe Market Value Share and BPS Analysis by Sales Channel, 2026 and 2036
- Figure 74: Western Europe Market Y-o-Y Growth Comparison by Sales Channel, 2026-2036
- Figure 75: Western Europe Market Attractiveness Analysis by Sales Channel
- Figure 76: Eastern Europe Market Value Share and BPS Analysis by Country, 2026 and 2036
- Figure 77: Eastern Europe Market Value Share and BPS Analysis by Manifold Type, 2026 and 2036
- Figure 78: Eastern Europe Market Y-o-Y Growth Comparison by Manifold Type, 2026-2036
- Figure 79: Eastern Europe Market Attractiveness Analysis by Manifold Type
- Figure 80: Eastern Europe Market Value Share and BPS Analysis by Pressure Rating, 2026 and 2036
- Figure 81: Eastern Europe Market Y-o-Y Growth Comparison by Pressure Rating, 2026-2036
- Figure 82: Eastern Europe Market Attractiveness Analysis by Pressure Rating
- Figure 83: Eastern Europe Market Value Share and BPS Analysis by Application, 2026 and 2036
- Figure 84: Eastern Europe Market Y-o-Y Growth Comparison by Application, 2026-2036
- Figure 85: Eastern Europe Market Attractiveness Analysis by Application
- Figure 86: Eastern Europe Market Value Share and BPS Analysis by End Use, 2026 and 2036
- Figure 87: Eastern Europe Market Y-o-Y Growth Comparison by End Use, 2026-2036
- Figure 88: Eastern Europe Market Attractiveness Analysis by End Use
- Figure 89: Eastern Europe Market Value Share and BPS Analysis by Sales Channel, 2026 and 2036
- Figure 90: Eastern Europe Market Y-o-Y Growth Comparison by Sales Channel, 2026-2036
- Figure 91: Eastern Europe Market Attractiveness Analysis by Sales Channel
- Figure 92: East Asia Market Value Share and BPS Analysis by Country, 2026 and 2036
- Figure 93: East Asia Market Value Share and BPS Analysis by Manifold Type, 2026 and 2036
- Figure 94: East Asia Market Y-o-Y Growth Comparison by Manifold Type, 2026-2036
- Figure 95: East Asia Market Attractiveness Analysis by Manifold Type
- Figure 96: East Asia Market Value Share and BPS Analysis by Pressure Rating, 2026 and 2036
- Figure 97: East Asia Market Y-o-Y Growth Comparison by Pressure Rating, 2026-2036
- Figure 98: East Asia Market Attractiveness Analysis by Pressure Rating
- Figure 99: East Asia Market Value Share and BPS Analysis by Application, 2026 and 2036
- Figure 100: East Asia Market Y-o-Y Growth Comparison by Application, 2026-2036
- Figure 101: East Asia Market Attractiveness Analysis by Application
- Figure 102: East Asia Market Value Share and BPS Analysis by End Use, 2026 and 2036
- Figure 103: East Asia Market Y-o-Y Growth Comparison by End Use, 2026-2036
- Figure 104: East Asia Market Attractiveness Analysis by End Use
- Figure 105: East Asia Market Value Share and BPS Analysis by Sales Channel, 2026 and 2036
- Figure 106: East Asia Market Y-o-Y Growth Comparison by Sales Channel, 2026-2036
- Figure 107: East Asia Market Attractiveness Analysis by Sales Channel
- Figure 108: South Asia and Pacific Market Value Share and BPS Analysis by Country, 2026 and 2036
- Figure 109: South Asia and Pacific Market Value Share and BPS Analysis by Manifold Type, 2026 and 2036
- Figure 110: South Asia and Pacific Market Y-o-Y Growth Comparison by Manifold Type, 2026-2036
- Figure 111: South Asia and Pacific Market Attractiveness Analysis by Manifold Type
- Figure 112: South Asia and Pacific Market Value Share and BPS Analysis by Pressure Rating, 2026 and 2036
- Figure 113: South Asia and Pacific Market Y-o-Y Growth Comparison by Pressure Rating, 2026-2036
- Figure 114: South Asia and Pacific Market Attractiveness Analysis by Pressure Rating
- Figure 115: South Asia and Pacific Market Value Share and BPS Analysis by Application, 2026 and 2036
- Figure 116: South Asia and Pacific Market Y-o-Y Growth Comparison by Application, 2026-2036
- Figure 117: South Asia and Pacific Market Attractiveness Analysis by Application
- Figure 118: South Asia and Pacific Market Value Share and BPS Analysis by End Use, 2026 and 2036
- Figure 119: South Asia and Pacific Market Y-o-Y Growth Comparison by End Use, 2026-2036
- Figure 120: South Asia and Pacific Market Attractiveness Analysis by End Use
- Figure 121: South Asia and Pacific Market Value Share and BPS Analysis by Sales Channel, 2026 and 2036
- Figure 122: South Asia and Pacific Market Y-o-Y Growth Comparison by Sales Channel, 2026-2036
- Figure 123: South Asia and Pacific Market Attractiveness Analysis by Sales Channel
- Figure 124: Middle East and Africa Market Value Share and BPS Analysis by Country, 2026 and 2036
- Figure 125: Middle East and Africa Market Value Share and BPS Analysis by Manifold Type, 2026 and 2036
- Figure 126: Middle East and Africa Market Y-o-Y Growth Comparison by Manifold Type, 2026-2036
- Figure 127: Middle East and Africa Market Attractiveness Analysis by Manifold Type
- Figure 128: Middle East and Africa Market Value Share and BPS Analysis by Pressure Rating, 2026 and 2036
- Figure 129: Middle East and Africa Market Y-o-Y Growth Comparison by Pressure Rating, 2026-2036
- Figure 130: Middle East and Africa Market Attractiveness Analysis by Pressure Rating
- Figure 131: Middle East and Africa Market Value Share and BPS Analysis by Application, 2026 and 2036
- Figure 132: Middle East and Africa Market Y-o-Y Growth Comparison by Application, 2026-2036
- Figure 133: Middle East and Africa Market Attractiveness Analysis by Application
- Figure 134: Middle East and Africa Market Value Share and BPS Analysis by End Use, 2026 and 2036
- Figure 135: Middle East and Africa Market Y-o-Y Growth Comparison by End Use, 2026-2036
- Figure 136: Middle East and Africa Market Attractiveness Analysis by End Use
- Figure 137: Middle East and Africa Market Value Share and BPS Analysis by Sales Channel, 2026 and 2036
- Figure 138: Middle East and Africa Market Y-o-Y Growth Comparison by Sales Channel, 2026-2036
- Figure 139: Middle East and Africa Market Attractiveness Analysis by Sales Channel
- Figure 140: Global Market - Tier Structure Analysis
- Figure 141: Global Market - Company Share Analysis
Frequently Asked Questions
What is driving growth in the Surface Well Test Manifolds Market?
Growth is supported by exploration, appraisal and flowback programs that require a controlled surface route for produced fluids. Orders rise when existing test fleets cannot cover the required pressure class or mobilization schedule.
What is the Surface Well Test Manifolds Market size in 2026?
The market is estimated at USD 720.7 million in 2026 and is forecast to reach USD 1,185.2 million by 2036 at a 5.1% CAGR.
Which Manifold Type leads the market?
Choke manifolds are projected to lead Manifold Type with a 29.0% share in 2026 because pressure reduction and flow regulation are fundamental to surface test operations.
Which Application leads demand?
Surface well testing is estimated to account for 33.0% of Application revenue in 2026. The manifold is integrated into the main test spread before measurement and separation equipment.
Which countries record higher growth rates?
UAE is projected to grow at 5.9% CAGR through 2036, followed by KSA at 5.6% and Brazil at 5.1%.
What should procurement teams evaluate before buying a surface well test manifold?
Procurement teams should match working pressure to the expected well envelope and assess choke serviceability. Shutdown integration and fluid compatibility also affect suitability. For reusable fleets, recertification turnaround and access to replacement components influence lifecycle economics.
Preview the report firsthand - request a free sample
Get SampleGet the brochure for pricing and purchase details.
Get PDF
