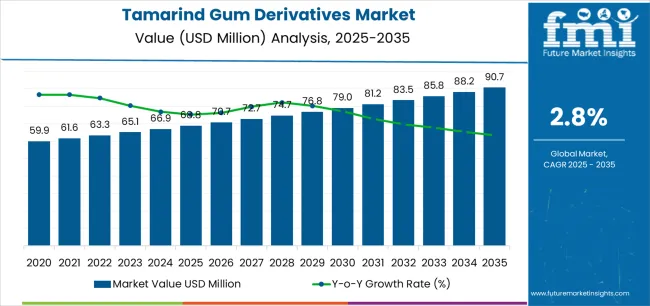
The tamarind gum derivatives market's trajectory from USD 68.8 million in 2025 to USD 90.7 million by 2035 represents steady expansion, demonstrating consistent adoption of natural gum technologies and growing investment in specialty chemical applications across food processing companies, textile manufacturers, and cosmetics firms worldwide.
The market operates within a dynamic landscape characterized by expanding industrial applications, natural ingredient preferences, and growing demand for multifunctional gum derivatives across food processing, textile manufacturing, and personal care applications. Market dynamics reflect increasing investment in natural ingredient research, accelerating adoption of plant-based chemical solutions, and rising demand for versatile gum derivatives that support diverse industrial formulations and processing methodologies.
Industrial procurement patterns demonstrate shifting preferences toward multi-functional gum derivative systems that combine thickening properties, stabilization capabilities, and processing enhancement features. Food manufacturers and textile companies prioritize ingredient reliability, performance consistency, and regulatory compliance when selecting gum derivatives for critical applications including food stabilization, textile printing, fabric finishing, and cosmetic formulation procedures.
The market benefits from expanding research and development activities across food technology, textile processing, and cosmetics sectors, driving demand for sophisticated natural ingredients that enable complex formulation procedures. Growing emphasis on clean label products and natural ingredient sourcing creates opportunities for manufacturers offering validated gum derivative systems with comprehensive documentation and quality assurance capabilities.
Technology advancement influences market evolution through integration of modified gum structures, enhanced solubility properties, and improved functional characteristics that improve processing efficiency and product performance outcomes. Manufacturers focus on developing gum derivative solutions that accommodate varying viscosity requirements, pH stability ranges, and processing parameters while maintaining precise functional control throughout extended storage periods.
The tamarind gum derivatives market demonstrates solid growth fundamentals driven by expanding industrial applications, natural ingredient adoption, and increasing demand for plant-based chemical solutions across multiple manufacturing disciplines and commercial applications.
The first half of the decade (2025-2030) will witness market growth from USD 68.8 million to approximately USD 78.3 million, adding USD 9.5 million in value, representing 43% of the total forecast period expansion. This phase will be characterized by rapid adoption of modified gum derivatives, driven by clean label initiatives and increasing demand for natural thickening solutions across industrial applications.
The latter half (2030-2035) will experience steady growth from USD 78.3 million to USD 90.7 million, representing an addition of USD 12.4 million or 57% of the decade's expansion. This period will be defined by mass market penetration of specialized tamarind gum derivative technologies, integration with automated processing systems, and enhanced compatibility with existing manufacturing infrastructure.
| Period | Primary Revenue Buckets | Share | Notes |
|---|---|---|---|
| Today | Carboxymethyl Tamarind Gum (CMT) | 42% | Traditional applications, food industry |
| Hydroxypropyl Tamarind Gum (HPTG) | 31% | Textile applications, specialized uses | |
| Oxidized Tamarind Gum | 18% | Cosmetics, personal care products | |
| Others | 9% | Emerging applications, research | |
| Future (3-5 yrs) | Enhanced CMT systems | 38-41% | Modified structures, improved solubility |
| Advanced HPTG solutions | 28-32% | Textile innovations, industrial processing | |
| Specialized oxidized variants | 20-24% | Premium cosmetics, pharmaceutical uses | |
| Food applications | 35-39% | Clean label products, natural thickening | |
| Textile applications | 26-30% | Printing, finishing, processing aids | |
| Cosmetics applications | 22-26% | Personal care, skin care formulations | |
| Other industrial uses | 8-12% | Specialty chemicals, research applications |
| Metric | Value |
|---|---|
| Market Value (2025) | USD 68.8 million |
| Market Forecast (2035) | USD 90.7 million |
| Growth Rate | 2.8% CAGR |
| Leading Type | Carboxymethyl Tamarind Gum (CMT) |
| Primary Application | Food Segment |
The market demonstrates steady fundamentals with carboxymethyl tamarind gum systems capturing dominant share through proven thickening properties and food application optimization. Food applications drive primary demand, supported by increasing clean label requirements and natural ingredient adoption initiatives. Geographic distribution remains concentrated in developing markets with established tamarind cultivation, while developed economies show consistent adoption rates driven by natural ingredient preferences and regulatory compliance programs.
Primary Classification: The market segments by type into carboxymethyl tamarind gum, hydroxypropyl tamarind gum, oxidized tamarind gum, and others, representing evolution from basic tamarind gum to sophisticated chemically modified derivatives for comprehensive industrial application optimization.
Secondary Classification: Application segmentation divides the market into food, textile, cosmetics and personal care, and others, reflecting distinct requirements for viscosity control, processing compatibility, and regulatory compliance specifications.
Tertiary Classification: End-use segmentation covers food manufacturers, textile processors, cosmetics companies, pharmaceutical firms, and specialty chemical producers, while distribution channels span direct sales, specialty chemical distributors, and industrial ingredient suppliers.
Regional Classification: Geographic distribution covers China, India, Germany, Brazil, United States, United Kingdom, and Japan, with developing markets leading production while developed economies show strong consumption patterns driven by natural ingredient adoption programs.
The segmentation structure reveals technology progression from traditional tamarind gum toward sophisticated chemically modified derivatives with enhanced functional capabilities, while application diversity spans from basic thickening to specialized processing enhancement requiring precise performance control solutions.
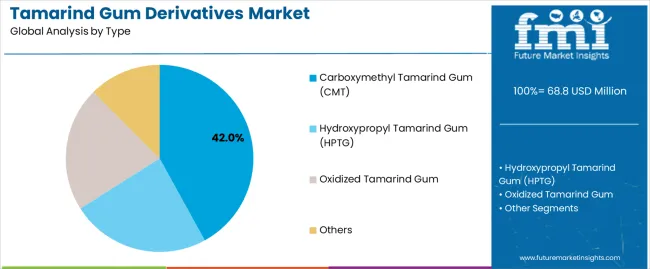
Market Position: Carboxymethyl tamarind gum systems command the leading position in the tamarind gum derivatives market with 42% market share through proven thickening technologies, including enhanced water solubility, reliable viscosity control, and food application optimization that enable manufacturers to achieve optimal processing conditions across diverse food and industrial environments.
Value Drivers: The segment benefits from food industry preference for natural thickening systems that provide consistent viscosity control, processing reliability, and regulatory compliance without requiring synthetic alternatives. Advanced CMT processing features enable enhanced solubility characteristics, precise viscosity control, and integration with existing food systems, where product stability and processing reliability represent critical operational requirements.
Competitive Advantages: Carboxymethyl tamarind gum systems differentiate through proven processing reliability, natural ingredient credentials, and integration with established food manufacturing systems that enhance product effectiveness while maintaining optimal quality standards suitable for diverse food applications.
Key market characteristics:
Hydroxypropyl tamarind gum maintains a 31% market position in the tamarind gum derivatives market due to specialized textile processing advantages and industrial application benefits. These derivatives appeal to facilities requiring enhanced processing compatibility with improved stability profiles for textile manufacturing operations. Market growth is driven by textile industry expansion, emphasizing natural processing aids and operational excellence through optimized fabric treatment designs.
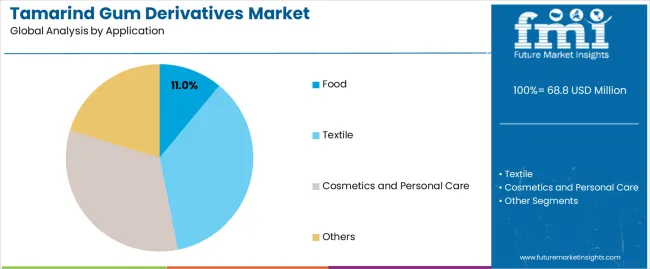
Market Context: Food applications demonstrate solid performance in the tamarind gum derivatives market with 3.2% CAGR due to widespread adoption of natural thickening technologies and increasing focus on clean label products, natural stabilizers, and food safety applications that maximize processing effectiveness while maintaining product quality standards.
Appeal Factors: Food manufacturers prioritize ingredient reliability, regulatory compliance, and integration with existing processing infrastructure that enables coordinated production procedures across multiple product formulations. The segment benefits from substantial clean label investment and natural ingredient development programs that emphasize acquisition of plant-based thickening systems for food processing optimization and quality enhancement applications.
Growth Drivers: Clean label initiatives incorporate tamarind gum derivatives as essential components for natural thickening operations, while food safety requirements increase demand for natural ingredients that comply with regulatory standards and minimize processing variability.
Market Challenges: Varying food formulations and processing complexity may limit ingredient standardization across different manufacturing facilities or product categories.
Application dynamics include:
Textile applications capture 28% market share through fabric processing requirements in textile mills, printing facilities, and finishing operations. These facilities demand high-performance gum derivatives capable of supporting textile protocols while providing processing reliability and operational consistency capabilities.
Cosmetics and personal care applications account for 24% market share, including skin care formulations, hair care products, and specialty cosmetic applications requiring natural thickening capabilities for product development and quality optimization.
Market Context: Food Manufacturers dominate the market with 3.1% CAGR, reflecting the primary demand source for tamarind gum derivative technology in food processing and product optimization.
Business Model Advantages: Food Manufacturers provide direct market demand for standardized gum derivative systems, driving volume production and cost optimization while maintaining quality control and performance consistency requirements.
Operational Benefits: Food Manufacturer applications include processing optimization, product consistency, and quality assurance that drive steady demand for gum derivative systems while providing access to latest natural ingredient technologies.
| Category | Factor | Impact | Why It Matters |
|---|---|---|---|
| Driver | Clean label movement & natural ingredient demand (consumer preferences, regulatory compliance) | ★★★★★ | Growing natural ingredient market requires plant-based thickening systems with enhanced processing capabilities and functional properties proven effective across food applications. |
| Driver | Industrial processing advancement & textile innovation (fabric treatment, printing technology) | ★★★★☆ | Transforms processing requirements from "basic thickening" to "specialized functional enhancement"; manufacturers that offer advanced gum derivatives and processing features gain competitive advantage. |
| Driver | Food safety regulations & quality standards (manufacturing compliance, product consistency) | ★★★★☆ | Modern food facilities need reliable, documented natural ingredients; demand for validated and traceable gum derivatives expanding addressable market. |
| Restraint | Raw material availability & price volatility (tamarind supply, seasonal variations) | ★★★★☆ | Limited tamarind cultivation regions create supply constraints; increases price sensitivity and affects derivative production consistency in global markets. |
| Restraint | Synthetic alternative competition (chemical thickeners, modified starches) | ★★★☆☆ | Synthetic alternatives offer cost advantages and established supply chains, potentially limiting natural gum derivative adoption in price-sensitive applications. |
| Trend | Chemical modification advancement & functional enhancement (improved solubility, stability optimization) | ★★★★★ | Advanced modification properties, processing optimization, and performance analytics transform operations; technology integration and functional enhancement become core value propositions. |
| Trend | Application diversification & specialty uses (pharmaceutical, biotechnology applications) | ★★★★☆ | Specialized gum derivatives for specific applications and protocols; targeted modification and customized functionality drive competition toward application-specific solutions. |
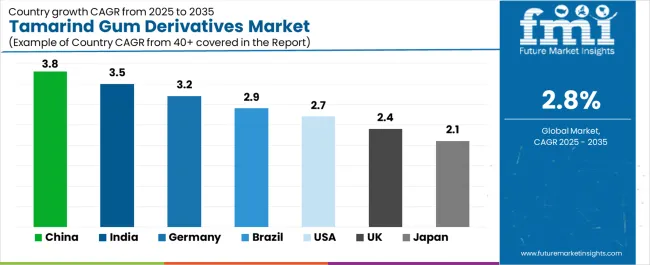
The tamarind gum derivatives market demonstrates varied regional dynamics with Growth Leaders including China (3.8% growth rate) and India (3.5% growth rate) driving expansion through natural ingredient adoption and industrial manufacturing development. Steady Performers encompass Germany (3.2% growth rate), Brazil (2.9% growth rate), and developed regions, benefiting from established processing facilities and clean label market growth. Mature Markets feature United States (2.7% growth rate), United Kingdom (2.4% growth rate), and Japan (2.1% growth rate), where natural ingredient requirements and food safety standards support consistent growth patterns.
Regional synthesis reveals Asian markets leading production through tamarind cultivation advantages and processing capabilities, while European countries maintain steady expansion supported by natural ingredient preferences and regulatory compliance requirements. North American markets show consistent growth driven by clean label initiatives and natural ingredient adoption trends.
| Region/Country | 2025-2035 Growth | How to win | What to watch out |
|---|---|---|---|
| China | 3.8% | Focus on industrial processing solutions | Supply chain disruptions; quality standards |
| India | 3.5% | Lead with raw material advantages | Export restrictions; processing capacity |
| Germany | 3.2% | Provide premium natural ingredients | Regulatory compliance; certification costs |
| Brazil | 2.9% | Offer cost-effective solutions | Currency fluctuations; import dependencies |
| United States | 2.7% | Push clean label applications | FDA compliance; consumer preferences |
| United Kingdom | 2.4% | Focus on specialty applications | Brexit impacts; import regulations |
| Japan | 2.1% | Emphasize quality and functionality | Traditional preferences; price sensitivity |
China establishes production leadership through comprehensive industrial processing capabilities and extensive manufacturing infrastructure, integrating tamarind gum derivative systems as standard components in food processing and textile manufacturing facilities. The country's 3.8% growth rate reflects government initiatives promoting natural ingredient processing and domestic manufacturing capabilities that support use of plant-based derivatives in industrial and food applications. Growth concentrates in major manufacturing regions, including Guangdong, Jiangsu, and Shandong, where industrial development showcases integrated processing systems that appeal to manufacturers seeking cost-effective capabilities and industrial applications.
Chinese manufacturers are developing competitively priced gum derivative solutions that combine domestic processing advantages with functional modification features, including enhanced solubility properties and improved performance capabilities. Distribution channels through industrial chemical suppliers and food ingredient distributors expand market access, while manufacturing infrastructure supports production across diverse industrial and food processing segments.
Strategic Market Indicators:
In Maharashtra, Tamil Nadu, and Karnataka, processing facilities and food manufacturers are implementing tamarind gum derivative systems as standard ingredients for food processing optimization and industrial applications, driven by increasing domestic food industry growth and natural ingredient development programs that emphasize importance of plant-based processing capabilities. The market holds a 3.5% growth rate, supported by government agricultural initiatives and processing modernization programs that promote natural ingredient systems for food and industrial facilities. Indian operators are adopting gum derivative systems that provide consistent processing performance and quality features, particularly appealing in regions where food processing optimization and industrial efficiency represent critical manufacturing requirements.
Market expansion benefits from growing food processing capabilities and agricultural development partnerships that enable domestic production of natural gum derivatives for food and industrial applications. Technology adoption follows patterns established in food ingredients, where functionality and cost-effectiveness drive procurement decisions and operational deployment.
Market Intelligence Brief:
Germany's advanced food market demonstrates sophisticated tamarind gum derivative deployment with documented processing effectiveness in food applications and industrial facilities through integration with existing manufacturing systems and quality infrastructure. The country leverages engineering expertise in food technologies and natural ingredient processing to maintain a 3.2% growth rate. Food processing centers, including Bavaria, North Rhine-Westphalia, and Baden-Württemberg, showcase premium installations where gum derivative systems integrate with comprehensive food processing platforms and quality management systems to optimize manufacturing efficiency and product effectiveness.
German manufacturers prioritize ingredient quality and EU compliance in food development, creating demand for premium systems with advanced features, including processing integration and quality management systems. The market benefits from established food processing infrastructure and willingness to invest in natural ingredient technologies that provide long-term operational benefits and compliance with international food safety standards.
Market Intelligence Brief:
Brazil's market expansion benefits from diverse food processing demand, including natural ingredient adoption in São Paulo and Rio de Janeiro, food facility modernization, and government agricultural programs that increasingly incorporate natural gum derivatives for food processing applications. The country maintains a 2.9% growth rate, driven by rising food industry activity and increasing recognition of natural ingredient benefits, including processing effectiveness and enhanced product quality.
Market dynamics focus on cost-effective gum derivative solutions that balance processing performance with affordability considerations important to Brazilian food manufacturers. Growing food industrialization creates continued demand for natural ingredient systems in new processing infrastructure and facility modernization projects.
Strategic Market Considerations:
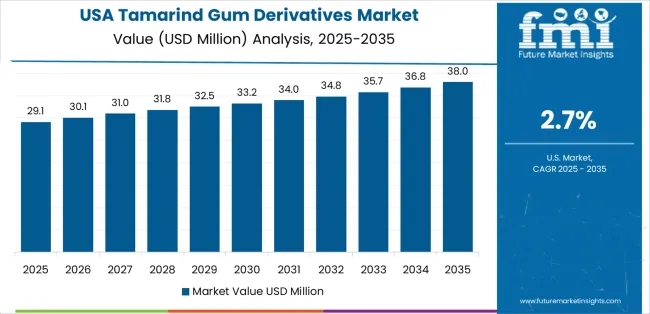
United States establishes clean label leadership through comprehensive food safety programs and advanced food processing infrastructure development, integrating tamarind gum derivative systems across food manufacturing and specialty applications. The country's 2.7% growth rate reflects established food industry relationships and mature natural ingredient adoption that supports widespread use of plant-based thickening systems in food processing and manufacturing facilities. Growth concentrates in major food processing regions, including California, Illinois, and New York, where food technology showcases mature deployment that appeals to manufacturers seeking proven natural capabilities and processing optimization applications.
American food providers leverage established distribution networks and comprehensive technical support capabilities, including formulation design programs and application support that create customer relationships and operational advantages. The market benefits from mature regulatory standards and food safety requirements that support natural ingredient use while promoting technology advancement and processing optimization.
Market Intelligence Brief:
United Kingdom's food market demonstrates integrated tamarind gum derivative deployment with documented processing effectiveness in food applications and specialty facilities through integration with existing manufacturing systems and quality infrastructure. The country maintains a 2.4% growth rate, supported by clean label programs and natural ingredient requirements that promote plant-based gum derivatives for food applications. Food facilities across England, Scotland, and Wales showcase systematic installations where gum derivative systems integrate with comprehensive food processing platforms to optimize quality and processing outcomes.
UK food providers prioritize ingredient reliability and food safety compatibility in gum derivative procurement, creating demand for validated systems with proven functional features, including performance monitoring integration and quality management systems. The market benefits from established food processing infrastructure and quality requirements that support natural ingredient adoption and processing effectiveness.
Market Intelligence Brief:
Japan's market growth benefits from precision food processing demand, including advanced food technology facilities in Tokyo and Osaka, quality integration, and processing enhancement programs that increasingly incorporate gum derivative solutions for food applications. The country maintains a 2.1% growth rate, driven by food technology advancement and increasing recognition of natural ingredient benefits, including accurate processing control and enhanced product outcomes.
Market dynamics focus on high-quality gum derivative solutions that meet Japanese quality standards and processing effectiveness requirements important to food manufacturers. Advanced food technology adoption creates continued demand for specialized gum derivative systems in food processing infrastructure and manufacturing modernization projects.
Strategic Market Considerations:
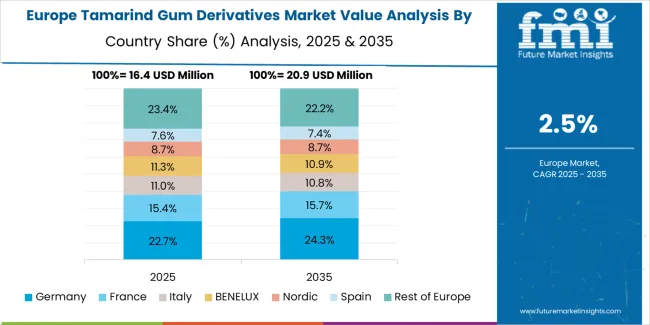
The European tamarind gum derivatives market is projected to grow from USD 17.8 million in 2025 to USD 22.4 million by 2035, registering a CAGR of 2.3% over the forecast period. Germany is expected to maintain its leadership position with a 38.2% market share in 2025, supported by its advanced food processing infrastructure and major ingredient manufacturing centers.
United Kingdom follows with a 24.7% share in 2025, driven by comprehensive clean label programs and natural ingredient development initiatives. France holds a 16.8% share through specialized food applications and regulatory compliance requirements. Italy commands a 11.3% share, while Spain accounts for 6.2% in 2025. The rest of Europe region is anticipated to gain momentum, expanding its collective share from 2.8% to 3.1% by 2035, attributed to increasing natural ingredient adoption in Nordic countries and emerging food facilities implementing clean label modernization programs.
| Stakeholder | What they actually control | Typical strengths | Typical blind spots |
|---|---|---|---|
| Global brands | Distribution networks, broad product portfolios, brand recognition | Wide availability, proven functionality, multi-region support | Product innovation cycles; customer dependency on price validation |
| Technology innovators | Modification R&D; advanced processing technologies; enhanced functional properties | Latest technologies first; attractive ROI on processing effectiveness | Service density outside core regions; scaling complexity |
| Regional specialists | Local supply chains, fast delivery, nearby customer support | "Close to customer" support; pragmatic pricing; local regulations | Technology gaps; talent retention in customer service |
| Full-service providers | Complete ingredient programs, application integration, technical monitoring | Lowest operational risk; comprehensive support | Service costs if overpromised; technology obsolescence |
| Niche specialists | Specialized applications, custom modifications, research services | Win premium applications; flexible formulations | Scalability limitations; narrow market focus |
| Item | Value |
|---|---|
| Quantitative Units | USD 68.8 million |
| Type | Carboxymethyl Tamarind Gum (CMT), Hydroxypropyl Tamarind Gum (HPTG), Oxidized Tamarind Gum, Others |
| Application | Food, Textile, Cosmetics and Personal Care, Others |
| End Use | Food Manufacturers, Textile Processors, Cosmetics Companies, Pharmaceutical Firms, Specialty Chemical Producers |
| Regions Covered | China, India, Germany, Brazil, United States, United Kingdom, Japan |
| Countries Covered | China, India, Germany, Brazil, United States, United Kingdom, Japan, and 15+ additional countries |
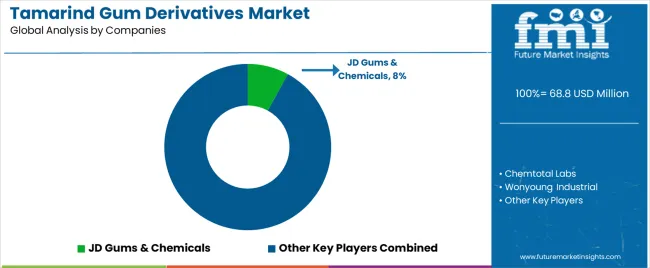
| Key Companies Profiled | JD Gums & Chemicals, Chemtotal Labs, Wonyoung Industrial, Adachi Group, Lucid Colloids, Indian Hydrocolloids, Socius Ingredients, Meckoni Impex |
| Additional Attributes | Dollar sales by type and application categories, regional adoption trends across China, India, and Germany, competitive landscape with natural ingredient manufacturers and specialty chemical suppliers, food manufacturer preferences for processing effectiveness and functional control, integration with food processing platforms and quality management systems, innovations in gum modification technology and functional enhancement, and development of advanced gum derivative solutions with enhanced performance and application optimization capabilities. |
The global tamarind gum derivatives market is estimated to be valued at USD 68.8 million in 2025.
The market size for the tamarind gum derivatives market is projected to reach USD 90.7 million by 2035.
The tamarind gum derivatives market is expected to grow at a 2.8% CAGR between 2025 and 2035.
The key product types in tamarind gum derivatives market are carboxymethyl tamarind gum (cmt), hydroxypropyl tamarind gum (hptg), oxidized tamarind gum and others.
In terms of application, food segment to command 0.0% share in the tamarind gum derivatives market in 2025.


Full Research Suite comprises of:
Market outlook & trends analysis
Interviews & case studies
Strategic recommendations
Vendor profiles & capabilities analysis
5-year forecasts
8 regions and 60+ country-level data splits
Market segment data splits
12 months of continuous data updates
DELIVERED AS:
PDF EXCEL ONLINE
Tamarind Extract Market Analysis – Trends & Forecast 2024-2034
Carboxymethyl Tamarind Gum (CMT) Market Size and Share Forecast Outlook 2025 to 2035
Gummed Tape Market Size and Share Forecast Outlook 2025 to 2035
Gummy Supplements Market Size and Share Forecast Outlook 2025 to 2035
Gum Arabic Market Analysis – Size, Share, and Forecast Outlook 2025 to 2035
Gummy Market Analysis by Product, Ingredient, End-Use, Distribution Channel, and Region - Forecast through 2025 to 2035
Gum Turpentine Oil Market Growth - Trends & Forecast 2025 to 2035
Gum Hydrocolloid Market Analysis by Product Type, Source, and Region through 2035
Key Companies & Market Share in the Gummed Tape Sector
Evaluating Gum Fiber Market Share & Provider Insights
Gum Rosin Market Size & Demand Analysis 2024-2034
Gum Content Tester Market
CBD Gummies Market Analysis - Size, Share and Forecast Outlook 2025 to 2035
Pre-Gummed Labels Market Growth - Demand & Forecast 2025 to 2035
Tara Gum Market Size and Share Forecast Outlook 2025 to 2035
Guar Gum Market Growth & Demand Forecast 2024-2034
Sleep Gummy Market Analysis by Primary Ingredient, Customer Orientation, Pack Size and Product Claim Through 2035
Paper Gummed Tape Market Growth - Demand & Forecast 2025 to 2035
CoQ10 Gummies Market Analysis by Source, Distribution Channels, and Key Regions Through 2035
Ester Gums Market Growth – Trends & Forecast 2025 to 2035

Thank you!
You will receive an email from our Business Development Manager. Please be sure to check your SPAM/JUNK folder too.
Chat With
MaRIA