Tension Control Market Size and Share Forecast Outlook (2024 to 2034)

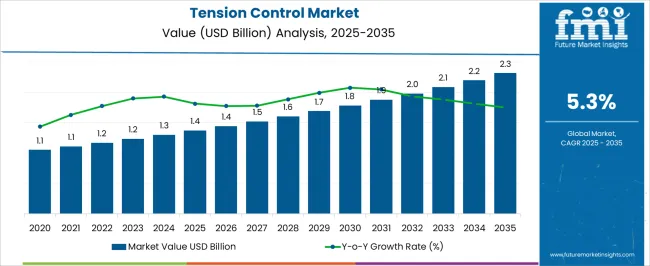
The tension control market had an estimated market share worth USD 1.2 billion in 2023, and it is predicted to reach a global market valuation of USD 2.2 billion by 2034, growing at a steady CAGR of 5.4% from 2024 to 2034.

The market is driven by sustainability efforts, Industry 4.0 integration, and rising need for precise manufacturing. The use of tension control systems is further fueled by technological advancements and government assistance, guaranteeing eco-friendliness, competitiveness, and efficiency across a range of sectors and supporting the steady market growth.

Sales Analysis of Tension Control Systems

  • Advanced tension control systems are becoming more and more necessary to improve production processes. This is due to the industry 4.0 concepts, which incorporate smart technology and data analytics, are adopted globally.
  • Tension control systems are essential for improving the sustainability and efficiency of industrial processes as the world moves toward more sustainable practices. This helps to drive the expansion of the worldwide market.
  • Due to their investments in modern manufacturing technologies, emerging nations with growing industrial sectors-like those involved in the Belt and Road Initiative-significantly contribute to the growth of the global tension control market.
  • Global research and development efforts are constantly pushing the boundaries of technology, improving the functionality and application of tension control systems and promoting international market growth.
Report Attribute Details
Estimated Market Value in 2023 USD 1.2 billion
Expected Market Value in 2024 USD 1.3 billion
Projected Forecast Value in 2034 USD 2.2 billion
Anticipated Growth Rate from 2024 to 2034 5.4%

Sales Analysis of Tension Control Systems (2019 to 2023) vs Forecast (2024 to 2034)

The global demand for tension control market was estimated to reach a global market valuation of USD 882 million in 2019, according to a report from Future Market Insights. From 2019 to 2023, sales witnessed significant growth in the tension control market, registering a CAGR of 6.9%.

Historical CAGR from 2019 to 2023 6.9%
Forecast CAGR from 2024 to 2034 5.4%

With the incorporation of smart technology, Industry 4.0 principles, and an emphasis on sustainable production, the tension control market is changing quickly.

The market expansion is driven by global industrialization trends and ongoing breakthroughs in precision engineering, which provide eco-friendly, automated, and highly efficient solutions for a variety of manufacturing industries. Some important factors that will boost the market growth through 2034 are:

  • Data-driven processes and smart manufacturing will push the need for advanced tension control systems.
  • Global efforts to promote sustainability will increase demand for tension control in environmentally friendly production.
  • Prolonged digitization initiatives will accelerate the worldwide use of advanced tension control technologies.
  • Tension control system demand will rise as long as industries continue to develop, particularly in emerging regions.

Due to these favorable factors, which set the market up for long-term growth, it is imperative for players to maintain both their strategic and tactical flexibility during the projection period.

Key Growth Drivers Accelerating the Tension Control Market

Demand for Industry 4.0 Integration to Enhance Market Growth

The market for tension control is mostly driven by the growing need for solutions led by Industry 4.0. The use of automation, data analytics, and smart technology is becoming essential as industrial processes become more complex.

The accuracy and real-time monitoring provided by tension control systems make them ideal for Industry 4.0, which is why they are so widely used. Tension control systems are now positioned as essential parts of the growing field of smart and connected manufacturing processes, which also improves production efficiency.

Eco-friendly and Sustainable manufacturing Practices to Accelerate Market Growth

The market for tension control is also being driven by the increasing focus on sustainability and environmentally friendly production techniques. As environmental problems become more widely recognized, companies are looking for ways to reduce waste, energy use, and environmental effect.

Advanced tension control systems are essential for streamlining manufacturing procedures, cutting down on material waste, and guaranteeing energy-saving operations.

Growing consumer demand for products that support sustainable development objectives is driving the market and encouraging a change to more ecologically friendly and ecologically aware manufacturing techniques.

Key Restraints Hindering Tension Control System Adoption

Technological Complexity to Impede the Global Market Growth

Market growth in the tension control market may be limited due to variables such as high initial investment prices for advanced systems, particularly in emerging markets. Widespread adoption may also be hampered by technological complexity and the unwillingness of existing production systems to change. Obstacles may include inconsistent industry-wide procedures and regulatory issues.

Uncertainty and economic downturns may cause capital expenditures to be postponed, which might have an effect on the potential of the market for development by influencing investment decisions in modern tension control technology.

Analysis of Top Countries Installing, Regulating, and Enhancing Tension Control Technologies

This section focuses on providing in-depth assessments of certain market segments for tension control. The two main areas of analysis will be automated product and load cell.

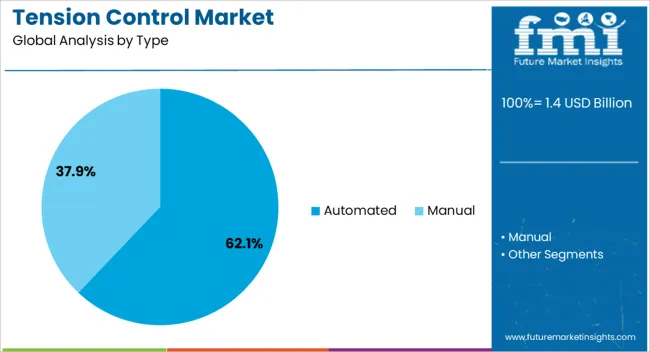
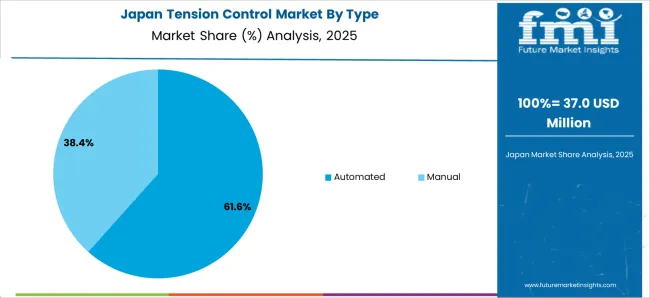
By Product, the Automated Product to Gain a Dominant Market Share in 2024

During the forecast period, the automated product segment is likely to garner a 5.1% CAGR. The potential of automated products to increase productivity and decrease manual intervention makes them a promising category for growth in the global tension control market. Automation guarantees accurate tension management, reducing mistakes and raising the standard of output overall.

Automated tension control systems fit very well with smart production settings, offering real-time data and enabling remote monitoring as more businesses embrace Industry 4.0 techniques. This improves operational effectiveness while also fitting in with the larger trend of linked, modern production, which makes automated tension control solutions the better option in the evolving industrial scene.

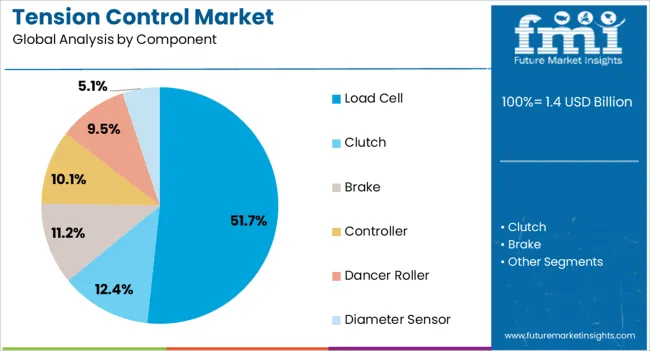
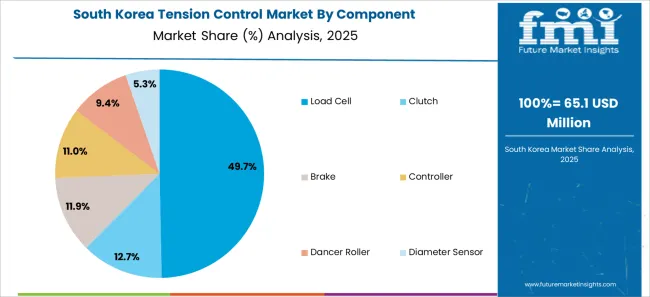
Load Cell Components will Gain Traction during the Forecast Period

In 2023, the load cell segment is likely to have acquired a 51.7% global market share. The precision and accuracy of the load cell component in measuring tension is expected to make it more popular in the tension control industry. Load cells offer real-time data on substance tension, allowing precise control and eliminating product flaws as companies seek for improved quality and efficiency.

Due to its adaptability to a wide range of activities, including production and conversion, load cells are considered indispensable parts. The growing acceptance of load cells in the changing field of tension control solutions is further facilitated by developments in the technology, such as wireless communication and integration with automation systems.
Tension Control Market Analysis by Top Investment Segments

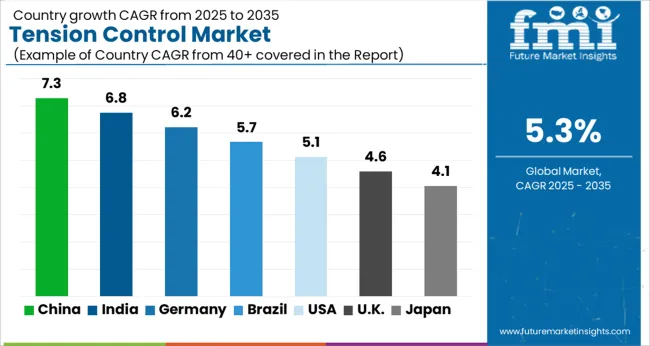
This section will delve into the markets for tension controls in different important countries, such as the United States, the United Kingdom, China, Japan, and South Korea. The section highlights the important factors that are propelling the market in these various spots.

Country CAGR
The United States 5.6%
The United Kingdom 7%
China 6.3%
Japan 4.1%
South Korea 7.6%

Tension Control Industry in the United States

The United States tension control is anticipated to gain a CAGR of 5.6% through 2034. Factors that are boosting the growth are:

  • The resurgence in American manufacturing, fueled by reshoring activities, increases demand for improved tension control systems in a variety of industries.
  • Tension control systems are being more widely used for effective production because of American emphasis on greener and more sustainable manufacturing methods.
  • The United States places a strong focus on industrial innovation, which is consistent with the adoption of state-of-the-art tension control systems that benefit from ongoing technological and automated improvements.

Tension Control Industry in the United Kingdom

The market in the United Kingdom is expected to expand with a 7% CAGR through 2034. The factors pushing the growth are:

  • The commitment of the United Kingdom to renewable energy adoption generates a need for tension control in sustainable manufacturing processes.
  • The United Kingdom is leading the way in using smart tension control systems for increased production efficiency through its adoption of Industry 4.0 technology.
  • The United Kingdom's use of environmentally friendly tension control devices is mostly driven by environmental sustainability objectives.
  • The need for sophisticated tension control solutions in specialized industries is fueled by the United Kingdom's emphasis on precise engineering and high-tech sectors.

Tension Control Industry in China

China tension control ecosystem is anticipated to develop with a 6.3% CAGR from 2024 to 2034. The probable reasons behind this growth are:
  • There is an enormous demand for tension control solutions in a variety of manufacturing industries due to China's explosive industrial expansion.
  • The Belt and Road Initiative, which promotes the construction of infrastructure, fuel the need for sophisticated tension control systems in China.
  • Innovative tension management systems are becoming more and more popular in China owing to significant government expenditures in manufacturing and research.
  • A significant portion of the market is accounted for by China's wide and varied industrial environment, where a number of sectors have adopted tension control for more efficient production methods.

Tension Control Industry in Japan

The tension control industry in Japan is expected to reach a 4.1% CAGR from 2024 to 2034. The reasons accelerating growth are:

  • The need for advanced tension control systems is increased by Japan's emphasis on high-tech sectors and precise manufacturing.
  • Adoption of tension control technology is encouraged by favorable legislation and incentives, which propels market expansion in Japan.
  • Continuous research and development endeavors augment product intricacy, hence augmenting the expansion of the tension control industry in Japan.
  • The adoption of advanced tension control systems is facilitated by the global reach and competitiveness of Japanese enterprises across a range of sectors, both domestically and globally.

Tension Control Industry in South Korea

The South Korea advanced energy storage industry is likely to attain a 7.6% CAGR during the forecast period. The factors boosting the growth are:
  • Adoption is driven by supportive legislation and incentives, resulting in growth in South Korea's tension control market.
  • Continuous research and development activities drive progress, increasing product capabilities and market competitiveness in South Korea.
  • The demand generated by expanding manufacturing sectors drives the overall expansion of the South Korea tension control market.

Competitive Landscape of the Tension Control Industry

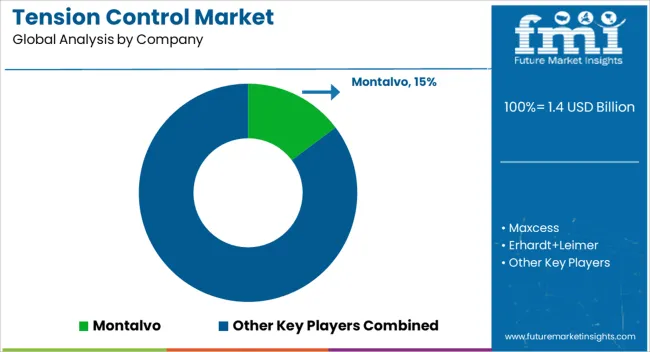
Key companies in the global tension control market are continuously pursuing strategies aimed at promoting innovation and expanding their market share. These businesses make large investments in research and development in order to provide innovative tension control technologies. Partnerships and collaborations are frequent, enabling businesses to expand their product offers and include complimentary technology.

Acquisitions and mergers are common tactics to increase worldwide presence and consolidate market share. Approaches that focus on the needs of the consumer, such offering customized solutions and effective customer service, help businesses stay competitive. All things considered, the major companies in the tension control industry show a dedication to innovation, teamwork, and client pleasure. The key players in this market include:

  • Montalvo (USA)
  • Maxcess (USA)
  • Erhardt+Leimer (Germany)
  • Dover Flexo Electronics (USA)
  • Double E (USA)
  • Nexen (USA)
  • FMS (Switzerland)
  • RE Controlli Industriali (Italy)
  • Nireco (Japan)

Key market participants are making significant advancements in the tension control sector, and these include:

  • In 2023, Maxcess International, a global pioneer in automated web handling solutions, announced the launch of its new state-of-the-art facility just west of Mumbai. The facility will serve the Maxcess portfolio of brands, which includes RotoMetrics, Fife, Tidland, MAGPOWR, Webex, Componex, and Maxcess Vision Systems. It will also contain global R&D resources, a repair center, and administrative offices for the APAC area.

Scope and Coverage of the Tension Control Market Report

Report Attribute Details
Growth Rate CAGR of 5.4% from 2024 to 2034
Market value in 2024 USD 1.3 billion
Market value in 2034 USD 2.2 billion
Base Year for Estimation 2023
Historical Data 2019 to 2023
Forecast Period 2024 to 2034
Quantitative Units USD billion for value
Report Coverage Revenue Forecast, Company Ranking, Competitive Landscape, Growth Factors, Trends, and Pricing Analysis
Segments Covered Type, Component, Application, Region
Region Covered North America; Latin America; Western Europe; Eastern Europe; South Asia and Pacific; East Asia; Middle East & Africa
Countries Profiled United States, Canada, Brazil, Mexico, Germany, United Kingdom, France, Spain, Italy, Poland, Russia, Czech Republic, Romania, India, Bangladesh, Australia, New Zealand, China, Japan, South Korea, GCC Countries, South Africa, Israel
Key Companies Profiled Montalvo (USA); Maxcess (USA); Erhardt+Leimer (Germany); Dover Flexo Electronics (USA); Double E (USA); Nexen (USA); FMS (Switzerland); RE Controlli Industriali (Italy); Nireco (Japan)
Customization Scope Available on Request

Top Segments Studied in the Tension Control Market Survey

By Type:

  • Automated
  • Manual

By Component:

  • Load Cell
  • Clutch
  • Brake
  • Controller
  • Dancer Roller
  • Diameter Sensor

By Application:

  • Flexible Printing
  • Paper
  • Metal & Foil

By Region:

  • North America
  • Latin America
  • Western Europe
  • Eastern Europe
  • South Asia and Pacific
  • East Asia
  • Middle East & Africa

Table of Content

  • 1. Executive Summary
  • 2. Market Overview
  • 3. Market Background
  • 4. Global Market Analysis 2019 to 2023 and Forecast, 2024 to 2034
  • 5. Global Market Analysis 2019 to 2023 and Forecast 2024 to 2034, By Type
    • 5.1. Automated
    • 5.2. Manual
  • 6. Global Market Analysis 2019 to 2023 and Forecast 2024 to 2034, By Component
    • 6.1. Load Cell
    • 6.2. Clutch
    • 6.3. Brake
    • 6.4. Controller
    • 6.5. Dancer Roller
    • 6.6. Diameter Sensor
  • 7. Global Market Analysis 2019 to 2023 and Forecast 2024 to 2034, By Application
    • 7.1. Flexible Printing
    • 7.2. Paper
    • 7.3. Metal & Foil
  • 8. Global Market Analysis 2019 to 2023 and Forecast 2024 to 2034, By Region
    • 8.1. North America
    • 8.2. Latin America
    • 8.3. Western Europe
    • 8.4. Eastern Europe
    • 8.5. South Asia and Pacific
    • 8.6. East Asia
    • 8.7. Middle East and Africa
  • 9. North America Market Analysis 2019 to 2023 and Forecast 2024 to 2034, By Country
  • 10. Latin America Market Analysis 2019 to 2023 and Forecast 2024 to 2034, By Country
  • 11. Western Europe Market Analysis 2019 to 2023 and Forecast 2024 to 2034, By Country
  • 12. Eastern Europe Market Analysis 2019 to 2023 and Forecast 2024 to 2034, By Country
  • 13. South Asia and Pacific Market Analysis 2019 to 2023 and Forecast 2024 to 2034, By Country
  • 14. East Asia Market Analysis 2019 to 2023 and Forecast 2024 to 2034, By Country
  • 15. Middle East and Africa Market Analysis 2019 to 2023 and Forecast 2024 to 2034, By Country
  • 16. Key Countries Market Analysis
  • 17. Market Structure Analysis
  • 18. Competition Analysis
    • 18.1. Montalvo (USA)
    • 18.2. Maxcess (USA)
    • 18.3. Erhardt+Leimer (Germany)
    • 18.4. Dover Flexo Electronics (USA)
    • 18.5. Double E (USA)
    • 18.6. Nexen (USA)
    • 18.7. FMS (Switzerland)
    • 18.8. RE Controlli Industriali (Italy)
    • 18.9. Nireco (Japan)
  • 19. Assumptions & Acronyms Used
  • 20. Research Methodology

List of Tables

Table 1: Global Market Value (US$ Million) Forecast by Region, 2019 to 2034

Table 2: Global Market Volume (Units) Forecast by Region, 2019 to 2034

Table 3: Global Market Value (US$ Million) Forecast by Type, 2019 to 2034

Table 4: Global Market Volume (Units) Forecast by Type, 2019 to 2034

Table 5: Global Market Value (US$ Million) Forecast by Component, 2019 to 2034

Table 6: Global Market Volume (Units) Forecast by Component, 2019 to 2034

Table 7: Global Market Value (US$ Million) Forecast by Application, 2019 to 2034

Table 8: Global Market Volume (Units) Forecast by Application, 2019 to 2034

Table 9: North America Market Value (US$ Million) Forecast by Country, 2019 to 2034

Table 10: North America Market Volume (Units) Forecast by Country, 2019 to 2034

Table 11: North America Market Value (US$ Million) Forecast by Type, 2019 to 2034

Table 12: North America Market Volume (Units) Forecast by Type, 2019 to 2034

Table 13: North America Market Value (US$ Million) Forecast by Component, 2019 to 2034

Table 14: North America Market Volume (Units) Forecast by Component, 2019 to 2034

Table 15: North America Market Value (US$ Million) Forecast by Application, 2019 to 2034

Table 16: North America Market Volume (Units) Forecast by Application, 2019 to 2034

Table 17: Latin America Market Value (US$ Million) Forecast by Country, 2019 to 2034

Table 18: Latin America Market Volume (Units) Forecast by Country, 2019 to 2034

Table 19: Latin America Market Value (US$ Million) Forecast by Type, 2019 to 2034

Table 20: Latin America Market Volume (Units) Forecast by Type, 2019 to 2034

Table 21: Latin America Market Value (US$ Million) Forecast by Component, 2019 to 2034

Table 22: Latin America Market Volume (Units) Forecast by Component, 2019 to 2034

Table 23: Latin America Market Value (US$ Million) Forecast by Application, 2019 to 2034

Table 24: Latin America Market Volume (Units) Forecast by Application, 2019 to 2034

Table 25: Western Europe Market Value (US$ Million) Forecast by Country, 2019 to 2034

Table 26: Western Europe Market Volume (Units) Forecast by Country, 2019 to 2034

Table 27: Western Europe Market Value (US$ Million) Forecast by Type, 2019 to 2034

Table 28: Western Europe Market Volume (Units) Forecast by Type, 2019 to 2034

Table 29: Western Europe Market Value (US$ Million) Forecast by Component, 2019 to 2034

Table 30: Western Europe Market Volume (Units) Forecast by Component, 2019 to 2034

Table 31: Western Europe Market Value (US$ Million) Forecast by Application, 2019 to 2034

Table 32: Western Europe Market Volume (Units) Forecast by Application, 2019 to 2034

Table 33: Eastern Europe Market Value (US$ Million) Forecast by Country, 2019 to 2034

Table 34: Eastern Europe Market Volume (Units) Forecast by Country, 2019 to 2034

Table 35: Eastern Europe Market Value (US$ Million) Forecast by Type, 2019 to 2034

Table 36: Eastern Europe Market Volume (Units) Forecast by Type, 2019 to 2034

Table 37: Eastern Europe Market Value (US$ Million) Forecast by Component, 2019 to 2034

Table 38: Eastern Europe Market Volume (Units) Forecast by Component, 2019 to 2034

Table 39: Eastern Europe Market Value (US$ Million) Forecast by Application, 2019 to 2034

Table 40: Eastern Europe Market Volume (Units) Forecast by Application, 2019 to 2034

Table 41: South Asia and Pacific Market Value (US$ Million) Forecast by Country, 2019 to 2034

Table 42: South Asia and Pacific Market Volume (Units) Forecast by Country, 2019 to 2034

Table 43: South Asia and Pacific Market Value (US$ Million) Forecast by Type, 2019 to 2034

Table 44: South Asia and Pacific Market Volume (Units) Forecast by Type, 2019 to 2034

Table 45: South Asia and Pacific Market Value (US$ Million) Forecast by Component, 2019 to 2034

Table 46: South Asia and Pacific Market Volume (Units) Forecast by Component, 2019 to 2034

Table 47: South Asia and Pacific Market Value (US$ Million) Forecast by Application, 2019 to 2034

Table 48: South Asia and Pacific Market Volume (Units) Forecast by Application, 2019 to 2034

Table 49: East Asia Market Value (US$ Million) Forecast by Country, 2019 to 2034

Table 50: East Asia Market Volume (Units) Forecast by Country, 2019 to 2034

Table 51: East Asia Market Value (US$ Million) Forecast by Type, 2019 to 2034

Table 52: East Asia Market Volume (Units) Forecast by Type, 2019 to 2034

Table 53: East Asia Market Value (US$ Million) Forecast by Component, 2019 to 2034

Table 54: East Asia Market Volume (Units) Forecast by Component, 2019 to 2034

Table 55: East Asia Market Value (US$ Million) Forecast by Application, 2019 to 2034

Table 56: East Asia Market Volume (Units) Forecast by Application, 2019 to 2034

Table 57: Middle East and Africa Market Value (US$ Million) Forecast by Country, 2019 to 2034

Table 58: Middle East and Africa Market Volume (Units) Forecast by Country, 2019 to 2034

Table 59: Middle East and Africa Market Value (US$ Million) Forecast by Type, 2019 to 2034

Table 60: Middle East and Africa Market Volume (Units) Forecast by Type, 2019 to 2034

Table 61: Middle East and Africa Market Value (US$ Million) Forecast by Component, 2019 to 2034

Table 62: Middle East and Africa Market Volume (Units) Forecast by Component, 2019 to 2034

Table 63: Middle East and Africa Market Value (US$ Million) Forecast by Application, 2019 to 2034

Table 64: Middle East and Africa Market Volume (Units) Forecast by Application, 2019 to 2034

List of Figures

Figure 1: Global Market Value (US$ Million) by Type, 2024 to 2034

Figure 2: Global Market Value (US$ Million) by Component, 2024 to 2034

Figure 3: Global Market Value (US$ Million) by Application, 2024 to 2034

Figure 4: Global Market Value (US$ Million) by Region, 2024 to 2034

Figure 5: Global Market Value (US$ Million) Analysis by Region, 2019 to 2034

Figure 6: Global Market Volume (Units) Analysis by Region, 2019 to 2034

Figure 7: Global Market Value Share (%) and BPS Analysis by Region, 2024 to 2034

Figure 8: Global Market Y-o-Y Growth (%) Projections by Region, 2024 to 2034

Figure 9: Global Market Value (US$ Million) Analysis by Type, 2019 to 2034

Figure 10: Global Market Volume (Units) Analysis by Type, 2019 to 2034

Figure 11: Global Market Value Share (%) and BPS Analysis by Type, 2024 to 2034

Figure 12: Global Market Y-o-Y Growth (%) Projections by Type, 2024 to 2034

Figure 13: Global Market Value (US$ Million) Analysis by Component, 2019 to 2034

Figure 14: Global Market Volume (Units) Analysis by Component, 2019 to 2034

Figure 15: Global Market Value Share (%) and BPS Analysis by Component, 2024 to 2034

Figure 16: Global Market Y-o-Y Growth (%) Projections by Component, 2024 to 2034

Figure 17: Global Market Value (US$ Million) Analysis by Application, 2019 to 2034

Figure 18: Global Market Volume (Units) Analysis by Application, 2019 to 2034

Figure 19: Global Market Value Share (%) and BPS Analysis by Application, 2024 to 2034

Figure 20: Global Market Y-o-Y Growth (%) Projections by Application, 2024 to 2034

Figure 21: Global Market Attractiveness by Type, 2024 to 2034

Figure 22: Global Market Attractiveness by Component, 2024 to 2034

Figure 23: Global Market Attractiveness by Application, 2024 to 2034

Figure 24: Global Market Attractiveness by Region, 2024 to 2034

Figure 25: North America Market Value (US$ Million) by Type, 2024 to 2034

Figure 26: North America Market Value (US$ Million) by Component, 2024 to 2034

Figure 27: North America Market Value (US$ Million) by Application, 2024 to 2034

Figure 28: North America Market Value (US$ Million) by Country, 2024 to 2034

Figure 29: North America Market Value (US$ Million) Analysis by Country, 2019 to 2034

Figure 30: North America Market Volume (Units) Analysis by Country, 2019 to 2034

Figure 31: North America Market Value Share (%) and BPS Analysis by Country, 2024 to 2034

Figure 32: North America Market Y-o-Y Growth (%) Projections by Country, 2024 to 2034

Figure 33: North America Market Value (US$ Million) Analysis by Type, 2019 to 2034

Figure 34: North America Market Volume (Units) Analysis by Type, 2019 to 2034

Figure 35: North America Market Value Share (%) and BPS Analysis by Type, 2024 to 2034

Figure 36: North America Market Y-o-Y Growth (%) Projections by Type, 2024 to 2034

Figure 37: North America Market Value (US$ Million) Analysis by Component, 2019 to 2034

Figure 38: North America Market Volume (Units) Analysis by Component, 2019 to 2034

Figure 39: North America Market Value Share (%) and BPS Analysis by Component, 2024 to 2034

Figure 40: North America Market Y-o-Y Growth (%) Projections by Component, 2024 to 2034

Figure 41: North America Market Value (US$ Million) Analysis by Application, 2019 to 2034

Figure 42: North America Market Volume (Units) Analysis by Application, 2019 to 2034

Figure 43: North America Market Value Share (%) and BPS Analysis by Application, 2024 to 2034

Figure 44: North America Market Y-o-Y Growth (%) Projections by Application, 2024 to 2034

Figure 45: North America Market Attractiveness by Type, 2024 to 2034

Figure 46: North America Market Attractiveness by Component, 2024 to 2034

Figure 47: North America Market Attractiveness by Application, 2024 to 2034

Figure 48: North America Market Attractiveness by Country, 2024 to 2034

Figure 49: Latin America Market Value (US$ Million) by Type, 2024 to 2034

Figure 50: Latin America Market Value (US$ Million) by Component, 2024 to 2034

Figure 51: Latin America Market Value (US$ Million) by Application, 2024 to 2034

Figure 52: Latin America Market Value (US$ Million) by Country, 2024 to 2034

Figure 53: Latin America Market Value (US$ Million) Analysis by Country, 2019 to 2034

Figure 54: Latin America Market Volume (Units) Analysis by Country, 2019 to 2034

Figure 55: Latin America Market Value Share (%) and BPS Analysis by Country, 2024 to 2034

Figure 56: Latin America Market Y-o-Y Growth (%) Projections by Country, 2024 to 2034

Figure 57: Latin America Market Value (US$ Million) Analysis by Type, 2019 to 2034

Figure 58: Latin America Market Volume (Units) Analysis by Type, 2019 to 2034

Figure 59: Latin America Market Value Share (%) and BPS Analysis by Type, 2024 to 2034

Figure 60: Latin America Market Y-o-Y Growth (%) Projections by Type, 2024 to 2034

Figure 61: Latin America Market Value (US$ Million) Analysis by Component, 2019 to 2034

Figure 62: Latin America Market Volume (Units) Analysis by Component, 2019 to 2034

Figure 63: Latin America Market Value Share (%) and BPS Analysis by Component, 2024 to 2034

Figure 64: Latin America Market Y-o-Y Growth (%) Projections by Component, 2024 to 2034

Figure 65: Latin America Market Value (US$ Million) Analysis by Application, 2019 to 2034

Figure 66: Latin America Market Volume (Units) Analysis by Application, 2019 to 2034

Figure 67: Latin America Market Value Share (%) and BPS Analysis by Application, 2024 to 2034

Figure 68: Latin America Market Y-o-Y Growth (%) Projections by Application, 2024 to 2034

Figure 69: Latin America Market Attractiveness by Type, 2024 to 2034

Figure 70: Latin America Market Attractiveness by Component, 2024 to 2034

Figure 71: Latin America Market Attractiveness by Application, 2024 to 2034

Figure 72: Latin America Market Attractiveness by Country, 2024 to 2034

Figure 73: Western Europe Market Value (US$ Million) by Type, 2024 to 2034

Figure 74: Western Europe Market Value (US$ Million) by Component, 2024 to 2034

Figure 75: Western Europe Market Value (US$ Million) by Application, 2024 to 2034

Figure 76: Western Europe Market Value (US$ Million) by Country, 2024 to 2034

Figure 77: Western Europe Market Value (US$ Million) Analysis by Country, 2019 to 2034

Figure 78: Western Europe Market Volume (Units) Analysis by Country, 2019 to 2034

Figure 79: Western Europe Market Value Share (%) and BPS Analysis by Country, 2024 to 2034

Figure 80: Western Europe Market Y-o-Y Growth (%) Projections by Country, 2024 to 2034

Figure 81: Western Europe Market Value (US$ Million) Analysis by Type, 2019 to 2034

Figure 82: Western Europe Market Volume (Units) Analysis by Type, 2019 to 2034

Figure 83: Western Europe Market Value Share (%) and BPS Analysis by Type, 2024 to 2034

Figure 84: Western Europe Market Y-o-Y Growth (%) Projections by Type, 2024 to 2034

Figure 85: Western Europe Market Value (US$ Million) Analysis by Component, 2019 to 2034

Figure 86: Western Europe Market Volume (Units) Analysis by Component, 2019 to 2034

Figure 87: Western Europe Market Value Share (%) and BPS Analysis by Component, 2024 to 2034

Figure 88: Western Europe Market Y-o-Y Growth (%) Projections by Component, 2024 to 2034

Figure 89: Western Europe Market Value (US$ Million) Analysis by Application, 2019 to 2034

Figure 90: Western Europe Market Volume (Units) Analysis by Application, 2019 to 2034

Figure 91: Western Europe Market Value Share (%) and BPS Analysis by Application, 2024 to 2034

Figure 92: Western Europe Market Y-o-Y Growth (%) Projections by Application, 2024 to 2034

Figure 93: Western Europe Market Attractiveness by Type, 2024 to 2034

Figure 94: Western Europe Market Attractiveness by Component, 2024 to 2034

Figure 95: Western Europe Market Attractiveness by Application, 2024 to 2034

Figure 96: Western Europe Market Attractiveness by Country, 2024 to 2034

Figure 97: Eastern Europe Market Value (US$ Million) by Type, 2024 to 2034

Figure 98: Eastern Europe Market Value (US$ Million) by Component, 2024 to 2034

Figure 99: Eastern Europe Market Value (US$ Million) by Application, 2024 to 2034

Figure 100: Eastern Europe Market Value (US$ Million) by Country, 2024 to 2034

Figure 101: Eastern Europe Market Value (US$ Million) Analysis by Country, 2019 to 2034

Figure 102: Eastern Europe Market Volume (Units) Analysis by Country, 2019 to 2034

Figure 103: Eastern Europe Market Value Share (%) and BPS Analysis by Country, 2024 to 2034

Figure 104: Eastern Europe Market Y-o-Y Growth (%) Projections by Country, 2024 to 2034

Figure 105: Eastern Europe Market Value (US$ Million) Analysis by Type, 2019 to 2034

Figure 106: Eastern Europe Market Volume (Units) Analysis by Type, 2019 to 2034

Figure 107: Eastern Europe Market Value Share (%) and BPS Analysis by Type, 2024 to 2034

Figure 108: Eastern Europe Market Y-o-Y Growth (%) Projections by Type, 2024 to 2034

Figure 109: Eastern Europe Market Value (US$ Million) Analysis by Component, 2019 to 2034

Figure 110: Eastern Europe Market Volume (Units) Analysis by Component, 2019 to 2034

Figure 111: Eastern Europe Market Value Share (%) and BPS Analysis by Component, 2024 to 2034

Figure 112: Eastern Europe Market Y-o-Y Growth (%) Projections by Component, 2024 to 2034

Figure 113: Eastern Europe Market Value (US$ Million) Analysis by Application, 2019 to 2034

Figure 114: Eastern Europe Market Volume (Units) Analysis by Application, 2019 to 2034

Figure 115: Eastern Europe Market Value Share (%) and BPS Analysis by Application, 2024 to 2034

Figure 116: Eastern Europe Market Y-o-Y Growth (%) Projections by Application, 2024 to 2034

Figure 117: Eastern Europe Market Attractiveness by Type, 2024 to 2034

Figure 118: Eastern Europe Market Attractiveness by Component, 2024 to 2034

Figure 119: Eastern Europe Market Attractiveness by Application, 2024 to 2034

Figure 120: Eastern Europe Market Attractiveness by Country, 2024 to 2034

Figure 121: South Asia and Pacific Market Value (US$ Million) by Type, 2024 to 2034

Figure 122: South Asia and Pacific Market Value (US$ Million) by Component, 2024 to 2034

Figure 123: South Asia and Pacific Market Value (US$ Million) by Application, 2024 to 2034

Figure 124: South Asia and Pacific Market Value (US$ Million) by Country, 2024 to 2034

Figure 125: South Asia and Pacific Market Value (US$ Million) Analysis by Country, 2019 to 2034

Figure 126: South Asia and Pacific Market Volume (Units) Analysis by Country, 2019 to 2034

Figure 127: South Asia and Pacific Market Value Share (%) and BPS Analysis by Country, 2024 to 2034

Figure 128: South Asia and Pacific Market Y-o-Y Growth (%) Projections by Country, 2024 to 2034

Figure 129: South Asia and Pacific Market Value (US$ Million) Analysis by Type, 2019 to 2034

Figure 130: South Asia and Pacific Market Volume (Units) Analysis by Type, 2019 to 2034

Figure 131: South Asia and Pacific Market Value Share (%) and BPS Analysis by Type, 2024 to 2034

Figure 132: South Asia and Pacific Market Y-o-Y Growth (%) Projections by Type, 2024 to 2034

Figure 133: South Asia and Pacific Market Value (US$ Million) Analysis by Component, 2019 to 2034

Figure 134: South Asia and Pacific Market Volume (Units) Analysis by Component, 2019 to 2034

Figure 135: South Asia and Pacific Market Value Share (%) and BPS Analysis by Component, 2024 to 2034

Figure 136: South Asia and Pacific Market Y-o-Y Growth (%) Projections by Component, 2024 to 2034

Figure 137: South Asia and Pacific Market Value (US$ Million) Analysis by Application, 2019 to 2034

Figure 138: South Asia and Pacific Market Volume (Units) Analysis by Application, 2019 to 2034

Figure 139: South Asia and Pacific Market Value Share (%) and BPS Analysis by Application, 2024 to 2034

Figure 140: South Asia and Pacific Market Y-o-Y Growth (%) Projections by Application, 2024 to 2034

Figure 141: South Asia and Pacific Market Attractiveness by Type, 2024 to 2034

Figure 142: South Asia and Pacific Market Attractiveness by Component, 2024 to 2034

Figure 143: South Asia and Pacific Market Attractiveness by Application, 2024 to 2034

Figure 144: South Asia and Pacific Market Attractiveness by Country, 2024 to 2034

Figure 145: East Asia Market Value (US$ Million) by Type, 2024 to 2034

Figure 146: East Asia Market Value (US$ Million) by Component, 2024 to 2034

Figure 147: East Asia Market Value (US$ Million) by Application, 2024 to 2034

Figure 148: East Asia Market Value (US$ Million) by Country, 2024 to 2034

Figure 149: East Asia Market Value (US$ Million) Analysis by Country, 2019 to 2034

Figure 150: East Asia Market Volume (Units) Analysis by Country, 2019 to 2034

Figure 151: East Asia Market Value Share (%) and BPS Analysis by Country, 2024 to 2034

Figure 152: East Asia Market Y-o-Y Growth (%) Projections by Country, 2024 to 2034

Figure 153: East Asia Market Value (US$ Million) Analysis by Type, 2019 to 2034

Figure 154: East Asia Market Volume (Units) Analysis by Type, 2019 to 2034

Figure 155: East Asia Market Value Share (%) and BPS Analysis by Type, 2024 to 2034

Figure 156: East Asia Market Y-o-Y Growth (%) Projections by Type, 2024 to 2034

Figure 157: East Asia Market Value (US$ Million) Analysis by Component, 2019 to 2034

Figure 158: East Asia Market Volume (Units) Analysis by Component, 2019 to 2034

Figure 159: East Asia Market Value Share (%) and BPS Analysis by Component, 2024 to 2034

Figure 160: East Asia Market Y-o-Y Growth (%) Projections by Component, 2024 to 2034

Figure 161: East Asia Market Value (US$ Million) Analysis by Application, 2019 to 2034

Figure 162: East Asia Market Volume (Units) Analysis by Application, 2019 to 2034

Figure 163: East Asia Market Value Share (%) and BPS Analysis by Application, 2024 to 2034

Figure 164: East Asia Market Y-o-Y Growth (%) Projections by Application, 2024 to 2034

Figure 165: East Asia Market Attractiveness by Type, 2024 to 2034

Figure 166: East Asia Market Attractiveness by Component, 2024 to 2034

Figure 167: East Asia Market Attractiveness by Application, 2024 to 2034

Figure 168: East Asia Market Attractiveness by Country, 2024 to 2034

Figure 169: Middle East and Africa Market Value (US$ Million) by Type, 2024 to 2034

Figure 170: Middle East and Africa Market Value (US$ Million) by Component, 2024 to 2034

Figure 171: Middle East and Africa Market Value (US$ Million) by Application, 2024 to 2034

Figure 172: Middle East and Africa Market Value (US$ Million) by Country, 2024 to 2034

Figure 173: Middle East and Africa Market Value (US$ Million) Analysis by Country, 2019 to 2034

Figure 174: Middle East and Africa Market Volume (Units) Analysis by Country, 2019 to 2034

Figure 175: Middle East and Africa Market Value Share (%) and BPS Analysis by Country, 2024 to 2034

Figure 176: Middle East and Africa Market Y-o-Y Growth (%) Projections by Country, 2024 to 2034

Figure 177: Middle East and Africa Market Value (US$ Million) Analysis by Type, 2019 to 2034

Figure 178: Middle East and Africa Market Volume (Units) Analysis by Type, 2019 to 2034

Figure 179: Middle East and Africa Market Value Share (%) and BPS Analysis by Type, 2024 to 2034

Figure 180: Middle East and Africa Market Y-o-Y Growth (%) Projections by Type, 2024 to 2034

Figure 181: Middle East and Africa Market Value (US$ Million) Analysis by Component, 2019 to 2034

Figure 182: Middle East and Africa Market Volume (Units) Analysis by Component, 2019 to 2034

Figure 183: Middle East and Africa Market Value Share (%) and BPS Analysis by Component, 2024 to 2034

Figure 184: Middle East and Africa Market Y-o-Y Growth (%) Projections by Component, 2024 to 2034

Figure 185: Middle East and Africa Market Value (US$ Million) Analysis by Application, 2019 to 2034

Figure 186: Middle East and Africa Market Volume (Units) Analysis by Application, 2019 to 2034

Figure 187: Middle East and Africa Market Value Share (%) and BPS Analysis by Application, 2024 to 2034

Figure 188: Middle East and Africa Market Y-o-Y Growth (%) Projections by Application, 2024 to 2034

Figure 189: Middle East and Africa Market Attractiveness by Type, 2024 to 2034

Figure 190: Middle East and Africa Market Attractiveness by Component, 2024 to 2034

Figure 191: Middle East and Africa Market Attractiveness by Application, 2024 to 2034

Figure 192: Middle East and Africa Market Attractiveness by Country, 2024 to 2034

Frequently Asked Questions

What is the anticipated growth of the tension control market from 2024 to 2034?

The tension control market is expected to grow at a 5.4% CAGR from 2024 to 2034.

What can be anticipated from the market for tension controls through 2024?

By 2024, the tension control market is likely to gain USD 1.3 billion.

What is the anticipated global market valuation by 2034?

By 2034, the tension control market valuation might reach a sum of USD 2.2 billion.

What is the expected performance of the tension control market in the United States?

The tension control industry in the United States is likely to expand at a 5.6% CAGR during the forecast period.

By product type, which segment is boosting the sales of the tension control market?

The automated segment is expected to garner a 5.1% CAGR from 2024 to 2034.

What can be expected from the component type segment for tension controls?

By component, the load cell category will experience a 4.9% CAGR through 2034.

Explore Similar Insights

Future Market Insights

Tension Control Market