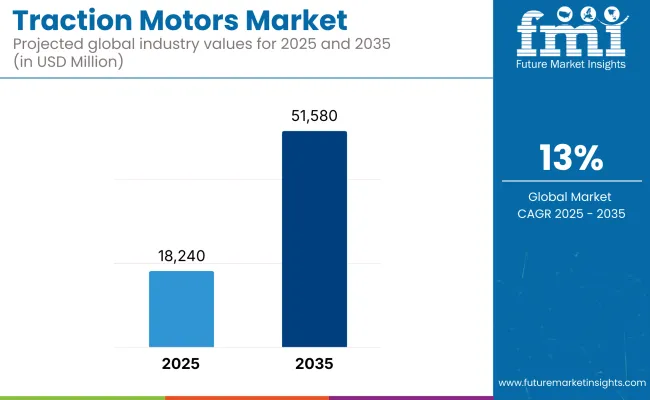
The traction motors market is poised for dynamic growth, fuelled by the expanding electric vehicle (EV) segment, increasing investment in railway infrastructure, and the ongoing transition toward sustainable urban mobility. Valued at USD 18,240 million in 2025, the market is projected to reach USD 51,580 million by 2035, progressing at a robust CAGR of 13.0% between 2025 and 2035. Rising environmental concerns and policy mandates for zero-emission transport are compelling both public and private sectors to adopt advanced electric propulsion systems.
Traction motors, which are the foundation for electric and hybrid drivetrains, are becoming more complex and efficient. PMSM, axial flux motors, and other high-performance variants are increasingly being incorporated into designs to drive torque density, thermal performance, and vehicle efficiency. These advances are allowing manufacturers to satisfy the growing demands of high-speed railways, electric buses, trucks, and passenger EVs all working in concert.
Additionally, government-backed efforts to upgrade mass transit infrastructure and electrify public transportation fleets should also support long-term demand. Continual growth in smart cities developments and a rise in autonomous and connected transport systems are also positively influencing the market attractiveness of energy-saving and smaller traction motor solutions.
As OEMs and component manufacturers double down on R&D efforts, and governments also ramp up the promotion of electric mobility, the traction motors market is expected to experience breakthrough innovation and large-scale adoption across multiple modes of transportation in the upcoming years.
As the world is on the path of transition towards electrification of mobility and industrial automation, traction motors market is poised to grow phenomenally. Based on application, the market is segmented into transportation, industrial machinery, and equipment, and others, and based on end users, it is segmented into hybrid vehicles, compact construction equipment, escalators, elevators, and others (washing machines, electric aircraft, etc.) Regional-European transportation segment is anticipated to remain the largest segment, driven by their core presence for enabling energy efficiency and carbon neutrality targets in any domain.
Transportation Segment Leads in Application, Driven by Electric Rail and E-Mobility Expansion
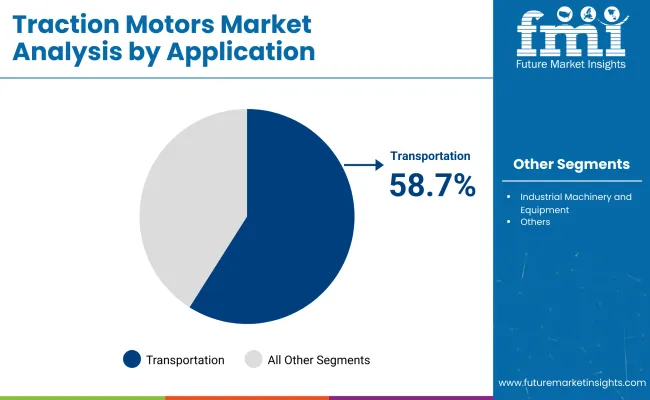
By 2025, the transportation segment is expected to hold a share of 58.7% of the entire traction motors market supported mainly by the growing installation of electric trains, metros, trams, and electric buses. Rail, light rail motors:tight environmental regulations, environmental protection concerns and government investment in electrified rail infrastructure and public transport systems in many regions are driving the adoption of high-torque / high-efficiency traction motors. Plus, the emergence of electric trucks and last-mile delivery vehicles further solidifies the upward trajectory for traction motors in transportation applications.
Hybrid Vehicles Dominate End-User Segment, Fueled by Demand for Fuel-Efficient Powertrains
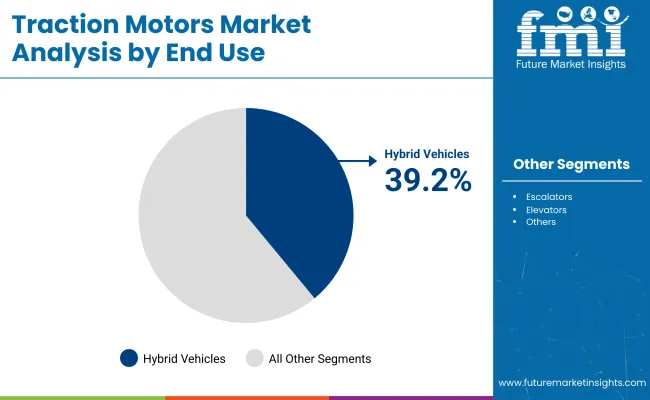
It is anticipated that the hybrid vehicles will continue to remain the leading sub-segment in the end-user category, as they capture an anticipated 39.2% share of the market in 2025, due to their growing preference as a middle ground solution between conventional combustion engines and fully electric vehicles (EVs).
An integral part of hybrid systems, traction motors enable electric propulsion, regenerative braking, and torque assistance to enhance fuel economy. Demand for advanced hybrid traction motors is rising as key automakers expand hybrid line-ups to meet emission targets.
The North America traction motors market is growing at a healthy rate, aided by strong investments in electric transport infrastructure, increasing demand for electric and hybrid vehicles, and developments in rail electrification. The USA is the leading contributor to the regional market, owing to the sustaining programs of electric mobility, backed up with both federal and state-level incentives.
Rising output of electric passenger vehicle types, commercial EV fleets, and electric locomotives are driving the uptake of high-efficiency traction motors. The use of compact electric drivetrains that utilize PMSMs and induction motors is not only growing, it is becoming an integral part of the automotive landscape.
Modernizing rail networks is one of the key drivers of growth for reliable, high-performance traction motors in the region, particularly for commuter and freight rail applications. Rising incorporate in sustainable transit systems, including electric buses and light rail vehicles (LRVs) in Canada, is further fuelling the market expansion for advanced traction motor systems with regenerative braking capabilities.
The mature manufacturing ecosystem established in North America, combined with the presence of major motor makers and top tier automotive OEMs, enables the rapid adoption of higher innovation motor technologies that are focused on high power densities and thermal efficiencies. The drive for domestic rare earth supply and localized production also plays into the growth of the region.
Europe appeals as one of the strong regions for traction motor development, driven by stringent environmental norms, government subsidies for clean mobility and massive electrification of public transport networks. Countries like Germany, France, the UK, and the Netherlands are paving the road to electronic mobility through EVs, trams, metros, and electric buses that incorporate traction motors.
As a center for automotive manufacturing, Germany, in particular, is at the forefront of quickly adopting high-torque, energy-dense motors in next-gen EV platforms. The introduction of dual-motor systems in premium electric vehicle (EV) segments and use of all-wheel-duration (AWD) are driving demand for next-generation traction motors.
Traction motors are at the heart of efforts to improve operational efficiency and reduce carbon emissions as rail electrification across the continent accelerates in response to European Union sustainability directives. This trend is underscored by France’s commitment to eliminating use of diesel trains, and widespread electrification of regional lines.
By comparison, Scandinavian nations are pouring money into all-electric ferry and marine systems featuring well-proven high-output traction motors specifically designed for heavy-duty applications. European research and development programs are emphasizing motor miniaturization, noise reduction and the optimization of magnetic materials, making Europe a pioneer in sustainable motor development.
The Asia-Pacific region accounts for a majority of the global traction motor market, with the sheer volume of vehicles produced in the region and rapid urbanization nationally as well as a balanced focus on electric transportation contributing significantly to growth in this sector. In regional and global market, China leads on large scale of EV production, the expansion of high-speed rail, as well as the government policy support on new energy vehicles (NEVs).
The country’s (user’s) rapid shift to electrified buses and commercial vehicles have driven demand for low-maintenance, high-efficiency traction motors like PMSMs and brushless DC motors. Other than that, China sources key motor materials locally, such as rare earth magnets, creating of a secure and cheaper supply chain for domestic manufacturers.
Meanwhile, India is also becoming an important market with policies like the one under FAME (Faster Adoption and Manufacturing of Hybrid and Electric Vehicles), which focus on the manufacturing of electric buses, three-wheelers and light electric commercial vehicles. Rail modernisation across the country means major cities are also adopting new traction systems for metro rail projects.
Japan and South Korea, are well-known for innovation in electric powertrains and electric industrial motors and have been introducing high-performance traction motors for consumer and industrial applications. The Asia-Pacific region continues to be the fastest-growing and the most innovation-intensive landscape for traction motors by making strong investments in motor control electronics, thermal management, and in-wheel motor technologies.
High Cost and Supply Chain Constraints
The high cost of production and integration is a major challenge for the traction motors market. Rare-earth magnets and high-grade insulation are much more expensive and further drive up costs, particularly for the permanent magnet synchronous motors (PMSM) that are ubiquitous in electric and hybrid vehicle propulsion.
Moreover, supply chain disruptions, especially through sourcing rare-earth materials, are a threat to consistent production and thus adversely impact OEM timelines and prices. Adoption is further complicated by the need to integrate traction motors with legacy systems, particularly in rail and industrial applications.
E-Mobility Expansion and Urban Rail Investments
The transition to electric mobility, fuelled by climate ambitions and government regulations, is a huge opportunity for the traction motors market. Emerging applications such as electric vehicles (EVs) and increased investment in urban transit rail systems metros, trams and high-speed trains will greatly contribute to demand for high-performance traction motors.
Axial flux and magnet-free motor designs may soon emerge as a way to control costs as they climb toward efficiency and scalability. Also, growing use of automation and Industry 4.0 in industrial environment will drive the requirement of electric-driven mobility and robotics that need traction motor solution.
The traction motors market experienced significant growth between 2020 and 2024, as EVs rapidly penetrated the market, and public rail transit systems expanded across Asia and Europe. It included optimized motor torque density, better thermal management and tighter inverter-motor integration. But global supply chain disruptions in 2021 and 2022 exposed vulnerabilities, particularly regarding semiconductor availability and raw material sourcing.
The next generation of motor architectures, such as magnet-less motors and liquid-cooled motors, will reflect the next phase of evolution and potentially disrupt the further market in 2025 to 2035. Better energy density, more compactness and predictive maintenance features will be standard offering.
Investments in electrified transportation infrastructure will likely surge in North America, Europe and parts of Asia, further solidifying traction motors as fundamental components in achieving sustainable mobility. On the other hand, new technologies like additive manufacturing (3D printing) and digital twin technology will reshape production and quality assurance processes.
Market Shifts: A Comparative Analysis 2020 to 2024 vs. 2025 to 2035
| Market Shift | 2020 to 2024 Trends |
|---|---|
| Regulatory Landscape | Focus on fuel efficiency and emission norms |
| Technological Advancements | PMSM and induction motors dominate |
| Industry Adoption | Automotive (EVs), rail, and industrial machinery |
| Supply Chain and Sourcing | Reliance on China for rare-earth magnets |
| Market Competition | Established players lead with incremental innovations |
| Market Growth Drivers | EV boom, rail expansions in emerging economies |
| Sustainability and Energy Efficiency | Moderate focus on energy losses and recyclability |
| Consumer Preferences | Reliability and torque output |
| Market Shift | 2025 to 2035 Projections |
|---|---|
| Regulatory Landscape | Strong mandates for zero-emission mobility and electric public transport |
| Technological Advancements | Rise of axial flux, magnet-less, and compact liquid-cooled motors |
| Industry Adoption | Widespread use across drones, robotics, smart manufacturing, and urban transport |
| Supply Chain and Sourcing | Diversification of supply chains, recycling of magnets, and local manufacturing hubs |
| Market Competition | Entry of startups focusing on innovative and low-cost motor designs |
| Market Growth Drivers | E-mobility mandates, Industry 4.0, and electrified transport infrastructure spending |
| Sustainability and Energy Efficiency | Focus on carbon-neutral motors, energy optimization, and circular economy models |
| Consumer Preferences | Compactness, silent operation, smart diagnostics, and enhanced vehicle range |
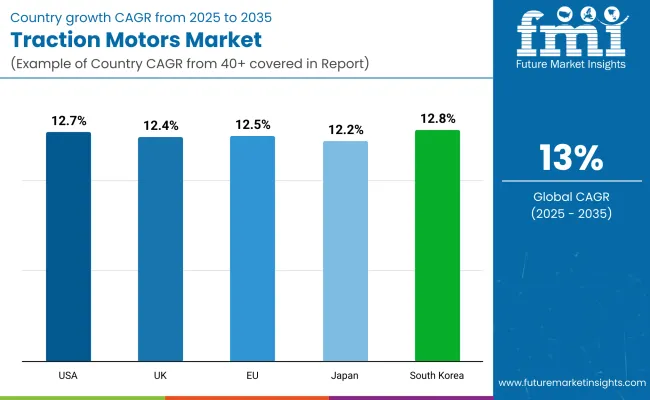
It is led by the United States with investments in EV manufacturing, railway modernization and industrial automation contributing to the traction motors market. Key to that are electric propulsion systems, which the major OEMs are increasingly gravitating towards in the pursuit of federal energy efficiency and emissions goals.
Additionally, federal incentives at the USAinvestors in addition to local applications advocating electric transportation have considerably fast-tracked the development of traction motors through automotive, rail, and industrial purposes.
| Country | CAGR (2025 to 2035) |
|---|---|
| United States | 12.7% |
With the expanding electric vehicle ecosystem and the discussion of decarbonizing rail transport, the traction motors market in the UK has potential. Traction motor applications are set to find fertile ground with national infrastructure projects aimed at electrifying rail lines and growing government subsidies for electric mobility. And the country’s robust research ecosystem is generating innovations in motor design and energy efficiency.
| Country | CAGR (2025 to 2035) |
|---|---|
| United Kingdom | 12.4% |
The European Union, particularly Germany, France, and the Netherlands, is experiencing robust growth in the traction motors market due to stringent carbon emission norms and high penetration of EVs and electrified rail systems.
The EU has implemented initiatives, including the green deal and targets for sustainable mobility that are directly driving demand for efficient, high-performance traction motors. Leading automotive and locomotive manufacturers in the region are also making investments in advanced motor technologies, which also supports market advancement.
| Region | CAGR (2025 to 2035) |
|---|---|
| European Union | 12.5% |
The advanced railway networks in Japan, coupled with strong demand for automotive electrification, continue to support the traction motors market in that region. Japanese companies have been at the forefront of technology development for compact, lightweight, and energy-efficient traction motors for high-speed trains and electric vehicles. State-sponsored R&D programs and partnerships with both automakers and rail operators are pushing the market even further.
| Country | CAGR (2025 to 2035) |
|---|---|
| Japan | 12.2% |
As domestic production of EVs ramps up, the traction motors market in South Korea is growing rapidly. With the introduction of new EV line-ups, high-efficiency motors are also being deployed, as seen with companies like Hyundai and Kia, and smart mobility trends are increasing demand for lightweight, and high-powered traction motors. Electrification projects in public transport, especially rail, is providing new opportunities for motor suppliers as well.
| Country | CAGR (2025 to 2035) |
|---|---|
| South Korea | 12.8% |
As electrification becomes the mainstay across railways, electric vehicles (EVs), and industrial automation sectors, the traction motors market is on the verge of radical transformation. From 2024 to 2025, leading manufacturers are ramping up production capacity while concentrating on improving the efficiency of motor technologies, such as synchronous and permanent magnet motors, and forging strategic alliances with OEMs or transit authorities. With growing importance placed on sustainability and energy efficiency, the players are investing in next-gen motor designs for hybrid and fully electric drivetrains.
Market Share Analysis by Key Players & Manufacturers
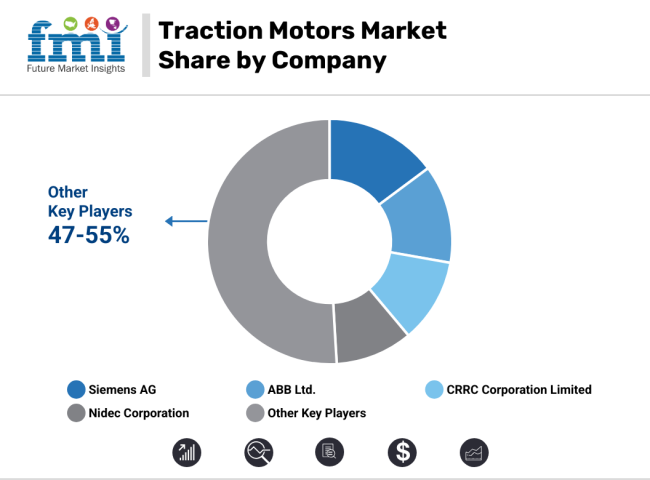
| Company/Organization Name | Key Offerings/Activities |
|---|---|
| Siemens AG | Unveiled next-gen electric traction motors for rail and EV mobility platforms in 2024. |
| ABB Ltd. | Developed energy-efficient synchronous traction motors for metros and regional trains in 2025. |
| CRRC Corporation Limited | Rolled out integrated traction systems for high-speed rail and mass transit in 2024. |
| Nidec Corporation | Expanded its e-axle traction motor production line for electric vehicles in 2025. |
Key Market Insights
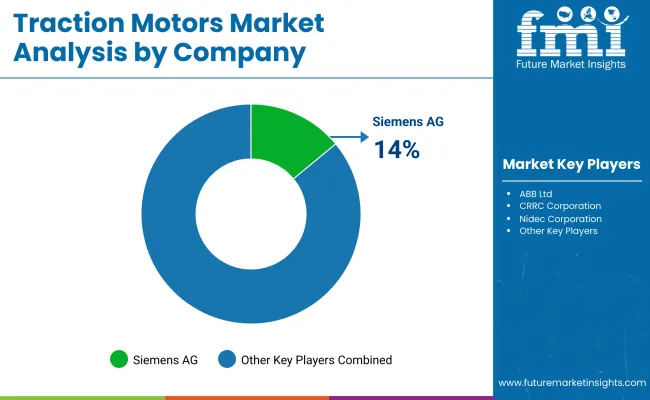
Siemens AG (14-16%)
Siemens remains a dominant force in the rail and metro segments, launching a compact traction motor platform with enhanced torque density and thermal efficiency. Its global presence and local manufacturing hubs support major railway electrification projects across Europe and Asia.
ABB Ltd. (12-14%)
ABB introduced synchronous traction motors optimized for reduced lifecycle costs and high operational uptime, targeting metro networks and freight locomotives. Its motors integrate well with automation and digital twin platforms, aligning with smart rail initiatives.
CRRC Corporation Limited (10-12%)
A key player in the APAC region, CRRC rolled out modular traction systemstailored for both high-speed and urban transit. Its focus on domestic electrification and export programs to Africa and Latin America reinforces its growing footprint.
Nidec Corporation (9-11%)
Nidec leads in EV traction motor innovation. It launched a scalable e-axle motor platform for both passenger and commercial EVs. Its growing customer base in Asia and North America reflects rising demand for compact, power-dense designs.
Other Key Players (47-55% Combined)
The market was valued at USD 18,240 million in 2025.
It is expected to grow to USD 51,580 million by 2035.
Growth is primarily driven by electric vehicle (EV) adoption, increased railway infrastructure investments, and sustainable urban mobility initiatives.
The top contributing countries are China, United States, Germany, Japan, and India.
Transportation and hybrid vehicles are expected to dominate due to their efficiency, high torque density, and suitability for EV and rail applications.


Our Research Products

The "Full Research Suite" delivers actionable market intel, deep dives on markets or technologies, so clients act faster, cut risk, and unlock growth.

The Leaderboard benchmarks and ranks top vendors, classifying them as Established Leaders, Leading Challengers, or Disruptors & Challengers.

Locates where complements amplify value and substitutes erode it, forecasting net impact by horizon

We deliver granular, decision-grade intel: market sizing, 5-year forecasts, pricing, adoption, usage, revenue, and operational KPIs—plus competitor tracking, regulation, and value chains—across 60 countries broadly.

Spot the shifts before they hit your P&L. We track inflection points, adoption curves, pricing moves, and ecosystem plays to show where demand is heading, why it is changing, and what to do next across high-growth markets and disruptive tech

Real-time reads of user behavior. We track shifting priorities, perceptions of today’s and next-gen services, and provider experience, then pace how fast tech moves from trial to adoption, blending buyer, consumer, and channel inputs with social signals (#WhySwitch, #UX).

Partner with our analyst team to build a custom report designed around your business priorities. From analysing market trends to assessing competitors or crafting bespoke datasets, we tailor insights to your needs.
Supplier Intelligence
Discovery & Profiling
Capacity & Footprint
Performance & Risk
Compliance & Governance
Commercial Readiness
Who Supplies Whom
Scorecards & Shortlists
Playbooks & Docs
Category Intelligence
Definition & Scope
Demand & Use Cases
Cost Drivers
Market Structure
Supply Chain Map
Trade & Policy
Operating Norms
Deliverables
Buyer Intelligence
Account Basics
Spend & Scope
Procurement Model
Vendor Requirements
Terms & Policies
Entry Strategy
Pain Points & Triggers
Outputs
Pricing Analysis
Benchmarks
Trends
Should-Cost
Indexation
Landed Cost
Commercial Terms
Deliverables
Brand Analysis
Positioning & Value Prop
Share & Presence
Customer Evidence
Go-to-Market
Digital & Reputation
Compliance & Trust
KPIs & Gaps
Outputs
Full Research Suite comprises of:
Market outlook & trends analysis
Interviews & case studies
Strategic recommendations
Vendor profiles & capabilities analysis
5-year forecasts
8 regions and 60+ country-level data splits
Market segment data splits
12 months of continuous data updates
DELIVERED AS:
PDF EXCEL ONLINE
Traction Battery Market Growth - Trends & Forecast 2025 to 2035
Traction Inverter Market
Traction Transformer Market
Extraction Kits Market Analysis - Size, Share, and Forecast Outlook 2025 to 2035
DC Traction Switchgear Market Size and Share Forecast Outlook 2025 to 2035
EV Traction Inverter Market Size and Share Forecast Outlook 2025 to 2035
Skin Traction Kits Market
Rail Traction Transformers Market
Data Extraction Software Market
Lipid Extraction Kit Market Size and Share Forecast Outlook 2025 to 2035
Juice Extraction Equipment Market Size and Share Forecast Outlook 2025 to 2035
Railway Traction Motor Market Growth – Trends & Forecast 2025 to 2035
Railway Traction Inverter Market Growth - Trends & Forecast 2025 to 2035
Electric Traction Motor Market Forecast Outlook 2025 to 2035
Tissue Extraction System Market Size and Share Forecast Outlook 2025 to 2035
Carpet Extraction Cleaner Market Analysis- Trends, Growth & Forecast 2025 to 2035
Faecal Extraction System Market
Lithium Extraction From Brine Technology Market Size and Share Forecast Outlook 2025 to 2035
DNA/RNA Extraction Market Growth & Demand 2025 to 2035
Light Rail Traction Converter Market Size and Share Forecast Outlook 2025 to 2035

Thank you!
You will receive an email from our Business Development Manager. Please be sure to check your SPAM/JUNK folder too.
Chat With
MaRIA