
- Market Size (2026)
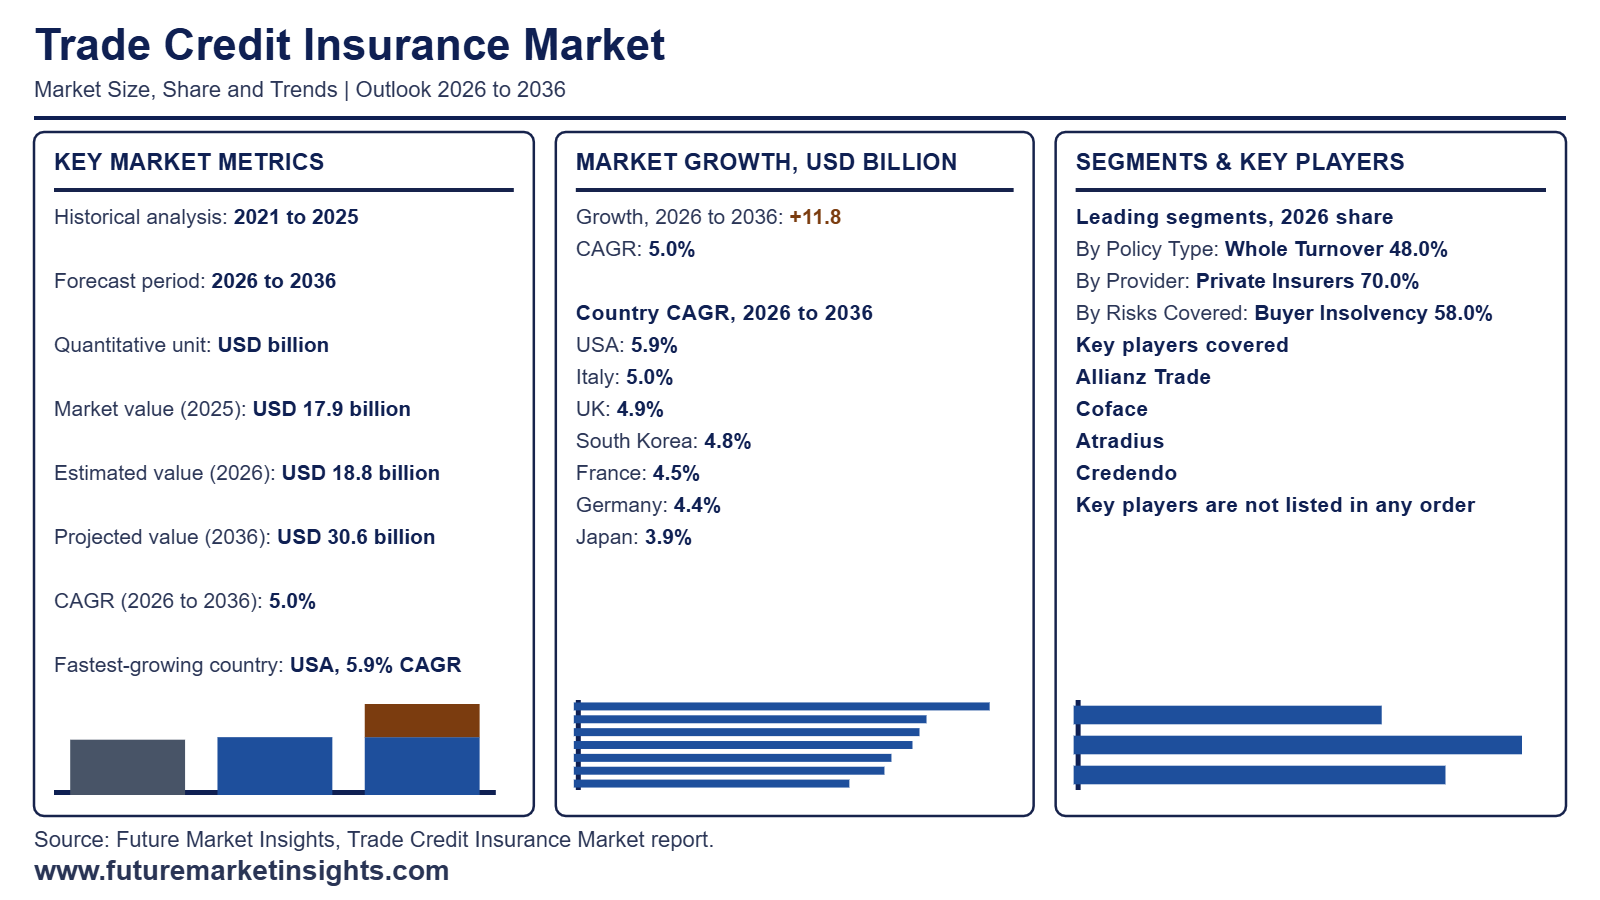
- USD 18.8 Bn
- Forecast (2036)
- USD 30.6 Bn
- CAGR (2026 to 2036)
- 5.0%
How Big Is the Trade Credit Insurance Market in 2026?
The global trade credit insurance market is valued at USD 18.8 billion in 2026, up from USD 17.9 billion in 2025, and is projected by Future Market Insights (FMI) to reach USD 30.6 billion by 2036, expanding at a 5.0% CAGR over the 2026 to 2036 forecast period.
| Market Metric | Valuation / Share / Forecast Benchmark |
|---|---|
| 2025 Market Size (Historical) | USD 17.9 billion |
| 2026 Market Size (Estimated) | USD 18.8 billion |
| 2036 Market Size (Projected) | USD 30.6 billion |
| Compound Annual Growth Rate (2026 to 2036) | 5.0% CAGR |
| Incremental Dollar Opportunity (2026 to 2036) | USD 11.8 billion |
| Dominant Policy Type (2026 to 2036 Share) | Whole Turnover (48.0% in 2026, rising to 48.5% by 2036) |
| Leading & Fastest-Growing Policy Types | Whole Turnover (48.0% share in 2026; 5.1% CAGR) | Excess of Loss (6.3% CAGR) |
| Leading & Fastest-Growing Risks Covered | Buyer Insolvency (58.0% share in 2026; 5.1% CAGR) | Political and Transfer Risk (6.8% CAGR) |
| Leading & Fastest-Growing Providers | Private Insurers (70.0% share in 2026; 5.0% CAGR) | Export Credit Agencies (6.0% CAGR) |
| Leading & Fastest-Growing Customer Sizes | Mid-Market (30.0% share in 2026; 5.3% CAGR) | Small and Medium Businesses (6.6% CAGR) |
| Largest Country Markets (2026 Global Share) | Germany (17.0%), USA (15.0%), France (14.0%) |
| Fastest-Growing Country Markets (2026 to 2036) | USA (5.9% CAGR), Italy (5.0% CAGR), UK (4.9% CAGR) |
| Leading Tier-1 Companies | Allianz Trade, Coface, Atradius, Credendo |
Source: Future Market Insights analysis of the trade credit insurance market, 2026.
Executive Market Overview
Sellers buy trade credit insurance because open-account terms leave them holding unpaid invoices while corporate failures keep rising. Shipments widen that exposure as world merchandise trade volume is forecast to grow 3.9% in 2026 and 4.1% in 2027 (World Trade Organization 2026). Global business insolvencies are set to rise 5% this year and 1% next in a fifth consecutive year of increases (Allianz Trade 2026). Insurers answer with portfolio cover that spreads risk across many buyers and with layered programs where large sellers retain first losses. Lenders also favor insured receivables when they extend working capital which ties coverage to supplier financing and keeps credit lines open through weaker trading periods.
Limit availability on distressed buyers is the restraint specific to this market since insurers lower credit limits on weaker names when insolvency risk rises and sellers then ship with less protection. Underwriting depth shapes the competitive field as Allianz Trade and Coface and Atradius and Credendo rely on continuous buyer monitoring to price risk and to adjust limits before payment dates arrive. That scale advantage rewards insurers with large data holdings and long claims histories. Clients weigh these strengths against premium levels at each renewal while broader commercial insurance programs compete for the same corporate risk budgets. Sizing covers insurance of commercial trade receivables and related political risk while excluding consumer credit and mortgage insurance and surety bonds.
Analyst Perspective
The trade credit insurance market is advancing as exporters and suppliers seek protection against buyer payment defaults amid volatile global trade conditions. Insurers that use real time buyer risk analytics and flexible policies will win broader corporate coverage and strengthen long term client relationships.
- Rahul Pandita, Principal Consultant, Future Market Insights.
Major Market Trends and Insights
- Elevated Insolvency Outlook Keeps Receivables Cover in Demand: Companies facing a long stretch of buyer failures look to insurers to protect ledgers and support bank credit so receivables cover remains a core working capital tool. Insurers in turn calibrate limits more closely by sector and country. Allianz Trade (October 2026) forecasts global business insolvencies up 5% in 2026 and 1% in 2027 with the peak now pushed out to 2028 when a 1% easing is expected. About 2.7 million jobs are directly at risk across 2026 and 2027 which keeps credit risk on boardroom agendas. Buyers and brokers that read these signals early secure stronger terms.
- Coface Shows Retention and New Business Offsetting Easing Prices: Credit insurers are protecting margin through selective limit management while growth comes from keeping clients and winning new ones as premium rates ease. Coface (November 2026) reported credit insurance revenue up 0.9% for the nine months to September 2026 with client retention at 93.1% and record new business of €105 million. Pricing moved 1.3% lower while client activity added 2.5%. Provisioned claim amounts rose 10.8% as large claims returned in the third quarter and management stepped up prevention measures. Disciplined underwriting and loyal portfolios carry earnings through the cycle. That balance keeps the segment profitable even as price competition continues.
- Record Claims Payouts Reset Underwriting Rules Across Short Term Cover: Rapid growth in short term cover has now met a catch-up in claims so insurers are tuning appetite and monitoring large single names more closely. The Berne Union (2026) reports its members supported USD 3,714 billion of new trade in 2025 up 12% with short term revolving limits at USD 2.58 trillion up 14%. Total claims paid reached a record USD 11,107 million up 17% and the association links this mainly to a few large cases. Insurers with strong data on buyer exposure keep pricing authority and can extend cover with confidence. Brokers and corporate buyers should expect closer questions on concentration.
How Is the Trade Credit Insurance Market Segmented?
Analysis of the global trade credit insurance market runs across policy type and risk covered and provider and customer size and region with each axis expressed as its own revenue distribution that reconciles to the market total.
| Segmentation Axis | Sub-Segments Covered | 2026 Leading Segment and Share | Main Growth Benchmark (2026 to 2036) |
|---|---|---|---|
| Policy Type | Whole Turnover / Key Account / Excess of Loss / Single Transaction | Whole Turnover (48.0% revenue share) | Whole Turnover share rises to 48.5% by 2036 at 5.1% CAGR |
| Risk Covered | Buyer Insolvency / Protracted Default / Political and Transfer Risk / Pre-Shipment and Other | Buyer Insolvency (58.0% revenue share) | Buyer Insolvency share rises to 58.6% by 2036 at 5.1% CAGR |
| Provider | Private Insurers / Export Credit Agencies / Specialty and Lloyd’s Markets / Captives and Mutuals | Private Insurers (70.0% revenue share) | Private Insurers hold a 70.0% share through 2036 at 5.0% CAGR |
| Customer Size | Mid-Market / Large Corporates / Small and Medium Businesses / Multinational Groups | Mid-Market (30.0% revenue share) | Mid-Market share rises to 30.9% by 2036 at 5.3% CAGR |
| Region | North America / Latin America / Western Europe / Eastern Europe / East Asia / South Asia and Pacific / Middle East and Africa | Western Europe (42.0% revenue share) | South Asia and Pacific leads regional growth at 6.4% CAGR |
Source. Future Market Insights analysis of the trade credit insurance market 2026.
Why Do Whole Turnover Policies Lead by Policy Type?
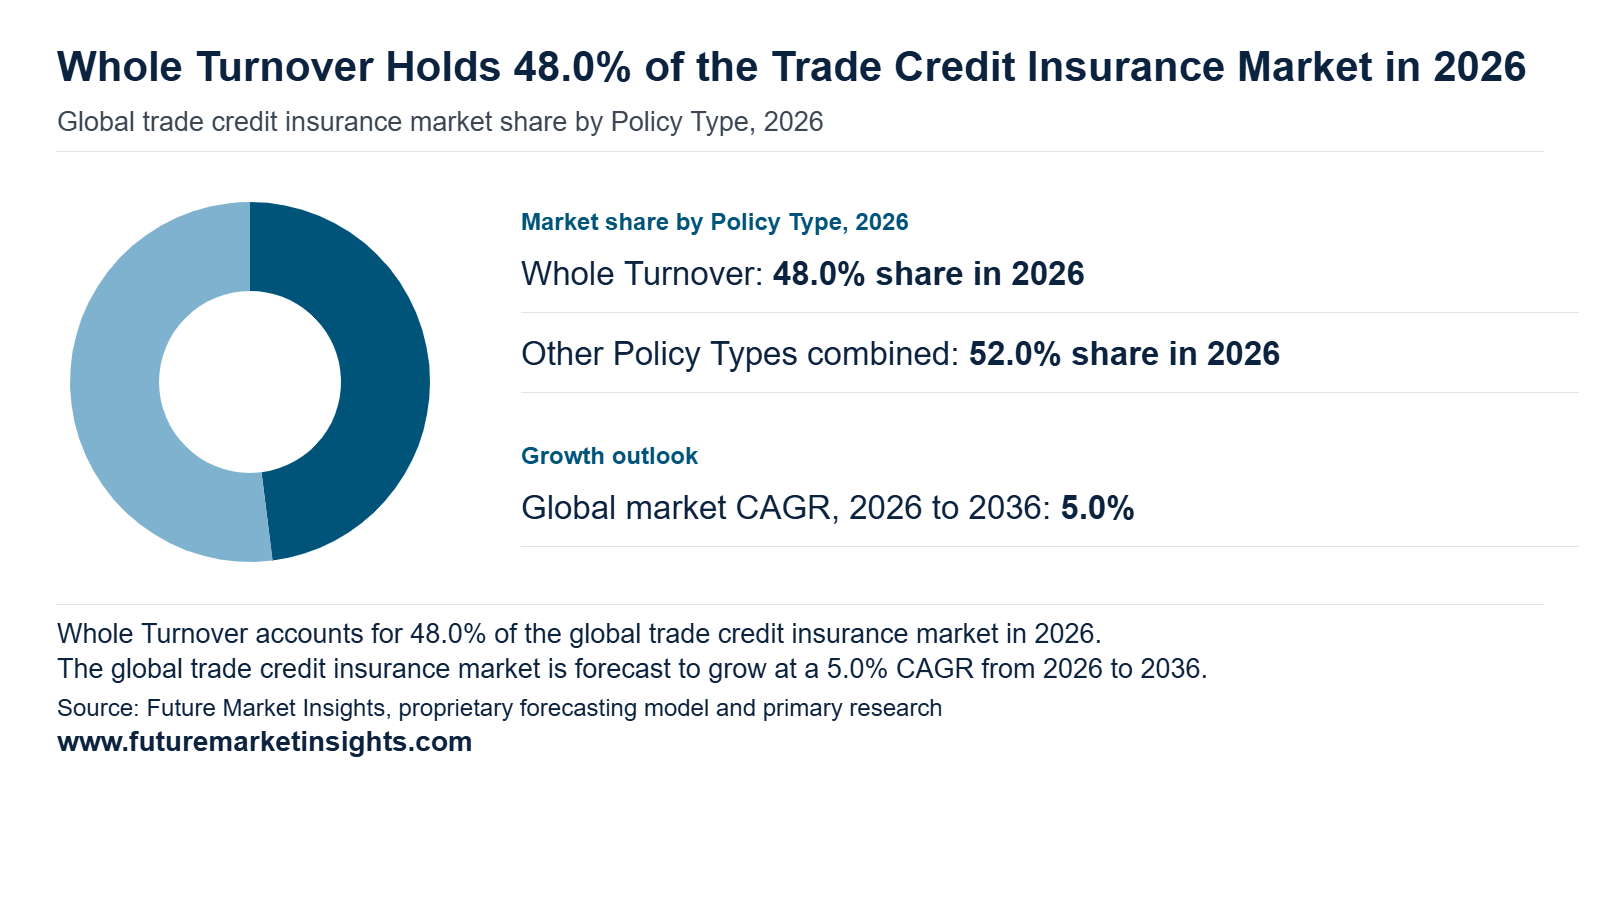
Whole turnover policies lead by policy type with a 48.0% share in 2026 and are projected to reach 48.5% by 2036 at a 5.1% CAGR. Manufacturers and wholesalers with many small buyers prefer to insure the entire receivables ledger since a single premium rate spreads risk and replaces buyer by buyer negotiation. Banks accept these policies as collateral which lifts invoice financing limits and links cover to working capital planning. Credit teams using accounts receivable automation workflows can share buyer data directly with the insurer which speeds limit approvals. Key account and excess of loss and single transaction forms suit concentrated exposures and large one-off contracts.
Why Does Buyer Insolvency Lead by Risk Covered?
Corporate insolvency filings across the United States and Germany and France stay elevated and keep suppliers attentive to customer health. Insurers monitor buyers through payment data and financial filings and adjust credit limits as signals change which gives sellers early warning. Buyer insolvency cover leads by risk covered with a 58.0% share in 2026 and is projected to reach 58.6% by 2036 at a 5.1% CAGR. Exporters shipping into Western Europe and North America treat this protection as a standard condition of open account terms. Protracted default and political and transfer risk and pre-shipment cover address extended payment cycles and country and production stage exposures.
Why Do Private Insurers Lead by Provider?
Private insurers lead by provider with a 70.0% share in 2026 and are projected to maintain that share through 2036 while growing at a 5.0% CAGR. Their buyer databases cover millions of companies which supports rapid limit decisions that exporters need at the time of shipment. Brokers place programs for multinational clients and negotiate terms across carriers which keeps premiums competitive. Solvency II capital rules in Europe reward diversified portfolios which favors large carriers spreading risk across countries and sectors. Export credit agencies fill gaps in cross-border deals and specialty and Lloyd’s markets and captives and mutuals address bespoke or retained exposures.
Why Does the Mid-Market Lead by Customer Size?
Mid-market companies lead by customer size with a 30.0% share in 2026 and are projected to reach 30.9% by 2036 at a 5.3% CAGR. Firms with sizeable receivables and expanding export sales buy cover to protect margins and unlock bank credit lines. CFOs at these companies value digital onboarding and portal access to buyer ratings offered by insurtech platforms and established carriers alike. Brokers bundle policies with collections support which suits finance groups that run lean credit functions. Large corporates and small and medium businesses and multinational groups buy through master policies or bundled packages tailored to their scale.
Trade Credit Insurance Market by Region and Country (2026 to 2036)
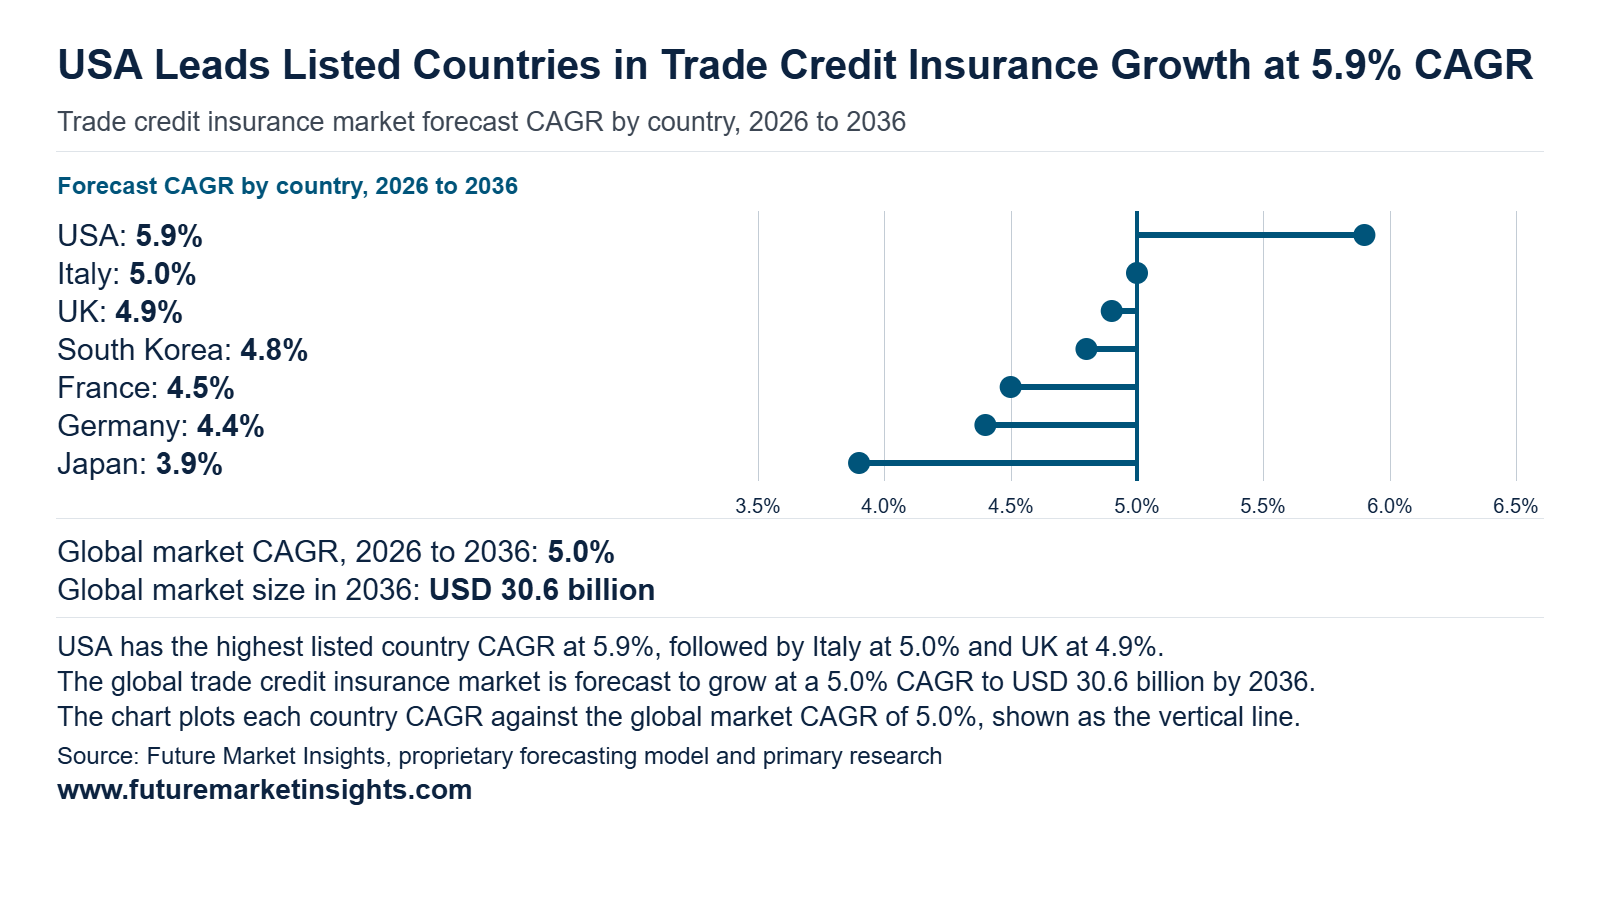
Demand for trade credit insurance spreads across three regional groupings. North America is led by the USA, which is also the fastest-growing country at 5.9% CAGR. Western Europe holds the largest single market in Germany and adds France, the UK and Italy. East Asia is represented by Japan and South Korea, where public export insurers shape policy uptake. Payment behavior and insolvency conditions in each country decide how quickly suppliers move from optional cover to routine protection of receivables.
| Country | 2026 Revenue (USD Million) | 2036 Revenue (USD Million) | 10-Year Addition (USD Million) | 2026 to 2036 CAGR | Global Share (2026 → 2036) |
|---|---|---|---|---|---|
| USA | 1800 | 3193 | 1393 | 5.9% | 15.0% → 16.7% |
| Germany | 2040 | 3138 | 1098 | 4.4% | 17.0% → 16.4% |
| France | 1680 | 2609 | 929 | 4.5% | 14.0% → 13.6% |
| UK | 1080 | 1743 | 663 | 4.9% | 9.0% → 9.1% |
| Italy | 720 | 1173 | 453 | 5.0% | 6.0% → 6.1% |
| Japan | 600 | 880 | 280 | 3.9% | 5.0% → 4.6% |
| South Korea | 360 | 575 | 215 | 4.8% | 3.0% → 3.0% |
| Rest of World | 3720 | 5867 | 2147 | 4.7% | 31.0% → 30.6% |
Source: Future Market Insights analysis of the trade credit insurance market, 2026.
USA
The USA grows fastest among the profiled countries at 5.9% CAGR and starts from a 15.0% global share in 2026. Domestic open account selling gives American credit insurers a very wide base of insurable buyers. Business bankruptcy filings reached about 27 thousand in the year ending September 2026 and rose 12.5% on the prior year according to the Administrative Office of the U.S. Courts. That pace keeps finance chiefs focused on ledger protection. Distributors and wholesalers also use insured receivables to widen borrowing capacity with their banks. Cover therefore moves from an optional purchase toward a standard element of working capital planning. The coming decade keeps the USA ahead of every profiled peer in growth.
Germany
At 17.0% of global value in 2026 Germany stays the largest country market while growing at 4.4% CAGR. Export oriented manufacturers sell on open terms to buyers across Europe and beyond. Destatis reported about 17 thousand corporate insolvency filings from January to August 2026 which was 6.6% above the same months of 2025. Transport and warehousing showed 97.6 insolvencies per 10 thousand firms and hospitality showed 80.1. Those figures draw supplier attention to sector level buyer health. Mittelstand suppliers therefore add policy cover to protect delivery chains. Established penetration points to steady and dependable demand across the next ten years.
France
Banque de France counted about 71 thousand corporate bankruptcies over twelve months to September 2026 which is 4.4% more than a year earlier. France combines a 14.0% share with 4.5% CAGR and shows a broad base of companies that sell on credit. INSEE reports over 1.3 million business creations over the same span with an increase of 12.2%. Each new company becomes a buyer for suppliers who weigh payment behavior before shipping. Insurers gain more names to assess and more ledgers to cover. Larger groups also seek protection for subcontractor chains in transport and trade. Growth stays moderate yet dependable through 2036.
UK
A 4.9% CAGR positions the UK just behind Italy in pace and gives it a 9.0% share in 2026. The insolvency rate reached 49.9 per 10 thousand companies in the twelve months to September 2026 compared with 52.8 a year earlier. Compulsory liquidations rose 25% against September 2025. The Insolvency Service release of 20 October 2026 therefore shows creditors pressing claims more actively. Suppliers who see petitions filed by peers tend to review their own ledgers. British brokers meanwhile package cover for smaller firms that trade with large retailers and contractors. Demand ahead stays steady across services and goods sellers.
Italy
Italy ranks second for growth at 5.0% CAGR and enters 2026 with a 6.0% share. Banca d’Italia describes Italian companies as holding low debt and large liquidity buffers in its report of 13 November 2026. Strong balance sheets let exporters expand sales to foreign buyers on credit terms. The same report points to Middle East tensions that could lift energy prices and tighten financial conditions. Such conditions encourage small and medium manufacturers in the northern industrial districts to insure receivables before widening shipments. Insurers see room to grow beside the deeper markets of Germany and France. That gap supports above average growth through 2036.
Japan
Japan advances at 3.9% CAGR from a 5.0% share and reflects a mature market with public backing. NEXI underwrote about JPY 7.6 trillion of trade insurance in fiscal 2024 and held about JPY 15.5 trillion of outstanding commitments at year end. The Trade Insurance Medium-sized Enterprise Support Package launched in April 2025 extends SME style export cover to companies with up to 2000 employees. That step opens cover to a larger pool of exporters. Over 120 regional financial institutions participate in the related overseas business support package. Overseas buyer bankruptcy remains the central exposure that policyholders address. The NEXI Annual Report 2025 shows a system tuned for gradual and steady expansion.
South Korea
The agency plans to widen reach toward India and ASEAN and the Global South and to ease access through digitalization and AI. New destinations bring unfamiliar buyers whose payment habits need verification. Digital underwriting shortens onboarding for small exporters. Exporters selling into emerging markets therefore treat cover as a routine part of every contract. South Korea posts 4.8% CAGR from a compact 3.0% share. Exporters here depend on overseas buyers for a large part of sales. K-SURE provided KRW 268 trillion in trade insurance overall and KRW 109 trillion to small and medium exporters in its latest reported year.
Competitive Environment and Notable Companies
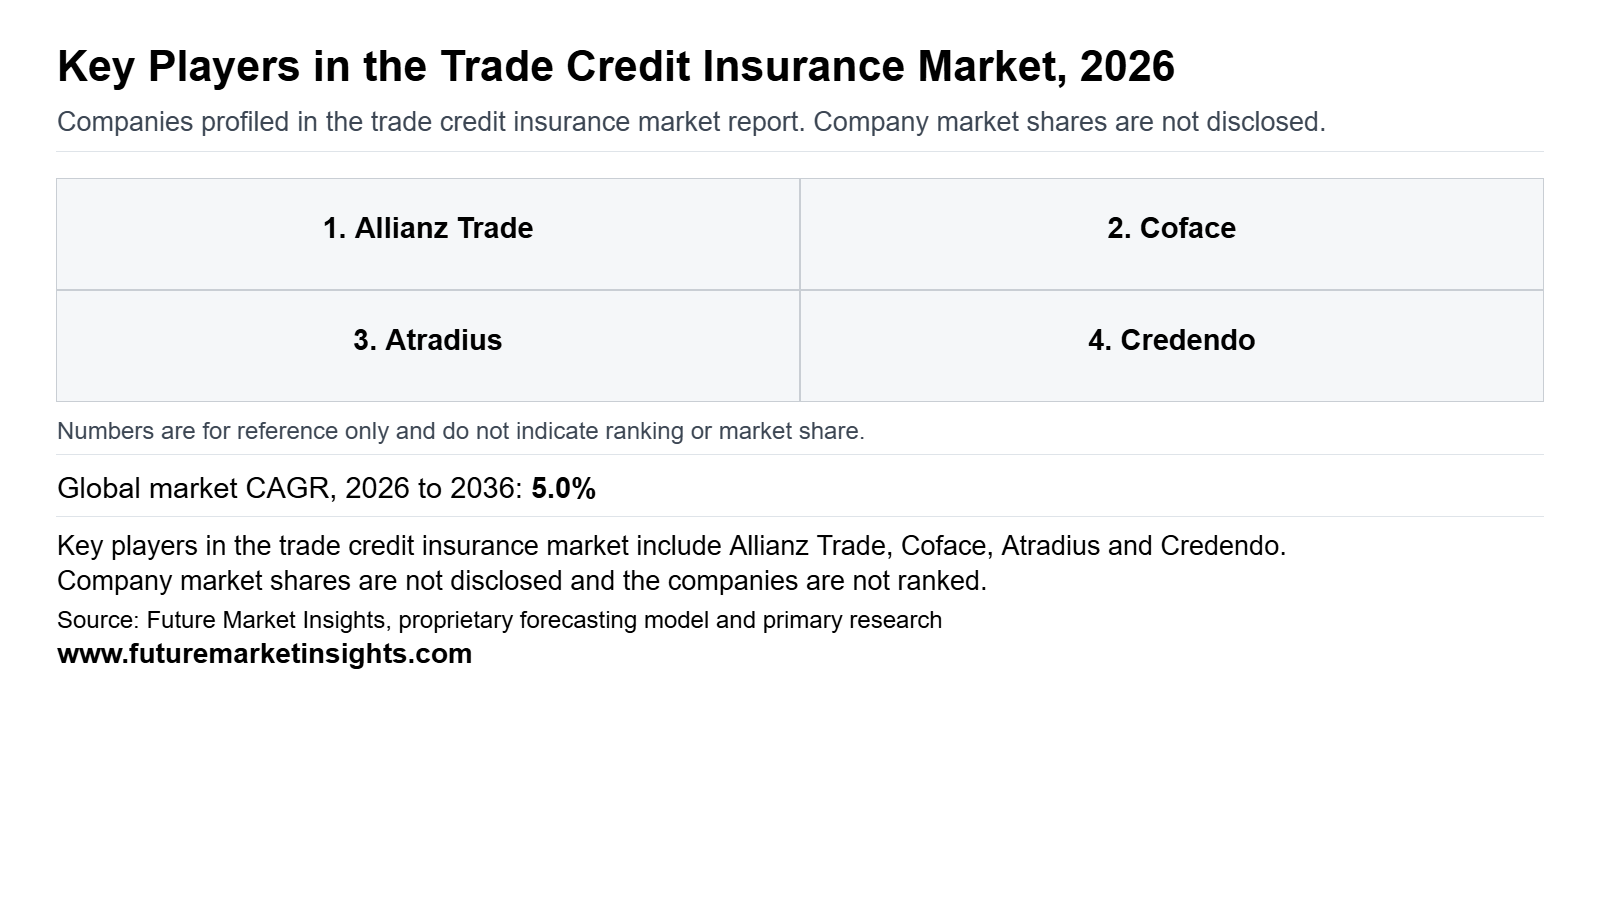
Trade credit insurance competition runs on two levels. The first level covers global private underwriters led by Allianz Trade together with Coface and Atradius and Chubb, which compete on underwriting depth and data quality and digital delivery across borders. The second level covers state linked and national specialists such as Credendo and Cesce and Sinosure, which anchor export credit and public policy cover in their home markets. Outside core home territories growth comes through broker alliances and card network and fintech partnerships and reinsurance panels and local licensing arrangements.
How Are Companies Positioned in the Trade Credit Insurance Market?
Allianz Trade leads the field through global underwriting reach and a growing set of embedded payment products. Coface and Atradius sit in the same top tier and each pairs credit insurance with information services and collection capabilities. Credendo and Cesce serve as Europe focused specialists with close ties to public export credit missions. Sinosure anchors the Chinese export segment as the state insurer. Chubb brings balance sheet strength and specialty underwriting to multinational accounts. Each group competes on a different strength so buyers see clear contrasts between scale and local depth and policy mandate.
What Matters When a Buyer Selects a Trade Credit Insurance Supplier?
Buyers first test financial strength because claim payment rests on the insurer balance sheet. Atradius reported an A (Excellent) rating from A.M. Best and A1 from Moody’s with stable outlooks and a Solvency II ratio above 200%. Next comes the quality of buyer data behind credit limit decisions and the speed of those decisions. Retention shows service satisfaction. Atradius reported customer retention of 94.2% while Coface reported 93.1%. Pricing flexibility and claims handling speed then complete the evaluation.
Which Capabilities Distinguish Product Offers?
Digital underwriting separates product offers. Allianz Trade pay converts transaction level payment data into real time risk signals and underwrites per transaction. Atradius runs most business units on its in-house core system and applies AI and robotics to portfolio management and credit decisions. Credendo created a dedicated Trade Credit Insurance business as a single access point for shorter term risks. Sinosure fixed amount policies tie cover to export customs data accessed through China’s national trade single window. Coface adds business information and debt collection to its insurance base.
How Does Geographic Reach Affect Competition?
Reach decides which multinational accounts a supplier can serve. Atradius created a Lloyd’s syndicate that the company says widens distribution and supports international development. Credendo groups its offers around a dedicated trade credit unit alongside export finance solutions that serve exporters seeking international contracts. Sinosure supports Chinese exporters through short term and longer term programs. Cesce acts as the Spanish export credit agency for the state. Chubb places dedicated trade credit underwriters in six global hubs and adds global licensing capabilities.
| Verified Company Evidence (2026) | Commercial Effect | Buyer Action |
|---|---|---|
| 30 June 2026 Allianz Trade extended trade credit insurance to issuers using Mastercard Virtual Card Numbers through Allianz Trade pay with underwriting per transaction [Allianz Trade (June 2026)] | Brings usage based cover into B2B travel payment flows and widens insurance beyond annual policies | Card issuers and travel platforms compare transaction level cover with traditional whole turnover policies |
| 29 July 2026 Credendo reported insured transactions up 11% to EUR 90.7 billion and described a dedicated Trade Credit Insurance business as one access point for shorter term risks [Credendo (July 2026)] | Simplifies entry for exporters needing cover alongside public export credit programs | Exporters consolidate short term and export finance needs with one counterpart |
| 2 November 2026 Coface reported net income of EUR 155.5 million with credit insurance revenue up 0.9% and softer pricing of 1.3% while record new business production continued [Coface (November 2026)] | Softer pricing keeps renewal terms favorable for policyholders | Policyholders use renewal windows to secure cover limits at attractive rates |
Source: Verified corporate disclosures and Future Market Insights analysis, 2026.
| Company | Core Positioning | Verified Activity & Source Attribution |
|---|---|---|
| Allianz Trade | Global leader in trade credit insurance with embedded payment solutions | On 27 October 2026 the company published an insolvency outlook projecting business insolvencies up 5% in 2026 and 1% in 2027 and described protection from buyer non payment as a core function of trade credit insurance [Allianz Trade (October 2026)] |
| Coface | Credit insurance paired with business information and debt collection | Q3 results showed continued strategic investment with debt collection up 28.1% and the Cedar Rose acquisition supporting Business Information growth [Coface (November 2026)] |
| Atradius | Global credit insurer with broad geographic spread | Reported 2025 revenue of EUR 2.6 billion and created a Lloyd’s syndicate to expand distribution [Atradius (March 2026)] |
| Credendo | Belgian group combining export credit and trade credit insurance | Insured transactions rose 11% from EUR 81.7 billion to EUR 90.7 billion in 2025 [Credendo (July 2026)] |
| Cesce | Spanish credit and surety insurer that serves as export credit agency for the state | Positioning only. Recent activity sits outside the source list. |
| Sinosure | Chinese state policy insurer for export credit | Fixed amount short term export policy terms cover buyer non payment and political risks with a two year claim filing window and a 60 day loss decision target [Sinosure (April 2026)] |
| Chubb | Global property and casualty group with a trade credit underwriting team | Positioning only. Recent activity sits outside the source list. |
Trade Credit Insurance Market Report Scope and Research Methodology
FMI sizes the trade credit insurance market by multiplying insured trade turnover in each country by the average premium rate charged per unit of cover. National insured trade totals and published insurer premium disclosures provide the cross-check. Whole turnover policies anchor the model because they hold the largest share and recur through annual renewals. Key account and excess of loss and single transaction covers convert to insured turnover equivalents so every policy type shares one volume basis. Premium revenue is counted in the country where the policyholder is domiciled. Segment and country figures sum to the global total in every year. Company disclosures verify product positioning and underwriting appetite rather than estimate proprietary company revenue.
| Coverage Field | Report Scope |
|---|---|
| Market definition | Premium revenue from insurance that protects sellers against buyer insolvency and protracted default and political and transfer risk and pre-shipment losses on domestic and export trade receivables. |
| Product types | Whole turnover / key account / excess of loss / single transaction |
| Variants | Buyer insolvency cover / protracted default cover / political and transfer risk cover / pre-shipment and other cover |
| Ingredients or materials included | Buyer credit limits and risk underwriting data and policy wording and claims and collections services |
| Packaging formats | Annual master policies / single-buyer or single-transaction certificates / top-up and excess layers |
| Distribution channels | Direct underwriter sales / insurance brokers / export credit agency channels / Lloyd's syndicates and coverholders |
| End users | Mid-market firms / large corporates / small and medium businesses / multinational groups |
| Exclusions | Surety bonds and guarantees / political risk cover for investments / consumer credit and mortgage insurance / factoring and receivables finance fees |
| Quantitative units | USD billion for value and insured turnover in USD billion for volume |
| Volume basis | Insured trade turnover with policy types converted to a common exposure basis |
| Value basis | Gross written premium in each country counted where the policyholder is domiciled |
| Regions covered | North America / Latin America / Western Europe / Eastern Europe / East Asia / South Asia and Pacific / Middle East and Africa |
| National coverage | United States / Germany / France / United Kingdom / Italy / Japan / South Korea |
| Companies covered | Allianz Trade / Coface / Atradius / Credendo / Cesce / Sinosure / Chubb |
Source: Future Market Insights analysis of the trade credit insurance market, 2026.
Research Sources and Bibliography
- Administrative Office of the U.S. Courts (October 2026). Bankruptcy Filings Increase 11.4 Percent [press release, 22 October 2026]. https://www.uscourts.gov/data-news/judiciary-news/2026/10/22/bankruptcy-filings-increase-114-percent
- Allianz Trade (June 2026). Allianz Trade teams up with Mastercard to better support B2B travel payments [press release, 30 June 2026]. https://www.allianz-trade.com/en_global/news-insights/news/allianz-trade-pay-mastercard.html
- Allianz Trade (October 2026). Global insolvencies are expected to grow by a further +1% in 2027 [press release, 27 October 2026]. https://www.allianz-trade.com/en_global/news-insights/news/insolvency-report-271026.html
- Atradius (March 2026). Atradius 2025: Strong performance in a complex environment [news release, 18 March 2026]. https://atradius.nl/kennisbank/news/atradius-2025-strong-performance-in-a-complex-environment
- Banca d’Italia (November 2026). Rapporto sulla stabilità finanziaria n. 2 2026 [report, 13 November 2026]. https://www.bancaditalia.it/media/notizia/rapporto-sulla-stabilit-finanziaria-n-2-2026/
- Banque de France (November 2026). Défaillances d’entreprises 2026-09 [statistical release, 6 November 2026]. https://www.banque-france.fr/fr/statistiques/entreprises/defaillances-dentreprises-2026-09
- Berne Union (September 2026). Berne Union & ICISA Business Confidence Index 2026 H2 [association publication, September 3, 2026]. https://berneunion.org/Articles/Details/1035/Berne-Union-ICISA-Business-Confidence-Index-2026-H2
- Berne Union (2026). Export Credit and Investment Insurance: Industry Trends 2025. https://berneunion.org/Stub/Display/396
- Berne Union (March 2026). New: Business Confidence Index in collaboration with ICISA [association publication, March 17, 2026]. https://berneunion.org/Articles/Details/1001/New-Business-Confidence-Index-in-collaboration-with-ICISA
- Coface (November 2026). Q3-2026 results: Coface delivers a solid net income of €155.5m in an increasingly uncertain environment [results release, 2 November 2026]. https://www.coface.com/news-economy-and-insights/q3-2026-results-coface-delivers-a-solid-net-income-of-155.5m-in-an-increasingly-uncertain-environment
- Credendo (August 2026). Annual Report 2025: Highlights [annual report excerpt, August 2026]. https://annualreport.credendo.com/wp-content/uploads/2026/08/credendo_annualreport2025_highlights.pdf
- Credendo (July 2026). Annual report 2025: solid performance in a challenging global environment [corporate news, 29 July 2026]. https://credendo.com/en/node/1304
- Destatis (November 2026). Unternehmensinsolvenzen im August 2026 [press release no. 398, 13 November 2026]. https://www.destatis.de/DE/Presse/Pressemitteilungen/2026/11/PD26_398_52411.html
- Insolvency Service (October 2026). Commentary Company Insolvency Statistics September 2026 [official statistics, 20 October 2026]. https://www.gov.uk/government/statistics/company-insolvencies-september-2026/commentary-company-insolvency-statistics-september-2026
- Korea Trade Insurance Corporation (K-SURE) (undated). Welcome Message [web page, accessed 17 November 2026]. https://www.ksure.or.kr/rh-en/cntnts/i-622/web.do
- Nippon Export and Investment Insurance (NEXI) (2025). Annual Report 2025 [annual report]. https://www.nexi.go.jp/corporate/booklet/pdf/annual2025-e.pdf
- Sinosure (April 2026). Short-Term Export Credit Insurance Inclusive Fixed-Amount Policy Terms [policy document, 14 April 2026]. https://sd.sinosure.com.cn/images/gywm/gsjj/xxpl/bxcpjbxx/2026/04/14/1493641194457214976.pdf
- UK Export Finance (July 2026). UK Export Finance and British Business Bank to launch joint scheme to support thousands of smaller exporters [government press release, July 12, 2026]. https://www.gov.uk/government/news/uk-export-finance-and-british-business-bank-to-launch-joint-scheme-to-support-thousands-of-smaller-exporters
- World Trade Organization (October 2026). Global Trade Outlook and Statistics, October 2026 Update: Executive Summary [report summary, October 2026]. https://www.wto.org/english/res_e/publications_e/global-trade-outlook-and-statistics_execsum_e.htm
Table of Content
- Key Takeaways
- Market Size and CAGR
- Top Growth Driver
- Fastest Growing Segment
- Leading Region
- Key Companies
- Emerging Opportunities
- Executive Summary
- Global Market Outlook
- Demand-side Trends
- Supply-side Trends
- Technology Roadmap Analysis
- Analysis and Recommendations
- Analyst Perspective (What is happening? Why now? What should investors know?)
- Key Questions Answered
- How large is the market?
- What is the CAGR?
- What are key trends?
- Which region dominates?
- Who are the leaders?
Read More...
- Market Overview
- Market Coverage / Taxonomy
- Market Definition / Scope / Limitations
- Research Methodology
- Chapter Orientation
- Analytical Lens and Working Hypotheses
- Market Structure, Signals, and Trend Drivers
- Benchmarking and Cross-market Comparability
- Market Sizing, Forecasting, and Opportunity Mapping
- Research Design and Evidence Framework
- Desk Research Programme (Secondary Evidence)
- Expert Input and Fieldwork (Primary Evidence)
- Tooling, Models, and Reference Databases
- Data Engineering and Model Build
- Quality Assurance and Audit Trail
- Market Background
- Market Dynamics (Drivers, Restraints, Opportunity, Trends)
- Scenario Forecast (Optimistic, Likely, Conservative)
- Impact Analysis
- AI Impact
- Sustainability Impact
- Regulatory Impact
- Technology Impact
- Consumer / Buyer Analysis
- Purchase Drivers
- Adoption Barriers
- Buyer Journey
- Opportunity Map Analysis
- Product Life Cycle Analysis
- Supply Chain Analysis
- Investment Feasibility Matrix
- Value Chain Analysis
- PESTLE and Porter's Analysis
- Regulatory Landscape
- Regional Parent Market Outlook
- Production and Consumption Statistics
- Import and Export Statistics
- Global Market Analysis and Forecast, 2021 to 2036
- Historical Market Size Value (USD Billion) Analysis, 2021 to 2025
- Current and Future Market Size Value (USD Billion) Projections, 2026 to 2036
- Y-o-Y Growth Trend Analysis
- Absolute $ Opportunity Analysis
- Global Market Pricing Analysis, 2021 to 2036
- Global Market Analysis and Forecast, By Policy Type, 2021 to 2036
- Introduction / Key Findings
- Historical Market Size Value (USD Billion) Analysis By Policy Type, 2021 to 2025
- Current and Future Market Size Value (USD Billion) Analysis and Forecast By Policy Type, 2026 to 2036
- Whole Turnover
- Key Account
- Excess of Loss
- Single Transaction
- Y-o-Y Growth Trend Analysis By Policy Type, 2021 to 2025
- Absolute $ Opportunity Analysis By Policy Type, 2026 to 2036
- Global Market Analysis and Forecast, By Risk Covered, 2021 to 2036
- Introduction / Key Findings
- Historical Market Size Value (USD Billion) Analysis By Risk Covered, 2021 to 2025
- Current and Future Market Size Value (USD Billion) Analysis and Forecast By Risk Covered, 2026 to 2036
- Buyer Insolvency
- Protracted Default
- Political and Transfer Risk
- Pre-Shipment and Other
- Y-o-Y Growth Trend Analysis By Risk Covered, 2021 to 2025
- Absolute $ Opportunity Analysis By Risk Covered, 2026 to 2036
- Global Market Analysis and Forecast, By Provider, 2021 to 2036
- Introduction / Key Findings
- Historical Market Size Value (USD Billion) Analysis By Provider, 2021 to 2025
- Current and Future Market Size Value (USD Billion) Analysis and Forecast By Provider, 2026 to 2036
- Private Insurers
- Export Credit Agencies
- Specialty and Lloyd's Markets
- Captives and Mutuals
- Y-o-Y Growth Trend Analysis By Provider, 2021 to 2025
- Absolute $ Opportunity Analysis By Provider, 2026 to 2036
- Global Market Analysis and Forecast, By Customer Size, 2021 to 2036
- Introduction / Key Findings
- Historical Market Size Value (USD Billion) Analysis By Customer Size, 2021 to 2025
- Current and Future Market Size Value (USD Billion) Analysis and Forecast By Customer Size, 2026 to 2036
- Mid-Market
- Large Corporates
- Small and Medium Businesses
- Multinational Groups
- Y-o-Y Growth Trend Analysis By Customer Size, 2021 to 2025
- Absolute $ Opportunity Analysis By Customer Size, 2026 to 2036
- Global Market Analysis and Forecast, By Region, 2021 to 2036
- Introduction
- Historical Market Size Value (USD Billion) Analysis By Region, 2021 to 2025
- Current Market Size Value (USD Billion) Analysis and Forecast By Region, 2026 to 2036
- North America
- Latin America
- Western Europe
- Eastern Europe
- East Asia
- South Asia and Pacific
- Middle East and Africa
- Market Attractiveness Analysis By Region
- North America Market Analysis and Forecast, By Country, 2021 to 2036
- Historical Market Size Value (USD Billion) Trend Analysis By Market Taxonomy, 2021 to 2025
- Market Size Value (USD Billion) Forecast By Market Taxonomy, 2026 to 2036
- By Country
- United States
- Canada
- By Policy Type
- By Risk Covered
- By Provider
- By Customer Size
- By Country
- Market Attractiveness Analysis
- By Country
- By Policy Type
- By Risk Covered
- By Provider
- By Customer Size
- Key Takeaways
- Latin America Market Analysis and Forecast, By Country, 2021 to 2036
- Historical Market Size Value (USD Billion) Trend Analysis By Market Taxonomy, 2021 to 2025
- Market Size Value (USD Billion) Forecast By Market Taxonomy, 2026 to 2036
- By Country
- Brazil
- Mexico
- Argentina
- Chile
- By Policy Type
- By Risk Covered
- By Provider
- By Customer Size
- By Country
- Market Attractiveness Analysis
- By Country
- By Policy Type
- By Risk Covered
- By Provider
- By Customer Size
- Key Takeaways
- Western Europe Market Analysis and Forecast, By Country, 2021 to 2036
- Historical Market Size Value (USD Billion) Trend Analysis By Market Taxonomy, 2021 to 2025
- Market Size Value (USD Billion) Forecast By Market Taxonomy, 2026 to 2036
- By Country
- Germany
- France
- United Kingdom
- Italy
- Spain
- Benelux
- Nordics
- By Policy Type
- By Risk Covered
- By Provider
- By Customer Size
- By Country
- Market Attractiveness Analysis
- By Country
- By Policy Type
- By Risk Covered
- By Provider
- By Customer Size
- Key Takeaways
- Eastern Europe Market Analysis and Forecast, By Country, 2021 to 2036
- Historical Market Size Value (USD Billion) Trend Analysis By Market Taxonomy, 2021 to 2025
- Market Size Value (USD Billion) Forecast By Market Taxonomy, 2026 to 2036
- By Country
- Poland
- Czech Republic
- Romania
- Hungary
- By Policy Type
- By Risk Covered
- By Provider
- By Customer Size
- By Country
- Market Attractiveness Analysis
- By Country
- By Policy Type
- By Risk Covered
- By Provider
- By Customer Size
- Key Takeaways
- East Asia Market Analysis and Forecast, By Country, 2021 to 2036
- Historical Market Size Value (USD Billion) Trend Analysis By Market Taxonomy, 2021 to 2025
- Market Size Value (USD Billion) Forecast By Market Taxonomy, 2026 to 2036
- By Country
- China
- Japan
- South Korea
- By Policy Type
- By Risk Covered
- By Provider
- By Customer Size
- By Country
- Market Attractiveness Analysis
- By Country
- By Policy Type
- By Risk Covered
- By Provider
- By Customer Size
- Key Takeaways
- South Asia and Pacific Market Analysis and Forecast, By Country, 2021 to 2036
- Historical Market Size Value (USD Billion) Trend Analysis By Market Taxonomy, 2021 to 2025
- Market Size Value (USD Billion) Forecast By Market Taxonomy, 2026 to 2036
- By Country
- India
- ASEAN
- Australia and New Zealand
- By Policy Type
- By Risk Covered
- By Provider
- By Customer Size
- By Country
- Market Attractiveness Analysis
- By Country
- By Policy Type
- By Risk Covered
- By Provider
- By Customer Size
- Key Takeaways
- Middle East and Africa Market Analysis and Forecast, By Country, 2021 to 2036
- Historical Market Size Value (USD Billion) Trend Analysis By Market Taxonomy, 2021 to 2025
- Market Size Value (USD Billion) Forecast By Market Taxonomy, 2026 to 2036
- By Country
- GCC Countries
- South Africa
- Türkiye
- Israel
- By Policy Type
- By Risk Covered
- By Provider
- By Customer Size
- By Country
- Market Attractiveness Analysis
- By Country
- By Policy Type
- By Risk Covered
- By Provider
- By Customer Size
- Key Takeaways
- Key Countries Market Analysis
- United States
- Pricing Analysis
- Market Share Analysis, 2025
- By Policy Type
- By Risk Covered
- By Provider
- By Customer Size
- Canada
- Pricing Analysis
- Market Share Analysis, 2025
- By Policy Type
- By Risk Covered
- By Provider
- By Customer Size
- Brazil
- Pricing Analysis
- Market Share Analysis, 2025
- By Policy Type
- By Risk Covered
- By Provider
- By Customer Size
- Mexico
- Pricing Analysis
- Market Share Analysis, 2025
- By Policy Type
- By Risk Covered
- By Provider
- By Customer Size
- Argentina
- Pricing Analysis
- Market Share Analysis, 2025
- By Policy Type
- By Risk Covered
- By Provider
- By Customer Size
- Chile
- Pricing Analysis
- Market Share Analysis, 2025
- By Policy Type
- By Risk Covered
- By Provider
- By Customer Size
- Germany
- Pricing Analysis
- Market Share Analysis, 2025
- By Policy Type
- By Risk Covered
- By Provider
- By Customer Size
- France
- Pricing Analysis
- Market Share Analysis, 2025
- By Policy Type
- By Risk Covered
- By Provider
- By Customer Size
- United Kingdom
- Pricing Analysis
- Market Share Analysis, 2025
- By Policy Type
- By Risk Covered
- By Provider
- By Customer Size
- Italy
- Pricing Analysis
- Market Share Analysis, 2025
- By Policy Type
- By Risk Covered
- By Provider
- By Customer Size
- Spain
- Pricing Analysis
- Market Share Analysis, 2025
- By Policy Type
- By Risk Covered
- By Provider
- By Customer Size
- Benelux
- Pricing Analysis
- Market Share Analysis, 2025
- By Policy Type
- By Risk Covered
- By Provider
- By Customer Size
- Nordics
- Pricing Analysis
- Market Share Analysis, 2025
- By Policy Type
- By Risk Covered
- By Provider
- By Customer Size
- Poland
- Pricing Analysis
- Market Share Analysis, 2025
- By Policy Type
- By Risk Covered
- By Provider
- By Customer Size
- Czech Republic
- Pricing Analysis
- Market Share Analysis, 2025
- By Policy Type
- By Risk Covered
- By Provider
- By Customer Size
- Romania
- Pricing Analysis
- Market Share Analysis, 2025
- By Policy Type
- By Risk Covered
- By Provider
- By Customer Size
- Hungary
- Pricing Analysis
- Market Share Analysis, 2025
- By Policy Type
- By Risk Covered
- By Provider
- By Customer Size
- China
- Pricing Analysis
- Market Share Analysis, 2025
- By Policy Type
- By Risk Covered
- By Provider
- By Customer Size
- Japan
- Pricing Analysis
- Market Share Analysis, 2025
- By Policy Type
- By Risk Covered
- By Provider
- By Customer Size
- South Korea
- Pricing Analysis
- Market Share Analysis, 2025
- By Policy Type
- By Risk Covered
- By Provider
- By Customer Size
- India
- Pricing Analysis
- Market Share Analysis, 2025
- By Policy Type
- By Risk Covered
- By Provider
- By Customer Size
- ASEAN
- Pricing Analysis
- Market Share Analysis, 2025
- By Policy Type
- By Risk Covered
- By Provider
- By Customer Size
- Australia and New Zealand
- Pricing Analysis
- Market Share Analysis, 2025
- By Policy Type
- By Risk Covered
- By Provider
- By Customer Size
- GCC Countries
- Pricing Analysis
- Market Share Analysis, 2025
- By Policy Type
- By Risk Covered
- By Provider
- By Customer Size
- South Africa
- Pricing Analysis
- Market Share Analysis, 2025
- By Policy Type
- By Risk Covered
- By Provider
- By Customer Size
- Türkiye
- Pricing Analysis
- Market Share Analysis, 2025
- By Policy Type
- By Risk Covered
- By Provider
- By Customer Size
- Israel
- Pricing Analysis
- Market Share Analysis, 2025
- By Policy Type
- By Risk Covered
- By Provider
- By Customer Size
- United States
- Market Structure Analysis
- Competition Dashboard
- Competition Benchmarking
- Market Share Analysis of Top Players
- By Region
- By Policy Type
- By Risk Covered
- By Provider
- By Customer Size
- Emerging Startups
- Innovation Benchmarking
- Competition Analysis
- Competition Deep Dive
- Allianz Trade
- Overview
- Product Portfolio
- Profitability by Market Segments
- Sales Footprint
- Strategy Overview
- Marketing Strategy
- Product Strategy
- Channel Strategy
- Coface
- Atradius
- Credendo
- Cesce
- Sinosure
- Chubb
- Allianz Trade
- Case Studies
- Success Stories
- Recent Developments
- Competition Deep Dive
- Assumptions & Acronyms Used
List of Tables
- Table 1: Global Market Value (USD Billion) Forecast by Region, 2021 to 2036
- Table 2: Global Market Value (USD Billion) Forecast by Policy Type, 2021 to 2036
- Table 3: Global Market Value (USD Billion) Forecast by Risk Covered, 2021 to 2036
- Table 4: Global Market Value (USD Billion) Forecast by Provider, 2021 to 2036
- Table 5: Global Market Value (USD Billion) Forecast by Customer Size, 2021 to 2036
- Table 6: North America Market Value (USD Billion) Forecast by Country, 2021 to 2036
- Table 7: North America Market Value (USD Billion) Forecast by Policy Type, 2021 to 2036
- Table 8: North America Market Value (USD Billion) Forecast by Risk Covered, 2021 to 2036
- Table 9: North America Market Value (USD Billion) Forecast by Provider, 2021 to 2036
- Table 10: North America Market Value (USD Billion) Forecast by Customer Size, 2021 to 2036
- Table 11: Latin America Market Value (USD Billion) Forecast by Country, 2021 to 2036
- Table 12: Latin America Market Value (USD Billion) Forecast by Policy Type, 2021 to 2036
- Table 13: Latin America Market Value (USD Billion) Forecast by Risk Covered, 2021 to 2036
- Table 14: Latin America Market Value (USD Billion) Forecast by Provider, 2021 to 2036
- Table 15: Latin America Market Value (USD Billion) Forecast by Customer Size, 2021 to 2036
- Table 16: Western Europe Market Value (USD Billion) Forecast by Country, 2021 to 2036
- Table 17: Western Europe Market Value (USD Billion) Forecast by Policy Type, 2021 to 2036
- Table 18: Western Europe Market Value (USD Billion) Forecast by Risk Covered, 2021 to 2036
- Table 19: Western Europe Market Value (USD Billion) Forecast by Provider, 2021 to 2036
- Table 20: Western Europe Market Value (USD Billion) Forecast by Customer Size, 2021 to 2036
- Table 21: Eastern Europe Market Value (USD Billion) Forecast by Country, 2021 to 2036
- Table 22: Eastern Europe Market Value (USD Billion) Forecast by Policy Type, 2021 to 2036
- Table 23: Eastern Europe Market Value (USD Billion) Forecast by Risk Covered, 2021 to 2036
- Table 24: Eastern Europe Market Value (USD Billion) Forecast by Provider, 2021 to 2036
- Table 25: Eastern Europe Market Value (USD Billion) Forecast by Customer Size, 2021 to 2036
- Table 26: East Asia Market Value (USD Billion) Forecast by Country, 2021 to 2036
- Table 27: East Asia Market Value (USD Billion) Forecast by Policy Type, 2021 to 2036
- Table 28: East Asia Market Value (USD Billion) Forecast by Risk Covered, 2021 to 2036
- Table 29: East Asia Market Value (USD Billion) Forecast by Provider, 2021 to 2036
- Table 30: East Asia Market Value (USD Billion) Forecast by Customer Size, 2021 to 2036
- Table 31: South Asia and Pacific Market Value (USD Billion) Forecast by Country, 2021 to 2036
- Table 32: South Asia and Pacific Market Value (USD Billion) Forecast by Policy Type, 2021 to 2036
- Table 33: South Asia and Pacific Market Value (USD Billion) Forecast by Risk Covered, 2021 to 2036
- Table 34: South Asia and Pacific Market Value (USD Billion) Forecast by Provider, 2021 to 2036
- Table 35: South Asia and Pacific Market Value (USD Billion) Forecast by Customer Size, 2021 to 2036
- Table 36: Middle East and Africa Market Value (USD Billion) Forecast by Country, 2021 to 2036
- Table 37: Middle East and Africa Market Value (USD Billion) Forecast by Policy Type, 2021 to 2036
- Table 38: Middle East and Africa Market Value (USD Billion) Forecast by Risk Covered, 2021 to 2036
- Table 39: Middle East and Africa Market Value (USD Billion) Forecast by Provider, 2021 to 2036
- Table 40: Middle East and Africa Market Value (USD Billion) Forecast by Customer Size, 2021 to 2036
List of Figures
- Figure 1: Global Market Pricing Analysis
- Figure 2: Global Market Value (USD Billion) Forecast 2021-2036
- Figure 3: Global Market Value Share and BPS Analysis by Policy Type, 2026 and 2036
- Figure 4: Global Market Y-o-Y Growth Comparison by Policy Type, 2026-2036
- Figure 5: Global Market Attractiveness Analysis by Policy Type
- Figure 6: Global Market Value Share and BPS Analysis by Risk Covered, 2026 and 2036
- Figure 7: Global Market Y-o-Y Growth Comparison by Risk Covered, 2026-2036
- Figure 8: Global Market Attractiveness Analysis by Risk Covered
- Figure 9: Global Market Value Share and BPS Analysis by Provider, 2026 and 2036
- Figure 10: Global Market Y-o-Y Growth Comparison by Provider, 2026-2036
- Figure 11: Global Market Attractiveness Analysis by Provider
- Figure 12: Global Market Value Share and BPS Analysis by Customer Size, 2026 and 2036
- Figure 13: Global Market Y-o-Y Growth Comparison by Customer Size, 2026-2036
- Figure 14: Global Market Attractiveness Analysis by Customer Size
- Figure 15: Global Market Value (USD Billion) Share and BPS Analysis by Region, 2026 and 2036
- Figure 16: Global Market Y-o-Y Growth Comparison by Region, 2026-2036
- Figure 17: Global Market Attractiveness Analysis by Region
- Figure 18: North America Market Incremental Dollar Opportunity, 2026-2036
- Figure 19: Latin America Market Incremental Dollar Opportunity, 2026-2036
- Figure 20: Western Europe Market Incremental Dollar Opportunity, 2026-2036
- Figure 21: Eastern Europe Market Incremental Dollar Opportunity, 2026-2036
- Figure 22: East Asia Market Incremental Dollar Opportunity, 2026-2036
- Figure 23: South Asia and Pacific Market Incremental Dollar Opportunity, 2026-2036
- Figure 24: Middle East and Africa Market Incremental Dollar Opportunity, 2026-2036
- Figure 25: North America Market Value Share and BPS Analysis by Country, 2026 and 2036
- Figure 26: North America Market Value Share and BPS Analysis by Policy Type, 2026 and 2036
- Figure 27: North America Market Y-o-Y Growth Comparison by Policy Type, 2026-2036
- Figure 28: North America Market Attractiveness Analysis by Policy Type
- Figure 29: North America Market Value Share and BPS Analysis by Risk Covered, 2026 and 2036
- Figure 30: North America Market Y-o-Y Growth Comparison by Risk Covered, 2026-2036
- Figure 31: North America Market Attractiveness Analysis by Risk Covered
- Figure 32: North America Market Value Share and BPS Analysis by Provider, 2026 and 2036
- Figure 33: North America Market Y-o-Y Growth Comparison by Provider, 2026-2036
- Figure 34: North America Market Attractiveness Analysis by Provider
- Figure 35: North America Market Value Share and BPS Analysis by Customer Size, 2026 and 2036
- Figure 36: North America Market Y-o-Y Growth Comparison by Customer Size, 2026-2036
- Figure 37: North America Market Attractiveness Analysis by Customer Size
- Figure 38: Latin America Market Value Share and BPS Analysis by Country, 2026 and 2036
- Figure 39: Latin America Market Value Share and BPS Analysis by Policy Type, 2026 and 2036
- Figure 40: Latin America Market Y-o-Y Growth Comparison by Policy Type, 2026-2036
- Figure 41: Latin America Market Attractiveness Analysis by Policy Type
- Figure 42: Latin America Market Value Share and BPS Analysis by Risk Covered, 2026 and 2036
- Figure 43: Latin America Market Y-o-Y Growth Comparison by Risk Covered, 2026-2036
- Figure 44: Latin America Market Attractiveness Analysis by Risk Covered
- Figure 45: Latin America Market Value Share and BPS Analysis by Provider, 2026 and 2036
- Figure 46: Latin America Market Y-o-Y Growth Comparison by Provider, 2026-2036
- Figure 47: Latin America Market Attractiveness Analysis by Provider
- Figure 48: Latin America Market Value Share and BPS Analysis by Customer Size, 2026 and 2036
- Figure 49: Latin America Market Y-o-Y Growth Comparison by Customer Size, 2026-2036
- Figure 50: Latin America Market Attractiveness Analysis by Customer Size
- Figure 51: Western Europe Market Value Share and BPS Analysis by Country, 2026 and 2036
- Figure 52: Western Europe Market Value Share and BPS Analysis by Policy Type, 2026 and 2036
- Figure 53: Western Europe Market Y-o-Y Growth Comparison by Policy Type, 2026-2036
- Figure 54: Western Europe Market Attractiveness Analysis by Policy Type
- Figure 55: Western Europe Market Value Share and BPS Analysis by Risk Covered, 2026 and 2036
- Figure 56: Western Europe Market Y-o-Y Growth Comparison by Risk Covered, 2026-2036
- Figure 57: Western Europe Market Attractiveness Analysis by Risk Covered
- Figure 58: Western Europe Market Value Share and BPS Analysis by Provider, 2026 and 2036
- Figure 59: Western Europe Market Y-o-Y Growth Comparison by Provider, 2026-2036
- Figure 60: Western Europe Market Attractiveness Analysis by Provider
- Figure 61: Western Europe Market Value Share and BPS Analysis by Customer Size, 2026 and 2036
- Figure 62: Western Europe Market Y-o-Y Growth Comparison by Customer Size, 2026-2036
- Figure 63: Western Europe Market Attractiveness Analysis by Customer Size
- Figure 64: Eastern Europe Market Value Share and BPS Analysis by Country, 2026 and 2036
- Figure 65: Eastern Europe Market Value Share and BPS Analysis by Policy Type, 2026 and 2036
- Figure 66: Eastern Europe Market Y-o-Y Growth Comparison by Policy Type, 2026-2036
- Figure 67: Eastern Europe Market Attractiveness Analysis by Policy Type
- Figure 68: Eastern Europe Market Value Share and BPS Analysis by Risk Covered, 2026 and 2036
- Figure 69: Eastern Europe Market Y-o-Y Growth Comparison by Risk Covered, 2026-2036
- Figure 70: Eastern Europe Market Attractiveness Analysis by Risk Covered
- Figure 71: Eastern Europe Market Value Share and BPS Analysis by Provider, 2026 and 2036
- Figure 72: Eastern Europe Market Y-o-Y Growth Comparison by Provider, 2026-2036
- Figure 73: Eastern Europe Market Attractiveness Analysis by Provider
- Figure 74: Eastern Europe Market Value Share and BPS Analysis by Customer Size, 2026 and 2036
- Figure 75: Eastern Europe Market Y-o-Y Growth Comparison by Customer Size, 2026-2036
- Figure 76: Eastern Europe Market Attractiveness Analysis by Customer Size
- Figure 77: East Asia Market Value Share and BPS Analysis by Country, 2026 and 2036
- Figure 78: East Asia Market Value Share and BPS Analysis by Policy Type, 2026 and 2036
- Figure 79: East Asia Market Y-o-Y Growth Comparison by Policy Type, 2026-2036
- Figure 80: East Asia Market Attractiveness Analysis by Policy Type
- Figure 81: East Asia Market Value Share and BPS Analysis by Risk Covered, 2026 and 2036
- Figure 82: East Asia Market Y-o-Y Growth Comparison by Risk Covered, 2026-2036
- Figure 83: East Asia Market Attractiveness Analysis by Risk Covered
- Figure 84: East Asia Market Value Share and BPS Analysis by Provider, 2026 and 2036
- Figure 85: East Asia Market Y-o-Y Growth Comparison by Provider, 2026-2036
- Figure 86: East Asia Market Attractiveness Analysis by Provider
- Figure 87: East Asia Market Value Share and BPS Analysis by Customer Size, 2026 and 2036
- Figure 88: East Asia Market Y-o-Y Growth Comparison by Customer Size, 2026-2036
- Figure 89: East Asia Market Attractiveness Analysis by Customer Size
- Figure 90: South Asia and Pacific Market Value Share and BPS Analysis by Country, 2026 and 2036
- Figure 91: South Asia and Pacific Market Value Share and BPS Analysis by Policy Type, 2026 and 2036
- Figure 92: South Asia and Pacific Market Y-o-Y Growth Comparison by Policy Type, 2026-2036
- Figure 93: South Asia and Pacific Market Attractiveness Analysis by Policy Type
- Figure 94: South Asia and Pacific Market Value Share and BPS Analysis by Risk Covered, 2026 and 2036
- Figure 95: South Asia and Pacific Market Y-o-Y Growth Comparison by Risk Covered, 2026-2036
- Figure 96: South Asia and Pacific Market Attractiveness Analysis by Risk Covered
- Figure 97: South Asia and Pacific Market Value Share and BPS Analysis by Provider, 2026 and 2036
- Figure 98: South Asia and Pacific Market Y-o-Y Growth Comparison by Provider, 2026-2036
- Figure 99: South Asia and Pacific Market Attractiveness Analysis by Provider
- Figure 100: South Asia and Pacific Market Value Share and BPS Analysis by Customer Size, 2026 and 2036
- Figure 101: South Asia and Pacific Market Y-o-Y Growth Comparison by Customer Size, 2026-2036
- Figure 102: South Asia and Pacific Market Attractiveness Analysis by Customer Size
- Figure 103: Middle East and Africa Market Value Share and BPS Analysis by Country, 2026 and 2036
- Figure 104: Middle East and Africa Market Value Share and BPS Analysis by Policy Type, 2026 and 2036
- Figure 105: Middle East and Africa Market Y-o-Y Growth Comparison by Policy Type, 2026-2036
- Figure 106: Middle East and Africa Market Attractiveness Analysis by Policy Type
- Figure 107: Middle East and Africa Market Value Share and BPS Analysis by Risk Covered, 2026 and 2036
- Figure 108: Middle East and Africa Market Y-o-Y Growth Comparison by Risk Covered, 2026-2036
- Figure 109: Middle East and Africa Market Attractiveness Analysis by Risk Covered
- Figure 110: Middle East and Africa Market Value Share and BPS Analysis by Provider, 2026 and 2036
- Figure 111: Middle East and Africa Market Y-o-Y Growth Comparison by Provider, 2026-2036
- Figure 112: Middle East and Africa Market Attractiveness Analysis by Provider
- Figure 113: Middle East and Africa Market Value Share and BPS Analysis by Customer Size, 2026 and 2036
- Figure 114: Middle East and Africa Market Y-o-Y Growth Comparison by Customer Size, 2026-2036
- Figure 115: Middle East and Africa Market Attractiveness Analysis by Customer Size
- Figure 116: Global Market - Tier Structure Analysis
- Figure 117: Global Market - Company Share Analysis
Frequently Asked Questions
How big is the Trade Credit Insurance Market in 2026?
Future Market Insights estimates the global trade credit insurance market at USD 18.8 billion in 2026 as exporters and lenders rely on insured receivables to protect working capital.
Which policy type leads the Trade Credit Insurance Market?
Whole turnover policies lead with 48.0% of market revenue because insurers cover an entire buyer portfolio under a single contract. Key account cover follows at 20.0% and excess of loss at 18.0% while single transaction policies hold 14.0%.
Which risk covered leads the Trade Credit Insurance Market?
Buyer insolvency cover holds 58.0% of revenue and remains the anchor of most policies. Protracted default accounts for 20.0% and political and transfer risk for 12.0% while pre-shipment and other cover makes up 10.0%.
Which provider type leads the Trade Credit Insurance Market?
Private insurers account for 70.0% of revenue backed by global underwriting networks and buyer credit databases. Export credit agencies hold 14.0% and specialty and Lloyd’s markets 10.0% while captives and mutuals contribute 6.0%.
Which customer size leads the Trade Credit Insurance Market?
Mid-market companies lead with 30.0% of revenue followed by large corporates at 28.0% and small and medium businesses at 26.0%. Multinational groups represent 16.0% and rely on tailored global programs.
Which countries are expected to grow fastest in the Trade Credit Insurance Market?
The United States is projected to grow fastest at a 5.9% CAGR through 2036 followed by Italy at 5.0% and the United Kingdom at 4.9%. France and South Korea advance at 4.5% and 4.8% while Germany and Japan grow at 4.4% and 3.9%.
What drives demand for trade credit insurance?
Demand rests on rising cross-border trade volumes and lenders that accept insured receivables as collateral for working capital lines. Exporters also use cover to enter new buyer markets with confidence while corporates adopt it to protect margins against payment delays.
Preview the report firsthand - request a free sample
Get SampleGet the brochure for pricing and purchase details.
Get PDF
