

- Market Size (2026)
- USD 920.4 Bn
- Forecast (2036)
- USD 3533.8 Bn
- CAGR (2026 to 2036)
- 14.4%
How big is the Green Bond Market in 2026?
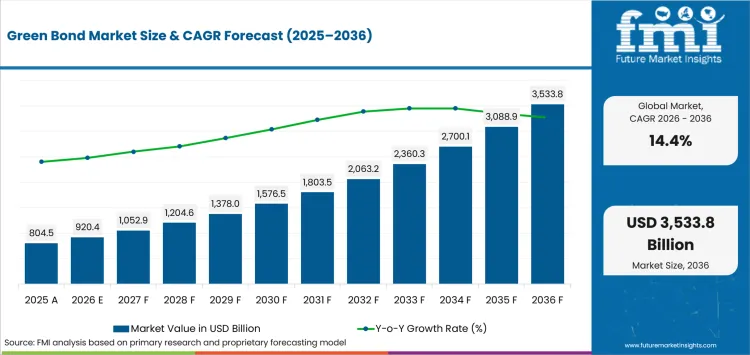
USD 920.4 billion in 2026 and USD 3533.8 billion by 2036 at a 14.4% CAGR.
Demand for green bond is projected to increase the valuation from USD 920.4 billion in 2026 to USD 3533.8 billion by 2036 at a 14.4% CAGR. Expansion is supported by increasing adoption of standardized sustainable finance frameworks that improve issuer credibility and investor transparency. ICMA's 2025 Green Bond Principles provide guidance on proceeds allocation, project evaluation and reporting practices, helping establish a common framework for green bond issuance. This standardization reduces information asymmetry and supports broader participation across sustainable finance markets.
Regional growth is influenced by issuance structures and market access mechanisms. Japan's Ministry of Finance scheduled four climate transition bond issuances across five-year and ten-year maturities in 2026, demonstrating continued sovereign support for sustainable finance and providing regular issuance opportunities for investors. The United States relies more heavily on fragmented municipal and corporate issuance channels, requiring investors to evaluate a wider range of issuers and reporting standards. This difference in issuance structure can affect market accessibility and investment allocation despite comparable long-term growth prospects.
Key Takeaways of Green Bond Market
- Clearer issuance rules and eligible project pipelines support labeled debt across corporate and sovereign borrowers.
- Corporate green bonds are projected to account for 42.0% of issuer-type activity in 2026 owing to recurring capital programs.
- Renewable energy is expected to represent 39.0% of application demand in 2026 supported by measurable operating indicators.
- Institutional investors are estimated at 64.0% participation in 2026 due to portfolio scale and reporting requirements.
- External review and recurring allocation reports raise execution costs for issuers with limited internal data systems.
- HSBC Holdings plc, JPMorgan Chase & Co., Bank of America Corporation, BNP Paribas S.A., Citigroup Inc., Crédit Agricole CIB, Standard Chartered PLC and Deutsche Bank AG support issuance and distribution.
Analyst Perspective
"Green bond credibility depends on governance linking eligibility with allocation records and impact reporting. Issuers establishing this sequence before launch reduce review delays and support repeat institutional participation."
- Rahul Pandita, Principal Consultant, Future Market Insights
How is the Green Bond Market segmented?
The Green Bond Market is segmented by issuer type, application, investor type, maturity, end use and region.
The green bond market is segmented by issuer type, application, investor type, maturity, end use and region. Issuer types include corporate, sovereign, supranational, development bank and asset-backed bonds. Applications cover renewable energy, buildings, transportation, water and waste management. Investors include institutions, banks and retail participants. Maturities range from short-term notes to long-term bonds.
What supports corporate green bonds within the issuer type category?
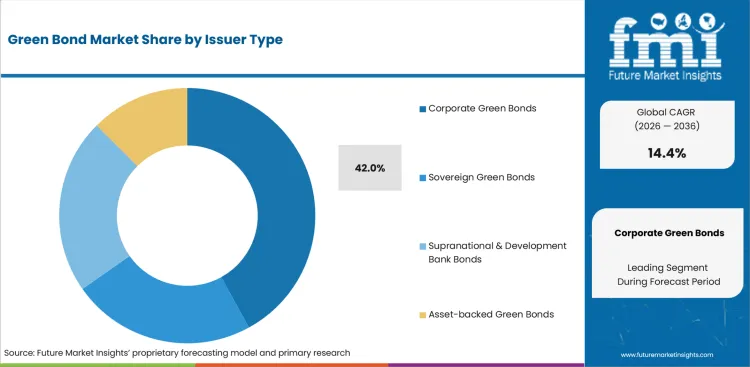
Corporate issuers connect proceeds with recurring capital programs and established reporting systems. Their debt calendars can finance renewable power, efficient buildings and industrial water treatment assets across several allocation periods.
- By issuer type, corporate green bonds are projected to hold 42.0% share in 2026 owing to repeat financing across utilities and financial institutions.
- Established debt programs support recurring issuance without rebuilding every internal approval route. Borrowers must preserve project-level allocation evidence and comparable impact records throughout each bond term.
What makes renewable energy central to the application category?
Renewable energy projects provide measurable capacity and generation indicators for use-of-proceeds reporting. Project pools can combine solar or wind facilities with battery energy storage systems across financing periods.
- Based on application, renewable energy is expected to represent 39.0% share in 2026 supported by established project pipelines and operating metrics.
- Standard Chartered reported 355 green projects across ten thematic areas in January 2026. Diverse project pools improve asset aggregation, although banks must retain category-level allocation controls.
How do institutional investors evaluate green bond participation?
Pension funds, insurers and asset managers evaluate green bonds within fixed-income mandates. Their portfolio scale supports larger transactions, while allocation reports satisfy governance requirements.
- In 2026, institutional investors are estimated to lead investor type with 64.0% share attributable to duration needs and traceable proceeds records.
- JPMorganChase lists annual sustainable bond reports for outstanding securities. Recurring disclosures support portfolio reviews, although investment committees also assess credit quality and taxonomy alignment.
What role do long-term bonds play within the maturity category?
Renewable power and efficient buildings produce benefits across long operating lives. Smart grid technology also requires repayment schedules aligned with gradual infrastructure utilization.
- By maturity, long-term bonds are forecast to represent 57.0% share in 2026 driven by tenors matching infrastructure and utility asset lives.
- Long maturities give pension and insurance portfolios investable duration. Issuers must balance project lives against interest-rate exposure, secondary liquidity and continuing proceeds documentation.
What are the drivers, restraints and opportunities in the Green Bond Market?
Standardized frameworks improve comparability, verification burdens raise execution costs and asset-backed structures widen access for smaller eligible projects.
- Driver: Standardized principles and sovereign benchmarks give investors clearer issuance and disclosure expectations.
- Restraint: External review and taxonomy alignment add legal work alongside recurring reporting expenses.
- Opportunity: Asset-backed structures can aggregate smaller eligible assets into securities suited to institutional review.
Standardized principles reduce information gaps before settlement. The European Commission published external-reviewer rules in June 2026 under the European Green Bond Standard. These procedures help issuers prepare climate tech assets for regulated labels and independent assessment.
First-time issuers must identify eligible assets before tracking allocations across the bond term. Taxonomy differences increase legal work across jurisdictions. Consistent records for green building materials reduce repeated classification work in property-backed transactions.
Asset-backed structures can pool mortgages or infrastructure receivables. Verified performance data for water treatment assets support due diligence across smaller loans. Originators need standardized eligibility records before aggregation produces investable securities.
Which country CAGRs are profiled in the Green Bond Market?
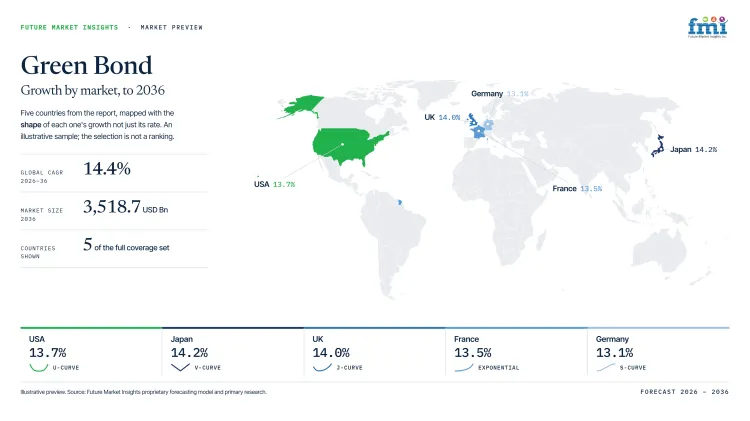
| Country | CAGR |
|---|---|
| Japan | 14.2% |
| United Kingdom | 14.0% |
| United States | 13.7% |
| France | 13.5% |
| Germany | 13.1% |
How do country-level CAGRs compare in the Green Bond Market?
The country CAGRs span 1.1 percentage points and measure forecast pace rather than current market size. Their narrow spacing conceals different sovereign calendars, municipal channels and disclosure duties.
- Japan pairs recurring climate-transition auctions with domestic guidance for labeled sovereign and corporate debt.
- The United Kingdom uses green gilts to provide long-duration pricing references for institutional portfolios.
- The United States distributes issuance across corporate borrowers and numerous state or local authorities.
- France reinforces investor familiarity with repeated sovereign transactions and annual allocation reporting.
- Germany maintains maturity comparison using Green Federal securities and conventional twin bonds.
Comparable CAGRs can produce different market entry conditions. The full report provides country-level CAGR analysis across North America, Latin America, Europe, East Asia, South Asia and Pacific, and the Middle East and Africa.
Country-wise Analysis
- Japan uses scheduled climate-transition auctions and domestic guidance to provide banks with recurring references across five-year and ten-year maturities. The Ministry of Finance scheduled four climate-transition issues for fiscal 2026 and fiscal 2027. The green bond market in Japan is projected to expand at 14.2% CAGR through 2036, although corporate issuers must document transition eligibility and allocation outcomes before domestic underwriters convert eligible projects into completed orders.
- The United Kingdom combines a centralized sovereign framework with institutional demand for long-duration labeled debt across pension and insurance portfolios. The Debt Management Office updated its financing framework in November 2025 and completed the Green Gilt 2037 syndication in March 2026. Green bond demand in the United Kingdom is forecast to rise at 14.0% CAGR, although corporate issuers must align expenditure records with allocation reports before investors approve repeat transactions.
- United States issuance spans corporate borrowers and state or local authorities instead of one centralized sovereign green program. The Municipal Securities Rulemaking Board reported a second consecutive record for new municipal issue volume in 2025. Adoption is estimated to expand at 13.7% CAGR through 2036, although varied disclosure practices raise comparison costs for public infrastructure and EV charging stations across fragmented regional channels.
- France supports labeled debt with recurring Green OAT issuance and annual reporting linked to eligible national expenditures. Agence France Trésor reported more than 400 final investors in its fifth sovereign green bond transaction during April 2026. The green bond market in France is projected to record 13.5% CAGR, although issuers must classify public infrastructure projects consistently before asset pools secure repeat institutional orders.
- Germany uses Green Federal securities with conventional twin bonds to maintain comparable pricing across maturities and secondary trading. The German Finance Agency reported eight securities in the Green Bund curve by December 2025 and added a fifteen-year security in March 2026. Green bond sales in Germany are forecast to expand at 13.1% CAGR, although issuers must preserve eligible expenditures and allocation records before benchmark access supports recurring orders.
Who are the notable companies in the Green Bond Market?
HSBC Holdings plc, JPMorgan Chase & Co., Bank of America Corporation, BNP Paribas S.A., Citigroup Inc., Crédit Agricole CIB, Standard Chartered PLC and Deutsche Bank AG are active in this market.
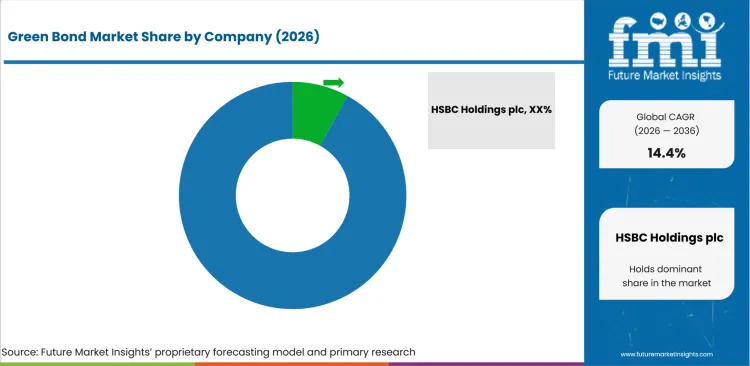
Competition is concentrated among banks with global debt execution, issuer governance and post-issuance reporting capacity. Regional specialists compete through local investor networks and taxonomy knowledge. New entrants need review processes linking project finance with renewable energy certificates.
- HSBC Holdings plc, JPMorgan Chase & Co., Bank of America Corporation and Citigroup Inc. combine global execution with recurring issuer reporting.
- BNP Paribas S.A., Crédit Agricole CIB and Deutsche Bank AG support European framework design, placement and distribution.
- Standard Chartered PLC connects cross-border issuance with eligible project pools across Asia, Africa and the Middle East.
Competitive Benchmarking: Green Bond Market
| Company | Framework and Issuance | Structuring and Distribution | Eligible Project Coverage | Geographic Reach |
|---|---|---|---|---|
| HSBC Holdings plc | High | High | High | Global |
| JPMorgan Chase & Co. | Medium | High | High | Global |
| Bank of America Corporation | High | High | High | Global |
| BNP Paribas S.A. | High | High | High | Global |
| Citigroup Inc. | High | High | High | Global |
| Crédit Agricole CIB | Medium | High | High | Global |
| Standard Chartered PLC | High | High | High | Asia, Africa and Middle East |
| Deutsche Bank AG | High | High | High | Europe and Global |
Key Developments in the Green Bond Market
- In February 2026, Deutsche Bank issued its inaugural European Green Bond for EU Taxonomy-aligned residential green building loans.
- In December 2025, Citigroup Inc. consolidated its green and social frameworks under one Sustainable Issuance Framework.
- In November 2025, BNP Paribas S.A. reported three blue private placements under its updated Green Bond Framework.
Key Players in the Green Bond Market
Global Diversified Banking Platforms
- HSBC Holdings plc
- JPMorgan Chase & Co.
- Bank of America Corporation
- Citigroup Inc.
European Sustainable Finance Platforms
- BNP Paribas S.A.
- Crédit Agricole CIB
- Deutsche Bank AG
Cross-border Emerging-Market Platform
- Standard Chartered PLC
Green Bond Market - Report Scope
| Coverage field | Report scope |
|---|---|
| Market breakdown | By issuer type, application, investor type, maturity, end use and region. |
| Quantitative Units | Revenue in USD billion and CAGR in %. |
| Market Definition | The market covers labeled use-of-proceeds debt financing eligible environmental projects across corporate, sovereign, municipal, supranational and asset-backed routes. |
| Regions Covered | North America, Latin America, Europe, East Asia, South Asia and Pacific, and Middle East and Africa. |
| Countries Covered | Japan, United Kingdom, United States, France, Germany, and 20+ countries included in the full report. |
| Key Companies Profiled | HSBC Holdings plc, JPMorgan Chase & Co., Bank of America Corporation, BNP Paribas S.A., Citigroup Inc., Crédit Agricole CIB, Standard Chartered PLC and Deutsche Bank AG. |
| Forecast Period | 2026 to 2036. |
| Approach | Primary and secondary research with market triangulation. |
Green Bond Market - Research Methodology
| Method | Approach |
|---|---|
| Primary Research | FMI analysts gathered input from manufacturers, service providers, technology developers, distributors, end users, procurement teams, and subject-matter experts. Interviews examined purchasing decisions, product or service evaluation, adoption barriers, approval requirements, pricing considerations, and expectations for technical or commercial support. Respondents were also asked what evidence is required before a trial, pilot, or initial order develops into regular purchasing. |
| Desk Research | Desk research covered government statistics, regulatory publications, trade data, industry associations, technical literature, standards, company filings, product information, and official corporate announcements. Sources were reviewed for relevance, publication date, geographic coverage, and consistency with the defined market scope. Claims relating to performance, applications, approvals, capacity, investment, and commercial activity were retained only when supported by credible public evidence. |
| Market Sizing and Forecasting | The market model combined the baseline value with historical performance, segment structure, pricing and volume indicators, adoption levels, company participation, and country-level demand conditions. Forecast assumptions considered economic activity, investment trends, regulatory developments, technology adoption, purchasing cycles, supply availability, and barriers to wider market use. Segment and regional estimates were reconciled before the final market total was calculated. |
| Data Validation | Estimates were checked against multiple independent indicators, including public data, company activity, trade patterns, industry developments, and findings from primary interviews. Validation also tested whether products, services, applications, and company revenues fell within the defined market boundaries. Adjacent categories, unsupported claims, overlapping revenues, and activities without direct market relevance were excluded to reduce double counting and maintain consistency across segments and countries. |
Green Bond Market by Segments
Green Bond Market segmented by Issuer Type:
- Corporate Green Bonds
- Non-financial Corporations
- Financial Institutions
- Utility Companies
- Sovereign Green Bonds
- Central Government Bonds
- Government Agency Bonds
- Municipal Green Bonds
- Supranational & Development Bank Bonds
- Multilateral Development Banks
- Regional Development Banks
- Export Credit Agencies
- Asset-backed Green Bonds
- Green Mortgage-backed Securities
- Green Infrastructure-backed Securities
- Green Project-backed Bonds
Green Bond Market segmented by Application:
- Renewable Energy
- Solar Energy Projects
- Wind Energy Projects
- Hydropower Projects
- Green Buildings
- Commercial Green Buildings
- Residential Green Buildings
- Energy-efficient Renovation
- Clean Transportation
- Electric Vehicle Infrastructure
- Railway Projects
- Public Transit Systems
- Water & Waste Management
- Wastewater Treatment
- Recycling Infrastructure
- Water Conservation Projects
Green Bond Market segmented by Investor Type:
- Institutional Investors
- Pension Funds
- Insurance Companies
- Asset Management Firms
- Banks & Financial Institutions
- Commercial Banks
- Investment Banks
- Development Finance Institutions
- Retail Investors
- High-net-worth Individuals
- Individual Investors
- Online Investment Platforms
Green Bond Market segmented by Maturity:
- Long-term Bonds
- 10 to 15 Years
- 15 to 20 Years
- Above 20 Years
- Medium-term Bonds
- 5 to 7 Years
- 7 to 10 Years
- 10 Years
- Short-term Bonds
- Less than 3 Years
- 3 to 5 Years
- Green Notes
Green Bond Market segmented by End Use:
- Energy & Utilities
- Renewable Power Generation
- Energy Storage Projects
- Grid Modernization
- Government & Public Sector
- Smart City Projects
- Public Infrastructure
- Climate Adaptation Projects
- Real Estate & Construction
- Sustainable Buildings
- Green Commercial Developments
- Eco-friendly Housing
- Transportation & Industrial
- Low-carbon Manufacturing
- Clean Mobility Projects
- Sustainable Logistics
Green Bond Market by Region:
- North America
- United States
- Canada
- Mexico
- Latin America
- Brazil
- Chile
- Rest of Latin America
- Western Europe
- Germany
- United Kingdom
- Italy
- Spain
- France
- Nordics
- Benelux
- Rest of Western Europe
- Eastern Europe
- Russia
- Poland
- Hungary
- Balkan and Baltic States
- Rest of Eastern Europe
- East Asia
- China
- Japan
- South Korea
- South Asia and Pacific
- India
- ASEAN
- Australia and New Zealand
- Rest of South Asia and Pacific
- Middle East and Africa
- Kingdom of Saudi Arabia
- Other GCC Countries
- Türkiye
- South Africa
- Other African Union Countries
- Rest of Middle East and Africa
Research Sources and Bibliography
- International Capital Market Association. (2025, June). Green Bond Principles 2025.
- Ministry of Finance, Japan. (2026, March 30). Issuance of the Interest-Bearing Government Bonds (FY2026).
- Standard Chartered PLC. (2026, January 8). Standard Chartered issues inaugural EUR 1bn Green Bond.
- JPMorgan Chase & Co. (2026). 2025 Annual Sustainable Bond Report.
- European Commission. (2026, June 17). European Green Bond Standard Regulation - Implementing and delegated acts.
- UK Debt Management Office. (2026). Green Gilts.
- Municipal Securities Rulemaking Board. (2026, January 9). 2025 Municipal Market Year in Review.
- Agence France Trésor. (2026, April 14). Launch of the new Green OAT 3.80% 25 June 2037.
- German Finance Agency. (2026). Green Federal securities issuance.
- Deutsche Bank AG. (2026, February 10). Deutsche Bank successfully issues European Green Bond.
- Citigroup Inc. (2025, December). Sustainable Debt Securities.
- BNP Paribas S.A. (2025, November 21). Blue Horizons: the rise of blue bonds in sustainable investment.
- HSBC Holdings plc. (2024, October). Green Financing Framework.
- Bank of America Corporation. (2025, November). Sustainable Bond Report 2025.
- Crédit Agricole Group. (2025). Green Bond Report 2025.
This bibliography is provided for reader reference and is not exhaustive. The full report contains the complete reference list and detailed citations.
This Report Answers
- What are the 2026 and 2036 values?
- Which issuer type leads in 2026?
- Why does renewable energy lead applications?
- How do institutions shape reporting?
- Why do long-term bonds lead maturities?
- How do national routes affect entry?
- Which banks structure green bonds?
- What raises first-time issuer costs?
- How do asset-backed structures aggregate projects?
Frequently Asked Questions
How big is the Green Bond Market in 2026?
In 2026, the Green Bond Market is valued at USD 920.4 billion across corporate, sovereign and asset-backed issuance routes. Eligible project pipelines support transaction volume, while allocation controls and impact reporting determine whether institutions provide sustained institutional repeat participation.
What is the CAGR of the Green Bond Market from 2026 to 2036?
The Green Bond Market is projected to expand at 14.4% CAGR from 2026 to 2036 and reach USD 3533.8 billion. Forecast realization depends on issuers converting eligible assets into transparent securities without weakening external review or continuing reporting.
Which issuer type is projected to account for 42.0% of the Green Bond Market?
Corporate green bonds are projected to account for 42.0% of the Green Bond Market by issuer type in 2026. Recurring capital programs and established reporting systems support repeat issuance across major utilities, regulated financial institutions and large non-financial corporations.
How much value is the Green Bond Market projected to add between 2026 and 2036?
The increase reflects larger eligible project pipelines and wider institutional distribution, although consistent post-issuance reporting remains necessary for repeat investor participation.
Which companies are active in the Green Bond Market?
Companies active in the Green Bond Market include HSBC Holdings plc, JPMorgan Chase & Co., Bank of America Corporation and BNP Paribas S.A. Citigroup Inc., Crédit Agricole CIB, Standard Chartered PLC and Deutsche Bank AG support issuance and distribution.
Preview the report firsthand - request a free sample
Get SampleGet the brochure for pricing and purchase details.
Get PDFTable of Content
- Key Takeaways
- Market Size and CAGR
- Top Growth Driver
- Fastest Growing Segment
- Leading Region
- Key Companies
- Emerging Opportunities
- Executive Summary
- Global Market Outlook
- Demand-side Trends
- Supply-side Trends
- Technology Roadmap Analysis
- Analysis and Recommendations
- Analyst Perspective (What is happening? Why now? What should investors know?)
- Key Questions Answered
- How large is the market?
- What is the CAGR?
- What are key trends?
- Which region dominates?
- Who are the leaders?
- Market Overview
- Market Coverage / Taxonomy
- Market Definition / Scope / Limitations
- Research Methodology
- Chapter Orientation
- Analytical Lens and Working Hypotheses
- Market Structure, Signals, and Trend Drivers
- Benchmarking and Cross-market Comparability
- Market Sizing, Forecasting, and Opportunity Mapping
- Research Design and Evidence Framework
- Desk Research Programme (Secondary Evidence)
- Expert Input and Fieldwork (Primary Evidence)
- Tooling, Models, and Reference Databases
- Data Engineering and Model Build
- Quality Assurance and Audit Trail
- Market Background
- Market Dynamics (Drivers, Restraints, Opportunity, Trends)
- Scenario Forecast (Optimistic, Likely, Conservative)
- Impact Analysis
- AI Impact
- Sustainability Impact
- Regulatory Impact
- Technology Impact
- Consumer / Buyer Analysis
- Purchase Drivers
- Adoption Barriers
- Buyer Journey
- Opportunity Map Analysis
- Product Life Cycle Analysis
- Supply Chain Analysis
- Investment Feasibility Matrix
- Value Chain Analysis
- PESTLE and Porter's Analysis
- Regulatory Landscape
- Regional Parent Market Outlook
- Production and Consumption Statistics
- Import and Export Statistics
- Global Market Analysis and Forecast, 2021 to 2036
- Historical Market Size Value (USD Billion) Analysis, 2021 to 2025
- Current and Future Market Size Value (USD Billion) Projections, 2026 to 2036
- Y-o-Y Growth Trend Analysis
- Absolute $ Opportunity Analysis
- Global Market Pricing Analysis, 2021 to 2036
- Global Market Analysis and Forecast, By Issuer Type, 2021 to 2036
- Introduction / Key Findings
- Historical Market Size Value (USD Billion) Analysis By Issuer Type, 2021 to 2025
- Current and Future Market Size Value (USD Billion) Analysis and Forecast By Issuer Type, 2026 to 2036
- Corporate Green Bonds
- Non-financial Corporations
- Financial Institutions
- Utility Companies
- Sovereign Green Bonds
- Central Government Bonds
- Government Agency Bonds
- Municipal Green Bonds
- Supranational & Development Bank Bonds
- Multilateral Development Banks
- Regional Development Banks
- Export Credit Agencies
- Asset-backed Green Bonds
- Green Mortgage-backed Securities
- Green Infrastructure-backed Securities
- Green Project-backed Bonds
- Corporate Green Bonds
- Y-o-Y Growth Trend Analysis By Issuer Type, 2021 to 2025
- Absolute $ Opportunity Analysis By Issuer Type, 2026 to 2036
- Global Market Analysis and Forecast, By Application, 2021 to 2036
- Introduction / Key Findings
- Historical Market Size Value (USD Billion) Analysis By Application, 2021 to 2025
- Current and Future Market Size Value (USD Billion) Analysis and Forecast By Application, 2026 to 2036
- Renewable Energy
- Solar Energy Projects
- Wind Energy Projects
- Hydropower Projects
- Green Buildings
- Commercial Green Buildings
- Residential Green Buildings
- Energy-efficient Renovation
- Clean Transportation
- Electric Vehicle Infrastructure
- Railway Projects
- Public Transit Systems
- Water & Waste Management
- Wastewater Treatment
- Recycling Infrastructure
- Water Conservation Projects
- Renewable Energy
- Y-o-Y Growth Trend Analysis By Application, 2021 to 2025
- Absolute $ Opportunity Analysis By Application, 2026 to 2036
- Global Market Analysis and Forecast, By Investor Type, 2021 to 2036
- Introduction / Key Findings
- Historical Market Size Value (USD Billion) Analysis By Investor Type, 2021 to 2025
- Current and Future Market Size Value (USD Billion) Analysis and Forecast By Investor Type, 2026 to 2036
- Institutional Investors
- Pension Funds
- Insurance Companies
- Asset Management Firms
- Banks & Financial Institutions
- Commercial Banks
- Investment Banks
- Development Finance Institutions
- Retail Investors
- High-net-worth Individuals
- Individual Investors
- Online Investment Platforms
- Institutional Investors
- Y-o-Y Growth Trend Analysis By Investor Type, 2021 to 2025
- Absolute $ Opportunity Analysis By Investor Type, 2026 to 2036
- Global Market Analysis and Forecast, By Maturity, 2021 to 2036
- Introduction / Key Findings
- Historical Market Size Value (USD Billion) Analysis By Maturity, 2021 to 2025
- Current and Future Market Size Value (USD Billion) Analysis and Forecast By Maturity, 2026 to 2036
- Long-term Bonds
- 10-15 Years
- 15-20 Years
- Above 20 Years
- Medium-term Bonds
- 5-7 Years
- 7-10 Years
- 10 Years
- Short-term Bonds
- Less than 3 Years
- 3-5 Years
- Green Notes
- Long-term Bonds
- Y-o-Y Growth Trend Analysis By Maturity, 2021 to 2025
- Absolute $ Opportunity Analysis By Maturity, 2026 to 2036
- Global Market Analysis and Forecast, By End Use, 2021 to 2036
- Introduction / Key Findings
- Historical Market Size Value (USD Billion) Analysis By End Use, 2021 to 2025
- Current and Future Market Size Value (USD Billion) Analysis and Forecast By End Use, 2026 to 2036
- Energy & Utilities
- Renewable Power Generation
- Energy Storage Projects
- Grid Modernization
- Government & Public Sector
- Smart City Projects
- Public Infrastructure
- Climate Adaptation Projects
- Real Estate & Construction
- Sustainable Buildings
- Green Commercial Developments
- Eco-friendly Housing
- Transportation & Industrial
- Low-carbon Manufacturing
- Clean Mobility Projects
- Sustainable Logistics
- Energy & Utilities
- Y-o-Y Growth Trend Analysis By End Use, 2021 to 2025
- Absolute $ Opportunity Analysis By End Use, 2026 to 2036
- Global Market Analysis and Forecast, By Region, 2021 to 2036
- Introduction
- Historical Market Size Value (USD Billion) Analysis By Region, 2021 to 2025
- Current Market Size Value (USD Billion) Analysis and Forecast By Region, 2026 to 2036
- North America
- Latin America
- Western Europe
- Eastern Europe
- East Asia
- South Asia and Pacific
- Middle East & Africa
- Market Attractiveness Analysis By Region
- North America Market Analysis and Forecast, By Country, 2021 to 2036
- Historical Market Size Value (USD Billion) Trend Analysis By Market Taxonomy, 2021 to 2025
- Market Size Value (USD Billion) Forecast By Market Taxonomy, 2026 to 2036
- By Country
- USA
- Canada
- By Issuer Type
- By Application
- By Investor Type
- By Maturity
- By End Use
- By Country
- Market Attractiveness Analysis
- By Country
- By Issuer Type
- By Application
- By Investor Type
- By Maturity
- By End Use
- Key Takeaways
- Latin America Market Analysis and Forecast, By Country
- Historical Market Size Value (USD Billion) Trend Analysis By Market Taxonomy, 2021 to 2025
- Market Size Value (USD Billion) Forecast By Market Taxonomy, 2026 to 2036
- By Country
- Brazil
- Mexico
- Chile
- Rest of Latin America
- By Issuer Type
- By Application
- By Investor Type
- By Maturity
- By End Use
- By Country
- Market Attractiveness Analysis
- By Country
- By Issuer Type
- By Application
- By Investor Type
- By Maturity
- By End Use
- Key Takeaways
- Western Europe Market Analysis and Forecast, By Country
- Historical Market Size Value (USD Billion) Trend Analysis By Market Taxonomy, 2021 to 2025
- Market Size Value (USD Billion) Forecast By Market Taxonomy, 2026 to 2036
- By Country
- Germany
- UK
- Italy
- Spain
- France
- Nordic
- BENELUX
- Rest of Western Europe
- By Issuer Type
- By Application
- By Investor Type
- By Maturity
- By End Use
- By Country
- Market Attractiveness Analysis
- By Country
- By Issuer Type
- By Application
- By Investor Type
- By Maturity
- By End Use
- Key Takeaways
- Eastern Europe Market Analysis and Forecast, By Country
- Historical Market Size Value (USD Billion) Trend Analysis By Market Taxonomy, 2021 to 2025
- Market Size Value (USD Billion) Forecast By Market Taxonomy, 2026 to 2036
- By Country
- Russia
- Poland
- Hungary
- Balkan & Baltic
- Rest of Eastern Europe
- By Issuer Type
- By Application
- By Investor Type
- By Maturity
- By End Use
- By Country
- Market Attractiveness Analysis
- By Country
- By Issuer Type
- By Application
- By Investor Type
- By Maturity
- By End Use
- Key Takeaways
- East Asia Market Analysis and Forecast, By Country
- Historical Market Size Value (USD Billion) Trend Analysis By Market Taxonomy, 2021 to 2025
- Market Size Value (USD Billion) Forecast By Market Taxonomy, 2026 to 2036
- By Country
- China
- Japan
- South Korea
- By Issuer Type
- By Application
- By Investor Type
- By Maturity
- By End Use
- By Country
- Market Attractiveness Analysis
- By Country
- By Issuer Type
- By Application
- By Investor Type
- By Maturity
- By End Use
- Key Takeaways
- South Asia and Pacific Market Analysis and Forecast, By Country
- Historical Market Size Value (USD Billion) Trend Analysis By Market Taxonomy, 2021 to 2025
- Market Size Value (USD Billion) Forecast By Market Taxonomy, 2026 to 2036
- By Country
- India
- ASEAN
- Australia & New Zealand
- Rest of South Asia and Pacific
- By Issuer Type
- By Application
- By Investor Type
- By Maturity
- By End Use
- By Country
- Market Attractiveness Analysis
- By Country
- By Issuer Type
- By Application
- By Investor Type
- By Maturity
- By End Use
- Key Takeaways
- Middle East & Africa Market Analysis and Forecast, By Country
- Historical Market Size Value (USD Billion) Trend Analysis By Market Taxonomy, 2021 to 2025
- Market Size Value (USD Billion) Forecast By Market Taxonomy, 2026 to 2036
- By Country
- Kingdom of Saudi Arabia
- Other GCC Countries
- Türkiye
- South Africa
- Other African Union
- Rest of Middle East & Africa
- By Issuer Type
- By Application
- By Investor Type
- By Maturity
- By End Use
- By Country
- Market Attractiveness Analysis
- By Country
- By Issuer Type
- By Application
- By Investor Type
- By Maturity
- By End Use
- Key Takeaways
- Key Countries Market Analysis
- USA
- Pricing Analysis
- Market Share Analysis, 2025
- By Issuer Type
- By Application
- By Investor Type
- By Maturity
- By End Use
- Canada
- Pricing Analysis
- Market Share Analysis, 2025
- By Issuer Type
- By Application
- By Investor Type
- By Maturity
- By End Use
- Mexico
- Pricing Analysis
- Market Share Analysis, 2025
- By Issuer Type
- By Application
- By Investor Type
- By Maturity
- By End Use
- Brazil
- Pricing Analysis
- Market Share Analysis, 2025
- By Issuer Type
- By Application
- By Investor Type
- By Maturity
- By End Use
- Chile
- Pricing Analysis
- Market Share Analysis, 2025
- By Issuer Type
- By Application
- By Investor Type
- By Maturity
- By End Use
- Germany
- Pricing Analysis
- Market Share Analysis, 2025
- By Issuer Type
- By Application
- By Investor Type
- By Maturity
- By End Use
- UK
- Pricing Analysis
- Market Share Analysis, 2025
- By Issuer Type
- By Application
- By Investor Type
- By Maturity
- By End Use
- Italy
- Pricing Analysis
- Market Share Analysis, 2025
- By Issuer Type
- By Application
- By Investor Type
- By Maturity
- By End Use
- Spain
- Pricing Analysis
- Market Share Analysis, 2025
- By Issuer Type
- By Application
- By Investor Type
- By Maturity
- By End Use
- France
- Pricing Analysis
- Market Share Analysis, 2025
- By Issuer Type
- By Application
- By Investor Type
- By Maturity
- By End Use
- India
- Pricing Analysis
- Market Share Analysis, 2025
- By Issuer Type
- By Application
- By Investor Type
- By Maturity
- By End Use
- ASEAN
- Pricing Analysis
- Market Share Analysis, 2025
- By Issuer Type
- By Application
- By Investor Type
- By Maturity
- By End Use
- Australia & New Zealand
- Pricing Analysis
- Market Share Analysis, 2025
- By Issuer Type
- By Application
- By Investor Type
- By Maturity
- By End Use
- China
- Pricing Analysis
- Market Share Analysis, 2025
- By Issuer Type
- By Application
- By Investor Type
- By Maturity
- By End Use
- Japan
- Pricing Analysis
- Market Share Analysis, 2025
- By Issuer Type
- By Application
- By Investor Type
- By Maturity
- By End Use
- South Korea
- Pricing Analysis
- Market Share Analysis, 2025
- By Issuer Type
- By Application
- By Investor Type
- By Maturity
- By End Use
- Russia
- Pricing Analysis
- Market Share Analysis, 2025
- By Issuer Type
- By Application
- By Investor Type
- By Maturity
- By End Use
- Poland
- Pricing Analysis
- Market Share Analysis, 2025
- By Issuer Type
- By Application
- By Investor Type
- By Maturity
- By End Use
- Hungary
- Pricing Analysis
- Market Share Analysis, 2025
- By Issuer Type
- By Application
- By Investor Type
- By Maturity
- By End Use
- Kingdom of Saudi Arabia
- Pricing Analysis
- Market Share Analysis, 2025
- By Issuer Type
- By Application
- By Investor Type
- By Maturity
- By End Use
- Türkiye
- Pricing Analysis
- Market Share Analysis, 2025
- By Issuer Type
- By Application
- By Investor Type
- By Maturity
- By End Use
- South Africa
- Pricing Analysis
- Market Share Analysis, 2025
- By Issuer Type
- By Application
- By Investor Type
- By Maturity
- By End Use
- USA
- Market Structure Analysis
- Competition Dashboard
- Competition Benchmarking
- Market Share Analysis of Top Players
- By Regional
- By Issuer Type
- By Application
- By Investor Type
- By Maturity
- By End Use
- Emerging Startups
- Innovation Benchmarking
- Competition Analysis
- Competition Deep Dive
- HSBC Holdings plc
- Overview
- Product Portfolio
- Profitability by Market Segments
- Sales Footprint
- Strategy Overview
- Marketing Strategy
- Product Strategy
- Channel Strategy
- JPMorgan Chase & Co.
- Bank of America Corporation
- BNP Paribas S.A.
- Citigroup Inc.
- Industrial and Commercial Bank of China
- Crédit Agricole CIB
- Standard Chartered PLC
- Barclays PLC
- Deutsche Bank AG
- HSBC Holdings plc
- Case Studies
- Success Stories
- Recent Developments
- Competition Deep Dive
- Assumptions & Acronyms Used


