Tunnel Visibility Monitors Market Size, Share, and Forecast Outlook 2025 to 2035

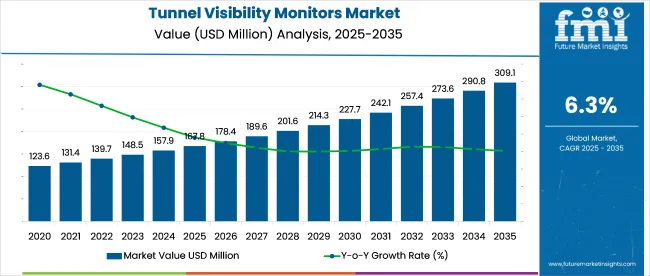
The tunnel visibility monitors market is projected to grow from USD 167.8 million in 2025 to USD 309.1 million by 2035, expanding at a CAGR of 6.3%. This upward trend is driven by rising infrastructure safety mandates and smart transportation initiatives, especially in regions upgrading aging tunnels or developing new underground transit routes.
Quick Stats in Tunnel Visibility Monitors Market

  • Market Size (2025): USD 167.8 million
  • Market Forecast (2035): USD 309.1 million
  • CAGR (2025 to 2035): 6.3%
  • Top Tunnel Type: Urban Road Tunnel (31% share in 2025)
  • Leading Product Type: Integrated (38% share in 2025)
  • Top Growing Country: UAE (7.0% CAGR)

Tunnel Visibility Monitors Market

Attribute Detail
Market Size (2025) USD 167.8 million
Market Size (2035) USD 309.1 million
CAGR (2025 to 2035) 6.3%

By 2025, over 65% of new tunnels longer than 500 meters are being designed with embedded visibility monitoring systems. Asia Pacific leads installation volume, driven by rapid urbanization and over 2,000 km of new metro and expressway tunnels under development across China, India, and Southeast Asia. Europe follows closely, with visibility monitoring now mandatory in all TEN-T core network tunnels exceeding 300 meters in length.

Retrofitting efforts are surging in North America, where more than 40% of federally funded tunnel renovation projects between 2020 and 2024 included optical visibility sensors. Multi-sensor systems that combine visibility with particulate and gas detection are gaining adoption, accounting for over 50% of procurements in advanced economies. Demand is further fueled by smart traffic control systems and AI-driven tunnel automation platforms that rely on accurate visibility data for operational decision-making.

The tunnel visibility monitors market plays a specialized role across multiple infrastructure and safety-driven sectors. Within the global tunnel safety systems market, valued at over USD 12 billion, visibility monitoring accounts for 3-4% of investments, largely due to rising concerns over tunnel fire and smoke events.

In intelligent transportation infrastructure, where global spending exceeds USD 100 billion, around 2-3% is directed toward visibility sensors that support automated traffic management. Approximately 4-6% of tunnel ventilation system budgets are allocated to visibility integration, enhancing responsiveness during low-visibility scenarios.

In the broader environmental monitoring equipment market, valued at USD 25 billion, these monitors hold a 1.5-2% share. Even within the USD 40 billion smart city surveillance sector, 1-2% goes toward visibility tools in tunnel and underground transit networks.

Analyzing Tunnel Visibility Monitors Market by Top Investment Segments

The market is growing due to rising investments in smart infrastructure, tunnel safety compliance, and automated traffic management. Integrated systems, transmissometer-based technologies, and urban tunnel applications are emerging as the most lucrative areas for manufacturers and integrators worldwide.
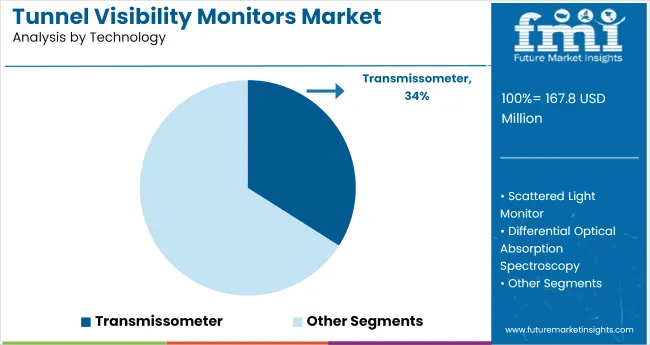
Transmissometers Lead Technology Segment with 34% Market Share

Tunnel Visibility Monitors Market Analysis By Technology

Transmissometer-based visibility monitors are anticipated to capture 34% of global market share by 2025. These sensors offer real-time measurement of light extinction in tunnels, enabling accurate visibility data under varying air quality conditions.
  • Transmissometers deliver consistent performance in fog, smoke, and particulate-heavy environments.
  • Infrastructure upgrades across Europe and East Asia drive adoption in long-distance tunnel networks.
  • Regulatory mandates for tunnel air quality monitoring enhance segment growth prospects.

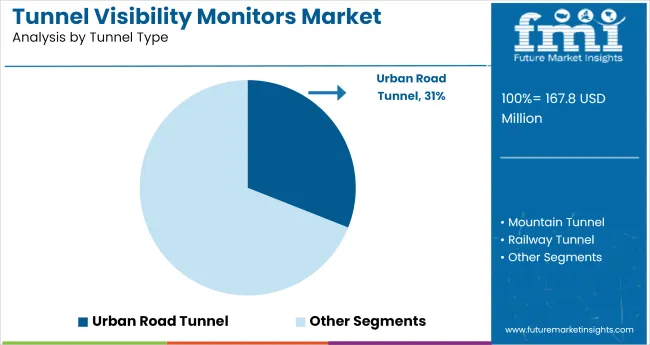
Urban Road Tunnels Drive Tunnel Type Segment with 31% Share

Tunnel Visibility Monitors Market Analysis By Tunnel Type

Urban road tunnels are projected to hold 31% share in the tunnel type segment by 2025. Rapid urbanization, dense traffic flow, and increased focus on commuter safety are fueling installations of visibility systems in city-based tunnel networks.
  • Smart city projects are prioritizing real-time tunnel visibility tracking and emergency readiness.
  • Municipal transportation agencies are upgrading legacy systems to meet safety norms.
  • Adoption is strong in metros across Asia-Pacific and North America due to urban traffic congestion.

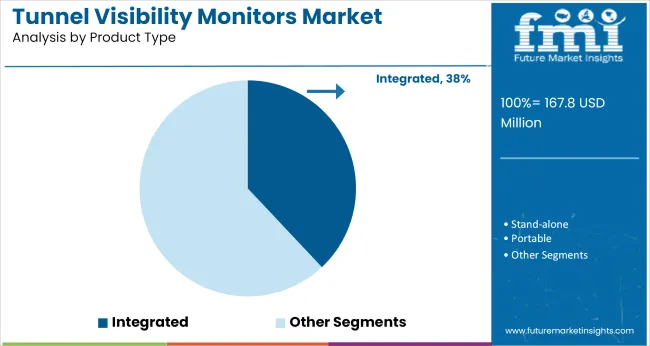
Integrated Monitors Dominate Product Segment with 38% Share

Tunnel Visibility Monitors Market Analysis By Product Type

Integrated visibility monitors are expected to lead with 38% share of the global market by 2025. These compact systems combine detection, data processing, and communication in a single unit, reducing installation time and system complexity.

  • Integration improves data accuracy and response times in hazardous tunnel conditions.
  • Demand is rising from EPC firms designing turnkey tunnel safety infrastructure.
  • Reduced maintenance and compatibility with SCADA systems improve cost-efficiency for operators.

Top Tunnel Visibility Monitors Market Dynamics

Deployment of tunnel visibility monitors is being driven by enforced safety regulations and the transition to hybrid sensor systems. These changes have reduced installation timelines, improved ventilation control, and minimized closure durations. Data-integrated monitoring now plays a critical role in infrastructure investment and operational continuity.

Retrofit Acceleration Reshapes Installation Landscape

Retrofit demand climbed 41% in Q1 2025 as tunnel operators responded to enforced visibility standards across corridors over 800 m. Install timelines dropped by 33% through modular system use, allowing upgrades to complete in under a week. Fan response lag improved from 14 to 8 seconds post-integration with real-time sensors.

Multi-zone calibration reduced inspection failures by 29%, removing costly rework. Ventilation systems linked with monitor-triggered VMS achieved 62% coverage in new installations. Retrofit-driven contracts now account for over 55% of annual unit sales, reshaping vendor strategies toward short-installation, high-accuracy deployments across mid-cap urban and intercity tunnels.

Hybrid Sensor Systems Drive Ventilation Efficiency

Hybrid visibility monitors combining nephelometric and transmissometric modules gained 36% market share growth year-on-year. Tunnels over 1.5 km saw false visibility alarms drop 22% after hybrid adoption. Real-time control via dual-mode systems tightened fan airflow modulation by 16%, reducing daily runtime by 2.7 hours.

Long-span installations reported calibration drift rates below 1.2% per quarter, minimizing recalibration cycles and lowering operational overhead. Integration with existing PLCs cut compatibility issues by 31%. Operators now select hybrid sensors not only for visibility accuracy but also for energy savings, enabling sub-14-month ROI in corridors with variable air quality patterns.
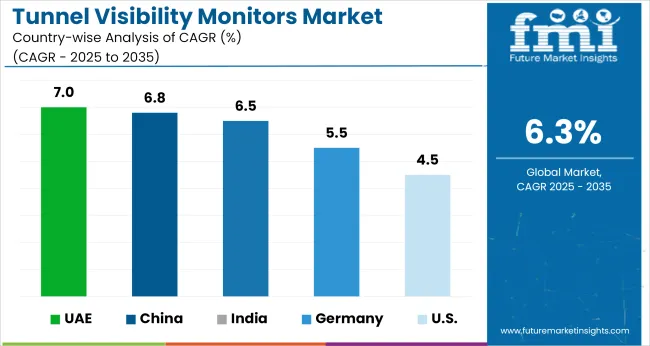
Top Countries Developing, Integrating, Supplying, and Adopting Tunnel Visibility Monitors

Country Wise Analysis Of Tunnel Visibility Monitors Market

Countries CAGR (2025 to 2035)
UAE 7.0%
China 6.8%
India 6.5%
Germany 5.5%
United States 4.5%

The global industry is projected to expand globally at a CAGR of 6.3% from 2025 to 2035. The UAE leads among the key profiled countries with a CAGR of 7.0%, surpassing the global average by 11%, driven by rapid tunnel infrastructure expansion and smart monitoring initiatives across the GCC. China follows at 6.8%, benefiting from large-scale BRICS-funded transport corridors and consistent air quality compliance programs.

India also performs above the global trend at 6.5%, supported by new tunnel projects and the rollout of safety mandates in road and metro development. In contrast, OECD economies lag behind the global baseline. Germany posts a CAGR of 5.5%, while the United States trails at 4.5%, reflecting gaps of 13% and 29%, respectively. Slower replacement rates, fewer new tunnel developments, and complex regulatory approval cycles contribute to these slower growth trajectories in mature Western markets.

The report provides insights across 40+ countries. The five below are highlighted for their strategic influence and growth trajectory.

UAE Leads GCC in Tunnel Visibility Modernization

The UAE market is forecast to grow at a CAGR of 7.0% from 2025 to 2035, driven by regulatory mandates for visibility monitoring in over 70% of newly constructed tunnels between 2025 and 2030. From 2020 to 2024, demand remained limited to metro systems and select highway tunnels.

Post-2025, adoption is rising due to smart mobility investments under the AED 50 billion infrastructure modernization plan. Visibility monitors are being deployed alongside smoke sensors across the Etihad Rail and Dubai-Al Ain corridor tunnels.

  • More than 200 km of tunnel infrastructure to be upgraded by 2030
  • Mandatory visibility sensors included in RTA tender specifications
  • 30% increase in procurement contracts from logistics and oil sectors

China Tunnel Safety Demand Driven by Expressway Expansion

China is projected to expand at a CAGR of 6.8% through 2035, supported by over 1,500 tunnel construction projects underway as of 2024. Between 2020 and 2024, deployment was focused on expressways in Guizhou, Sichuan, and Shaanxi provinces.

From 2025, demand is expected to grow rapidly due to national guidelines mandating particulate and fog detection in tunnels exceeding 500 meters. Visibility monitors are now embedded in 35% of smart highway control systems.

  • 12th Five-Year Plan targets full tunnel automation by 2030
  • Over 70% of expressway tunnels require visibility upgrades
  • Domestic suppliers scaling up to meet 20% annual demand growth

India Accelerates Tunnel Monitoring Through National Infrastructure Push

India is expected to grow at a CAGR of 6.5% from 2025 to 2035. During 2020 to 2024, installations were limited to urban metros in Delhi, Mumbai, and Kolkata. From 2025 onward, growth will be driven by more than 300 tunnel projects under Bharatmala Phase II and 45 strategic tunnels in the Northeast and J&K. Visibility monitors are being mandated in all tunnels exceeding 300 meters, with NHAI allocating INR 7,000 crore for tunnel automation through 2030.

  • Annual installation rates expected to rise by 18% YOY
  • Strongest demand seen in Jammu-Srinagar and Himachal corridors
  • Over 1,200 km of tunnels to be fitted with real-time sensors

Germany Invests in Retrofitting Tunnels with Smart Visibility Monitors

Germany is projected to grow at a CAGR of 5.5% from 2025 to 2035. Between 2020 and 2024, adoption was largely linked to compliance with EU TEN-T corridor norms, covering more than 500 tunnels nationwide. From 2025, market expansion will be supported by revisions to the Road Tunnel Safety Directive and €270 million allocated by BMVI for tunnel digitization. Over 40% of existing tunnels are expected to undergo retrofits.

  • Sensor upgrades prioritized in Bavaria, Saxony, and NRW
  • EU co-funded programs accelerating safety system rollouts
  • Visibility monitors now included in 60% of highway tenders

United States Expands Tunnel Visibility Monitoring Under Federal Safety Plan

The USA market is set to grow at a CAGR of 4.5% through 2035. From 2020 to 2024, installations were focused on the Lincoln Tunnel, Caldecott Tunnel, and along I-70. Looking forward, demand is rising due to the USD 11 billion earmarked under the Bipartisan Infrastructure Law for tunnel safety. Visibility monitoring systems are now required in 55% of federally supported tunnel projects, covering smoke, luminance, and particulate sensing.
  • More than 2,700 tunnels need sensor upgrades nationwide
  • SCADA-compatible units favored in DOT procurement
  • 22% increase in visibility system bids between 2022 and 2024

Leading Tunnel Visibility Monitors Providers

Tunnel Visibility Monitors Market Analysis By Company

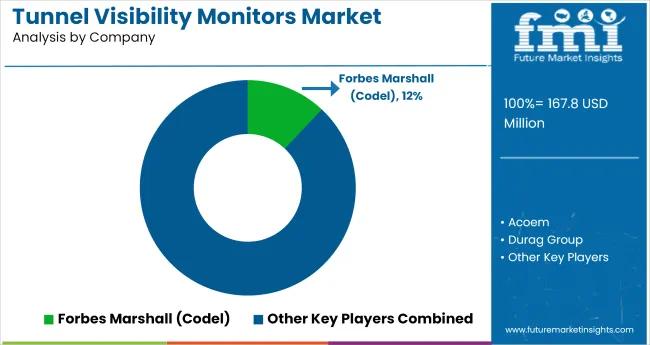
The tunnel visibility monitors market is moderately consolidated, with specialized European manufacturers leading innovation in particulate and visibility sensing. Forbes Marshall (CODEL) holds a 12% global market share and leads the market with its VM10 and VM20 monitors, widely deployed across Asia, Europe, and the Middle East.

These models are favored for their robustness in dusty tunnel environments and low-maintenance optics. SICK AG, a close competitor, offers VISIC100SF sensors integrated in German and USA tunnel infrastructure, known for real-time digital feedback and multi-parameter air monitoring.

Acoem and Sigrist Photometer AG are gaining adoption in EU infrastructure upgrades, particularly for integrated air quality and visibility systems. Competitive edge now depends on modular calibration, automatic lens cleaning, and compliance with EN 50298 tunnel safety standards.

Recent Tunnel Visibility Monitors Industry News

In 2024, ABB Australia secured a contract to supply its ACS880 series low-harmonic drives for tunnel ventilation systems in Sydney’s M4-M5 Link Tunnels (WestConnex project). The drives ensure reliable exhaust fan control, energy efficiency, and compliance in the city’s largest road infrastructure tunnel.

Leading Players in Tunnel Visibility Monitors Market

  • Forbes Marshall (Codel)
  • Acoem
  • Durag Group
  • SICK AG
  • Endress+Hauser
  • SigristPhotometer AG

Report Coverage and Scope Summary

Report Attributes Details
Market Size (2025) USD 167.8 million
Projected Market Size (2035) USD 309.1 million
CAGR (2025 to 2035) 6.3%
Base Year for Estimation 2024
Historical Period 2020 to 2024
Projections Period 2025 to 2035
Quantitative Units USD million for market value
Technologies Analyzed (Segment 1) Transmissometers, Scattered Light Monitors, Differential Optical Absorption Spectroscopy, LIDAR-Based Systems
Tunnel Types Analyzed (Segment 2) Urban Road Tunnels, Mountain Tunnels, Railway Tunnels, Metro Tunnels, Utility Tunnels, Others
Product Types Analyzed (Segment 3) Stand-Alone Systems, Integrated Systems, Portable Systems
Regions Covered North America, Latin America, Eastern Europe, Western Europe, South Asia & Pacific, East Asia, Middle East & Africa
Countries Covered United States, Canada, Germany, United Kingdom, France, Italy, Spain, China, India, Japan, South Korea, Australia, Brazil, Mexico, Argentina, Saudi Arabia, UAE, South Africa
Key Players Forbes Marshall (Codel), Acoem, Durag Group, SICK AG, Endress+Hauser, Sigrist Photometer AG
Additional Attributes Dollar sales by technology and tunnel type, rising emphasis on tunnel safety and air quality compliance, rapid deployment in urban infrastructure, and increasing demand for LIDAR and integrated visibility solutions.

Key Segments

By Technology:

The market is segmented into transmissometers, scattered light monitors, differential optical absorption spectroscopy, and LIDAR-based systems. Each technology offers a distinct method of measuring particulate matter and visibility conditions inside tunnels.

By Tunnel Type:

Tunnel visibility systems are deployed across urban road tunnels, mountain tunnels, railway tunnels, metro tunnels, utility tunnels, and other tunnel types. Variations in tunnel structure and usage influence monitoring system requirements.

By Product Type:

Based on configuration, the market includes stand-alone, integrated, and portable visibility monitoring systems. These cater to different installation scopes and maintenance capabilities.

By Region:

Regional analysis spans North America, Latin America, Eastern Europe, Western Europe, South Asia & Pacific, East Asia, and the Middle East & Africa, highlighting differences in tunnel infrastructure development and environmental regulation.

Table of Content

  1. Executive Summary
    • Global Market Outlook
    • Demand-side Trends
    • Supply-side Trends
    • Technology Roadmap Analysis
    • Analysis and Recommendations
  2. Market Overview
    • Market Coverage/Taxonomy
    • Market Definition/Scope/Limitations
  3. Market Background
    • Market Dynamics
      • Drivers
      • Restraints
      • Opportunity
      • Trends
    • Scenario Forecast
      • Demand in Optimistic Scenario
      • Demand in Likely Scenario
      • Demand in Conservative Scenario
    • Opportunity Map Analysis
    • Product Life Cycle Analysis
    • Supply Chain Analysis
      • Supply Side Participants and their Roles
        • Producers
        • Mid-Level Participants (Traders/ Agents/ Brokers)
        • Wholesalers and Distributors
      • Value Added and Value Created at Node in the Supply Chain
      • List of Raw Material Suppliers
      • List of Existing and Potential Buyer’s
    • Investment Feasibility Matrix
    • Value Chain Analysis
      • Profit Margin Analysis
      • Wholesalers and Distributors
      • Retailers
    • PESTLE and Porter’s Analysis
    • Regulatory Landscape
      • By Key Regions
      • By Key Countries
    • Regional Parent Market Outlook
    • Production and Consumption Statistics
    • Import and Export Statistics
  4. Global Market Analysis 2020 to 2024 and Forecast, 2025 to 2035
    • Historical Market Size Value (USD Million) & Volume (Units) Analysis, 2020 to 2024
    • Current and Future Market Size Value (USD Million) & Volume (Units) Projections, 2025 to 2035
      • Y-o-Y Growth Trend Analysis
      • Absolute $ Opportunity Analysis
  5. Global Market Pricing Analysis 2020 to 2024 and Forecast 2025 to 2035
  6. Global Market Analysis 2020 to 2024 and Forecast 2025 to 2035, By Technology
    • Introduction/Key Findings
    • Historical Market Size Value (USD Million) & Volume (Units) Analysis By Technology, 2020 to 2024
    • Current and Future Market Size Value (USD Million) & Volume (Units) Analysis and Forecast By Technology, 2025 to 2035
      • Transmissometer
      • Scattered Light Monitor
      • Differential Optical Absorption Spectroscopy
      • LIDAR based
    • Y-o-Y Growth Trend Analysis By Technology, 2020 to 2024
    • Absolute $ Opportunity Analysis By Technology, 2025 to 2035
  7. Global Market Analysis 2020 to 2024 and Forecast 2025 to 2035, By Tunnel Type
    • Introduction/Key Findings
    • Historical Market Size Value (USD Million) & Volume (Units) Analysis By Tunnel Type, 2020 to 2024
    • Current and Future Market Size Value (USD Million) & Volume (Units) Analysis and Forecast By Tunnel Type, 2025 to 2035
      • Urban Road Tunnel
      • Mountain Tunnel
      • Railway Tunnel
      • Metro Tunnel
      • Utility Tunnel
      • Others
    • Y-o-Y Growth Trend Analysis By Tunnel Type, 2020 to 2024
    • Absolute $ Opportunity Analysis By Tunnel Type, 2025 to 2035
  8. Global Market Analysis 2020 to 2024 and Forecast 2025 to 2035, By Product Type
    • Introduction/Key Findings
    • Historical Market Size Value (USD Million) & Volume (Units) Analysis By Product Type, 2020 to 2024
    • Current and Future Market Size Value (USD Million) & Volume (Units) Analysis and Forecast By Product Type, 2025 to 2035
      • Stand-alone
      • Integrated
      • Portable
    • Y-o-Y Growth Trend Analysis By Product Type, 2020 to 2024
    • Absolute $ Opportunity Analysis By Product Type, 2025 to 2035
  9. Global Market Analysis 2020 to 2024 and Forecast 2025 to 2035, By Region
    • Introduction
    • Historical Market Size Value (USD Million) & Volume (Units) Analysis By Region, 2020 to 2024
    • Current Market Size Value (USD Million) & Volume (Units) Analysis and Forecast By Region, 2025 to 2035
      • North America
      • Latin America
      • Western Europe
      • Eastern Europe
      • East Asia
      • South Asia & Pacific
      • Middle East and Africa
    • Market Attractiveness Analysis By Region
  10. North America Market Analysis 2020 to 2024 and Forecast 2025 to 2035, By Country
    • Historical Market Size Value (USD Million) & Volume (Units) Trend Analysis By Market Taxonomy, 2020 to 2024
    • Market Size Value (USD Million) & Volume (Units) Forecast By Market Taxonomy, 2025 to 2035
      • By Country
        • USA
        • Canada
        • Mexico
      • By Technology
      • By Tunnel Type
      • By Product Type
    • Market Attractiveness Analysis
      • By Country
      • By Technology
      • By Tunnel Type
      • By Product Type
    • Key Takeaways
  11. Latin America Market Analysis 2020 to 2024 and Forecast 2025 to 2035, By Country
    • Historical Market Size Value (USD Million) & Volume (Units) Trend Analysis By Market Taxonomy, 2020 to 2024
    • Market Size Value (USD Million) & Volume (Units) Forecast By Market Taxonomy, 2025 to 2035
      • By Country
        • Brazil
        • Argentina
        • Rest of LATAM
      • By Technology
      • By Tunnel Type
      • By Product Type
    • Market Attractiveness Analysis
      • By Country
      • By Technology
      • By Tunnel Type
      • By Product Type
    • Key Takeaways
  12. Western Europe Market Analysis 2020 to 2024 and Forecast 2025 to 2035, By Country
    • Historical Market Size Value (USD Million) & Volume (Units) Trend Analysis By Market Taxonomy, 2020 to 2024
    • Market Size Value (USD Million) & Volume (Units) Forecast By Market Taxonomy, 2025 to 2035
      • By Country
        • Germany
        • Italy
        • France
        • UK
        • Spain
        • BENELUX
        • Nordic
        • Rest of W.Europe
      • By Technology
      • By Tunnel Type
      • By Product Type
    • Market Attractiveness Analysis
      • By Country
      • By Technology
      • By Tunnel Type
      • By Product Type
    • Key Takeaways
  13. Eastern Europe Market Analysis 2020 to 2024 and Forecast 2025 to 2035, By Country
    • Historical Market Size Value (USD Million) & Volume (Units) Trend Analysis By Market Taxonomy, 2020 to 2024
    • Market Size Value (USD Million) & Volume (Units) Forecast By Market Taxonomy, 2025 to 2035
      • By Country
        • Russia
        • Hungary
        • Poland
        • Balkan & Baltics
        • Rest of E. Europe
      • By Technology
      • By Tunnel Type
      • By Product Type
    • Market Attractiveness Analysis
      • By Country
      • By Technology
      • By Tunnel Type
      • By Product Type
    • Key Takeaways
  14. East Asia Market Analysis 2020 to 2024 and Forecast 2025 to 2035, By Country
    • Historical Market Size Value (USD Million) & Volume (Units) Trend Analysis By Market Taxonomy, 2020 to 2024
    • Market Size Value (USD Million) & Volume (Units) Forecast By Market Taxonomy, 2025 to 2035
      • By Country
        • China
        • Japan
        • South Korea
      • By Technology
      • By Tunnel Type
      • By Product Type
    • Market Attractiveness Analysis
      • By Country
      • By Technology
      • By Tunnel Type
      • By Product Type
    • Key Takeaways
  15. South Asia & Pacific Market Analysis 2020 to 2024 and Forecast 2025 to 2035, By Country
    • Historical Market Size Value (USD Million) & Volume (Units) Trend Analysis By Market Taxonomy, 2020 to 2024
    • Market Size Value (USD Million) & Volume (Units) Forecast By Market Taxonomy, 2025 to 2035
      • By Country
        • India
        • Australia & New Zealand
        • ASEAN
        • Rest of SAP
      • By Technology
      • By Tunnel Type
      • By Product Type
    • Market Attractiveness Analysis
      • By Country
      • By Technology
      • By Tunnel Type
      • By Product Type
    • Key Takeaways
  16. Middle East and Africa Market Analysis 2020 to 2024 and Forecast 2025 to 2035, By Country
    • Historical Market Size Value (USD Million) & Volume (Units) Trend Analysis By Market Taxonomy, 2020 to 2024
    • Market Size Value (USD Million) & Volume (Units) Forecast By Market Taxonomy, 2025 to 2035
      • By Country
        • GCC Countries
        • Northern Africa
        • South Africa
        • Turkiye
        • Rest of MEA
      • By Technology
      • By Tunnel Type
      • By Product Type
    • Market Attractiveness Analysis
      • By Country
      • By Technology
      • By Tunnel Type
      • By Product Type
    • Key Takeaways
  17. Key Countries Market Analysis
    • USA
      • Pricing Analysis
      • Market Share Analysis, 2024
        • By Technology
        • By Tunnel Type
        • By Product Type
    • Canada
      • Pricing Analysis
      • Market Share Analysis, 2024
        • By Technology
        • By Tunnel Type
        • By Product Type
    • Brazil
      • Pricing Analysis
      • Market Share Analysis, 2024
        • By Technology
        • By Tunnel Type
        • By Product Type
    • Mexico
      • Pricing Analysis
      • Market Share Analysis, 2024
        • By Technology
        • By Tunnel Type
        • By Product Type
    • Argentina
      • Pricing Analysis
      • Market Share Analysis, 2024
        • By Technology
        • By Tunnel Type
        • By Product Type
  18. Market Structure Analysis
    • Competition Dashboard
    • Competition Benchmarking
    • Market Share Analysis of Top Players
      • By Regional
      • By Technology
      • By Tunnel Type
      • By Product Type
  19. Competition Analysis
    • Competition Deep Dive
      • Forbes Marshall (Codel)
        • Overview
        • Product Portfolio
        • Profitability by Market Segments (Product/Age /Sales Channel/Region)
        • Sales Footprint
        • Strategy Overview
          • Marketing Strategy
          • Product Strategy
          • Channel Strategy
      • Acoem
        • Overview
        • Product Portfolio
        • Profitability by Market Segments (Product/Age /Sales Channel/Region)
        • Sales Footprint
        • Strategy Overview
          • Marketing Strategy
          • Product Strategy
          • Channel Strategy
      • Durag Group
        • Overview
        • Product Portfolio
        • Profitability by Market Segments (Product/Age /Sales Channel/Region)
        • Sales Footprint
        • Strategy Overview
          • Marketing Strategy
          • Product Strategy
          • Channel Strategy
      • SICK AG
        • Overview
        • Product Portfolio
        • Profitability by Market Segments (Product/Age /Sales Channel/Region)
        • Sales Footprint
        • Strategy Overview
          • Marketing Strategy
          • Product Strategy
          • Channel Strategy
      • Endress+Hauser
        • Overview
        • Product Portfolio
        • Profitability by Market Segments (Product/Age /Sales Channel/Region)
        • Sales Footprint
        • Strategy Overview
          • Marketing Strategy
          • Product Strategy
          • Channel Strategy
      • Sigrist Photometer AG
        • Overview
        • Product Portfolio
        • Profitability by Market Segments (Product/Age /Sales Channel/Region)
        • Sales Footprint
        • Strategy Overview
          • Marketing Strategy
          • Product Strategy
          • Channel Strategy
  20. Assumptions & Acronyms Used
  21. Research Methodology

List of Tables

  • Table 1: Global Market Value (USD Million) Forecast by Region, 2020-2035
  • Table 2: Global Market Volume (Units) Forecast by Region, 2020-2035
  • Table 3: Global Market Value (USD Million) Forecast by Technology, 2020-2035
  • Table 4: Global Market Volume (Units) Forecast by Technology, 2020-2035
  • Table 5: Global Market Value (USD Million) Forecast by Tunnel Type, 2020-2035
  • Table 6: Global Market Volume (Units) Forecast by Tunnel Type, 2020-2035
  • Table 7: Global Market Value (USD Million) Forecast by Product Type, 2020-2035
  • Table 8: Global Market Volume (Units) Forecast by Product Type, 2020-2035
  • Table 9: North America Market Value (USD Million) Forecast by Country, 2020-2035
  • Table 10: North America Market Volume (Units) Forecast by Country, 2020-2035
  • Table 11: North America Market Value (USD Million) Forecast by Technology, 2020-2035
  • Table 12: North America Market Volume (Units) Forecast by Technology, 2020-2035
  • Table 13: North America Market Value (USD Million) Forecast by Tunnel Type, 2020-2035
  • Table 14: North America Market Volume (Units) Forecast by Tunnel Type, 2020-2035
  • Table 15: North America Market Value (USD Million) Forecast by Product Type, 2020-2035
  • Table 16: North America Market Volume (Units) Forecast by Product Type, 2020-2035
  • Table 17: Latin America Market Value (USD Million) Forecast by Country, 2020-2035
  • Table 18: Latin America Market Volume (Units) Forecast by Country, 2020-2035
  • Table 19: Latin America Market Value (USD Million) Forecast by Technology, 2020-2035
  • Table 20: Latin America Market Volume (Units) Forecast by Technology, 2020-2035
  • Table 21: Latin America Market Value (USD Million) Forecast by Tunnel Type, 2020-2035
  • Table 22: Latin America Market Volume (Units) Forecast by Tunnel Type, 2020-2035
  • Table 23: Latin America Market Value (USD Million) Forecast by Product Type, 2020-2035
  • Table 24: Latin America Market Volume (Units) Forecast by Product Type, 2020-2035
  • Table 25: Western Europe Market Value (USD Million) Forecast by Country, 2020-2035
  • Table 26: Western Europe Market Volume (Units) Forecast by Country, 2020-2035
  • Table 27: Western Europe Market Value (USD Million) Forecast by Technology, 2020-2035
  • Table 28: Western Europe Market Volume (Units) Forecast by Technology, 2020-2035
  • Table 29: Western Europe Market Value (USD Million) Forecast by Tunnel Type, 2020-2035
  • Table 30: Western Europe Market Volume (Units) Forecast by Tunnel Type, 2020-2035
  • Table 31: Western Europe Market Value (USD Million) Forecast by Product Type, 2020-2035
  • Table 32: Western Europe Market Volume (Units) Forecast by Product Type, 2020-2035
  • Table 33: Eastern Europe Market Value (USD Million) Forecast by Country, 2020-2035
  • Table 34: Eastern Europe Market Volume (Units) Forecast by Country, 2020-2035
  • Table 35: Eastern Europe Market Value (USD Million) Forecast by Technology, 2020-2035
  • Table 36: Eastern Europe Market Volume (Units) Forecast by Technology, 2020-2035
  • Table 37: Eastern Europe Market Value (USD Million) Forecast by Tunnel Type, 2020-2035
  • Table 38: Eastern Europe Market Volume (Units) Forecast by Tunnel Type, 2020-2035
  • Table 39: Eastern Europe Market Value (USD Million) Forecast by Product Type, 2020-2035
  • Table 40: Eastern Europe Market Volume (Units) Forecast by Product Type, 2020-2035
  • Table 41: East Asia Market Value (USD Million) Forecast by Country, 2020-2035
  • Table 42: East Asia Market Volume (Units) Forecast by Country, 2020-2035
  • Table 43: East Asia Market Value (USD Million) Forecast by Technology, 2020-2035
  • Table 44: East Asia Market Volume (Units) Forecast by Technology, 2020-2035
  • Table 45: East Asia Market Value (USD Million) Forecast by Tunnel Type, 2020-2035
  • Table 46: East Asia Market Volume (Units) Forecast by Tunnel Type, 2020-2035
  • Table 47: East Asia Market Value (USD Million) Forecast by Product Type, 2020-2035
  • Table 48: East Asia Market Volume (Units) Forecast by Product Type, 2020-2035
  • Table 49: South Asia & Pacific Market Value (USD Million) Forecast by Country, 2020-2035
  • Table 50: South Asia & Pacific Market Volume (Units) Forecast by Country, 2020-2035
  • Table 51: South Asia & Pacific Market Value (USD Million) Forecast by Technology, 2020-2035
  • Table 52: South Asia & Pacific Market Volume (Units) Forecast by Technology, 2020-2035
  • Table 53: South Asia & Pacific Market Value (USD Million) Forecast by Tunnel Type, 2020-2035
  • Table 54: South Asia & Pacific Market Volume (Units) Forecast by Tunnel Type, 2020-2035
  • Table 55: South Asia & Pacific Market Value (USD Million) Forecast by Product Type, 2020-2035
  • Table 56: South Asia & Pacific Market Volume (Units) Forecast by Product Type, 2020-2035
  • Table 57: Middle East and Africa Market Value (USD Million) Forecast by Country, 2020-2035
  • Table 58: Middle East and Africa Market Volume (Units) Forecast by Country, 2020-2035
  • Table 59: Middle East and Africa Market Value (USD Million) Forecast by Technology, 2020-2035
  • Table 60: Middle East and Africa Market Volume (Units) Forecast by Technology, 2020-2035
  • Table 61: Middle East and Africa Market Value (USD Million) Forecast by Tunnel Type, 2020-2035
  • Table 62: Middle East and Africa Market Volume (Units) Forecast by Tunnel Type, 2020-2035
  • Table 63: Middle East and Africa Market Value (USD Million) Forecast by Product Type, 2020-2035
  • Table 64: Middle East and Africa Market Volume (Units) Forecast by Product Type, 2020-2035

List of Figures

  • Figure 1: Global Market Volume (Units) Forecast 2020-2035
  • Figure 2: Global Market Pricing Analysis
  • Figure 3: Global Market Value (USD Million) Forecast 2020-2035
  • Figure 4: Global Market Value Share and BPS Analysis by Technology, 2025 and 2035
  • Figure 5: Global Market Y-o-Y Growth Comparison by Technology, 2025-2035
  • Figure 6: Global Market Attractiveness Analysis by Technology
  • Figure 7: Global Market Value Share and BPS Analysis by Tunnel Type, 2025 and 2035
  • Figure 8: Global Market Y-o-Y Growth Comparison by Tunnel Type, 2025-2035
  • Figure 9: Global Market Attractiveness Analysis by Tunnel Type
  • Figure 10: Global Market Value Share and BPS Analysis by Product Type, 2025 and 2035
  • Figure 11: Global Market Y-o-Y Growth Comparison by Product Type, 2025-2035
  • Figure 12: Global Market Attractiveness Analysis by Product Type
  • Figure 13: Global Market Value (USD Million) Share and BPS Analysis by Region, 2025 and 2035
  • Figure 14: Global Market Y-o-Y Growth Comparison by Region, 2025-2035
  • Figure 15: Global Market Attractiveness Analysis by Region
  • Figure 16: North America Market Incremental $ Opportunity, 2025-2035
  • Figure 17: Latin America Market Incremental $ Opportunity, 2025-2035
  • Figure 18: Western Europe Market Incremental $ Opportunity, 2025-2035
  • Figure 19: Eastern Europe Market Incremental $ Opportunity, 2025-2035
  • Figure 20: East Asia Market Incremental $ Opportunity, 2025-2035
  • Figure 21: South Asia & Pacific Market Incremental $ Opportunity, 2025-2035
  • Figure 22: Middle East and Africa Market Incremental $ Opportunity, 2025-2035
  • Figure 23: North America Market Value Share and BPS Analysis by Country, 2025 and 2035
  • Figure 24: North America Market Value Share and BPS Analysis by Technology, 2025 and 2035
  • Figure 25: North America Market Y-o-Y Growth Comparison by Technology, 2025-2035
  • Figure 26: North America Market Attractiveness Analysis by Technology
  • Figure 27: North America Market Value Share and BPS Analysis by Tunnel Type, 2025 and 2035
  • Figure 28: North America Market Y-o-Y Growth Comparison by Tunnel Type, 2025-2035
  • Figure 29: North America Market Attractiveness Analysis by Tunnel Type
  • Figure 30: North America Market Value Share and BPS Analysis by Product Type, 2025 and 2035
  • Figure 31: North America Market Y-o-Y Growth Comparison by Product Type, 2025-2035
  • Figure 32: North America Market Attractiveness Analysis by Product Type
  • Figure 33: Latin America Market Value Share and BPS Analysis by Country, 2025 and 2035
  • Figure 34: Latin America Market Value Share and BPS Analysis by Technology, 2025 and 2035
  • Figure 35: Latin America Market Y-o-Y Growth Comparison by Technology, 2025-2035
  • Figure 36: Latin America Market Attractiveness Analysis by Technology
  • Figure 37: Latin America Market Value Share and BPS Analysis by Tunnel Type, 2025 and 2035
  • Figure 38: Latin America Market Y-o-Y Growth Comparison by Tunnel Type, 2025-2035
  • Figure 39: Latin America Market Attractiveness Analysis by Tunnel Type
  • Figure 40: Latin America Market Value Share and BPS Analysis by Product Type, 2025 and 2035
  • Figure 41: Latin America Market Y-o-Y Growth Comparison by Product Type, 2025-2035
  • Figure 42: Latin America Market Attractiveness Analysis by Product Type
  • Figure 43: Western Europe Market Value Share and BPS Analysis by Country, 2025 and 2035
  • Figure 44: Western Europe Market Value Share and BPS Analysis by Technology, 2025 and 2035
  • Figure 45: Western Europe Market Y-o-Y Growth Comparison by Technology, 2025-2035
  • Figure 46: Western Europe Market Attractiveness Analysis by Technology
  • Figure 47: Western Europe Market Value Share and BPS Analysis by Tunnel Type, 2025 and 2035
  • Figure 48: Western Europe Market Y-o-Y Growth Comparison by Tunnel Type, 2025-2035
  • Figure 49: Western Europe Market Attractiveness Analysis by Tunnel Type
  • Figure 50: Western Europe Market Value Share and BPS Analysis by Product Type, 2025 and 2035
  • Figure 51: Western Europe Market Y-o-Y Growth Comparison by Product Type, 2025-2035
  • Figure 52: Western Europe Market Attractiveness Analysis by Product Type
  • Figure 53: Eastern Europe Market Value Share and BPS Analysis by Country, 2025 and 2035
  • Figure 54: Eastern Europe Market Value Share and BPS Analysis by Technology, 2025 and 2035
  • Figure 55: Eastern Europe Market Y-o-Y Growth Comparison by Technology, 2025-2035
  • Figure 56: Eastern Europe Market Attractiveness Analysis by Technology
  • Figure 57: Eastern Europe Market Value Share and BPS Analysis by Tunnel Type, 2025 and 2035
  • Figure 58: Eastern Europe Market Y-o-Y Growth Comparison by Tunnel Type, 2025-2035
  • Figure 59: Eastern Europe Market Attractiveness Analysis by Tunnel Type
  • Figure 60: Eastern Europe Market Value Share and BPS Analysis by Product Type, 2025 and 2035
  • Figure 61: Eastern Europe Market Y-o-Y Growth Comparison by Product Type, 2025-2035
  • Figure 62: Eastern Europe Market Attractiveness Analysis by Product Type
  • Figure 63: East Asia Market Value Share and BPS Analysis by Country, 2025 and 2035
  • Figure 64: East Asia Market Value Share and BPS Analysis by Technology, 2025 and 2035
  • Figure 65: East Asia Market Y-o-Y Growth Comparison by Technology, 2025-2035
  • Figure 66: East Asia Market Attractiveness Analysis by Technology
  • Figure 67: East Asia Market Value Share and BPS Analysis by Tunnel Type, 2025 and 2035
  • Figure 68: East Asia Market Y-o-Y Growth Comparison by Tunnel Type, 2025-2035
  • Figure 69: East Asia Market Attractiveness Analysis by Tunnel Type
  • Figure 70: East Asia Market Value Share and BPS Analysis by Product Type, 2025 and 2035
  • Figure 71: East Asia Market Y-o-Y Growth Comparison by Product Type, 2025-2035
  • Figure 72: East Asia Market Attractiveness Analysis by Product Type
  • Figure 73: South Asia & Pacific Market Value Share and BPS Analysis by Country, 2025 and 2035
  • Figure 74: South Asia & Pacific Market Value Share and BPS Analysis by Technology, 2025 and 2035
  • Figure 75: South Asia & Pacific Market Y-o-Y Growth Comparison by Technology, 2025-2035
  • Figure 76: South Asia & Pacific Market Attractiveness Analysis by Technology
  • Figure 77: South Asia & Pacific Market Value Share and BPS Analysis by Tunnel Type, 2025 and 2035
  • Figure 78: South Asia & Pacific Market Y-o-Y Growth Comparison by Tunnel Type, 2025-2035
  • Figure 79: South Asia & Pacific Market Attractiveness Analysis by Tunnel Type
  • Figure 80: South Asia & Pacific Market Value Share and BPS Analysis by Product Type, 2025 and 2035
  • Figure 81: South Asia & Pacific Market Y-o-Y Growth Comparison by Product Type, 2025-2035
  • Figure 82: South Asia & Pacific Market Attractiveness Analysis by Product Type
  • Figure 83: Middle East and Africa Market Value Share and BPS Analysis by Country, 2025 and 2035
  • Figure 84: Middle East and Africa Market Value Share and BPS Analysis by Technology, 2025 and 2035
  • Figure 85: Middle East and Africa Market Y-o-Y Growth Comparison by Technology, 2025-2035
  • Figure 86: Middle East and Africa Market Attractiveness Analysis by Technology
  • Figure 87: Middle East and Africa Market Value Share and BPS Analysis by Tunnel Type, 2025 and 2035
  • Figure 88: Middle East and Africa Market Y-o-Y Growth Comparison by Tunnel Type, 2025-2035
  • Figure 89: Middle East and Africa Market Attractiveness Analysis by Tunnel Type
  • Figure 90: Middle East and Africa Market Value Share and BPS Analysis by Product Type, 2025 and 2035
  • Figure 91: Middle East and Africa Market Y-o-Y Growth Comparison by Product Type, 2025-2035
  • Figure 92: Middle East and Africa Market Attractiveness Analysis by Product Type
  • Figure 93: Global Market - Tier Structure Analysis
  • Figure 94: Global Market - Company Share Analysis

Frequently Asked Questions

What is the market size of the tunnel visibility monitors market in 2025?

The market is valued at USD 167.8 million in 2025.

What is the projected size of the tunnel visibility monitors market by 2035?

The market is expected to reach USD 309.1 million by 2035.

What is the CAGR of the tunnel visibility monitors market from 2025 to 2035?

The market is anticipated to grow at a CAGR of 6.3% during the forecast period.

Which tunnel type holds the largest share in the tunnel visibility monitors market?

Urban tunnels represent the leading segment, with a 31% share in 2025.

Which country is the fastest growing in the tunnel visibility monitors market?

The UAE is the top-growing country, registering a 7.0% CAGR from 2025 to 2035.

Explore Similar Insights

Future Market Insights

Tunnel Visibility Monitors Market