The USA self-checkout systems demand is valued at USD 1.5 billion in 2025 and is forecasted to reach USD 3.7 billion by 2035, recording a CAGR of 9.9%. Demand is supported by continued labour-shortage pressures, wider adoption of contactless retail models, and sustained investment in automation across supermarkets, hypermarkets, pharmacies, and convenience stores. Self-checkout systems reduce queue times, improve floor-space efficiency, and support hybrid store formats that combine staffed lanes with automated checkout points. Retailers also use these systems to streamline operations, manage peak-hour volumes, and lower recurring staffing costs.
Stationary self-checkout kiosks represent the leading product type, reflecting their suitability for high-traffic environments and their ability to handle diverse product categories, including weighted items and age-restricted goods. These kiosks integrate barcode scanners, touch interfaces, payment terminals, and loss-prevention tools. Developments in computer vision scanning, item-weight verification, and real-time fraud detection are improving accuracy and reducing intervention rates.
Demand is strongest in the West, South, and Northeast, where large retail chains, urban store formats, and early adoption of automation technologies are concentrated. Key suppliers include Diebold Nixdorf, NCR Voyix Corporation, Fujitsu, Toshiba Global Commerce Solutions, and ITAB Group. Their focus includes platform reliability, secure payment integration, and scalable deployment across multi-store retail networks.
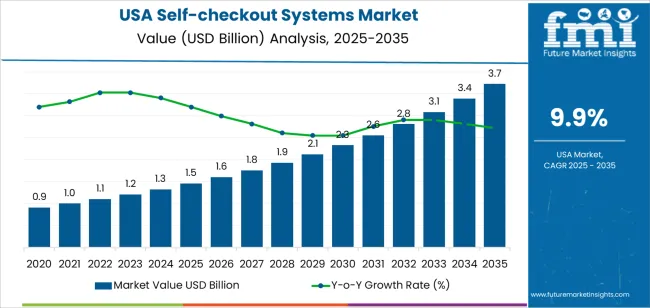
The growth contribution index shows that grocery and mass-merchandise retailers will account for the largest share of incremental expansion during the early period from 2025 to 2029. High transaction volumes, labour-efficiency goals, and store-format modernization will drive consistent adoption in these channels. Wider use of optical-scanning units, computer-vision modules, and weight-verification features will reinforce early contributions from large retail chains.
Between 2030 and 2035, contributions will broaden across convenience stores, pharmacy outlets, and quick-service environments. Growth during this stage will be driven by replacement cycles, system upgrades, and increased integration with inventory management and loss-prevention tools. Adoption of compact kiosks and mobile-assisted checkout options will create incremental gains among smaller retailers. Regional contributions will remain led by high-density urban industries with established self-service infrastructure. The contribution pattern reflects a steady expansion supported by workflow consistency, operational efficiency needs, and continued integration of automated checkout systems across U.S. retail environments.
| Metric | Value |
|---|---|
| USA Self-checkout Systems Sales Value (2025) | USD 1.5 billion |
| USA Self-checkout Systems Forecast Value (2035) | USD 3.7 billion |
| USA Self-checkout Systems Forecast CAGR (2025 to 2035) | 9.9% |
Demand for self-checkout systems in the USA is growing because retailers aim to enhance operational efficiency and offer faster customer service in high-traffic store environments. Systems that allow customers to scan items and complete purchases without cashier assistance reduce labour costs and support retail automation strategies. Consumer preferences for convenience and contactless payments further push adoption of self-checkout kiosks across supermarkets, convenience stores and specialty retail outlets.
Advances in payment technologies, cashier-less checkout solutions and AI-enabled checkout workflows improve user experience and deployment viability. Expansion of e-commerce and omnichannel retailing also influence investment in in-store technologies that streamline checkout and integrate with mobile and digital platforms. Constraints include concerns about theft and shrinkage associated with self-checkout systems, the cost and complexity of hardware and software installation and integration with existing retail systems, and variances in customer acceptance or capability to use self-checkout devices effectively. Some smaller retailers may delay adoption until system economics become clearer.
Demand for self-checkout systems in the United States reflects increased automation across retail, rising labour-cost pressures, and preference for contact-efficient transactions. Distribution across product type, payment method, and end-use segments aligns with adoption patterns in grocery, convenience retail, department stores, and specialty outlets. Buyers evaluate reliability, throughput, space efficiency, and integration with point-of-sale platforms.
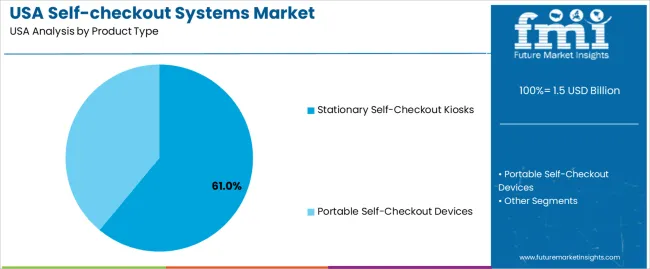
Stationary kiosks represent an estimated 61.0% of U.S. demand and remain the leading product category. These full-size units support high-volume environments such as supermarkets and mass-merchandise stores, offering robust scanning hardware, integrated payment modules, and stable transaction throughput.
Their fixed configuration supports anti-theft controls and inventory integration. Portable self-checkout devices hold 39.0%, serving smaller stores, pop-up formats, and flexible retail layouts. Portable units provide mobility, rapid deployment, and lower capital expenditure, supporting convenience outlets and specialty retailers seeking compact automation options. Product type distribution reflects differences in foot-traffic intensity, floor-space constraints, and transaction-automation needs.
Key drivers and attributes:
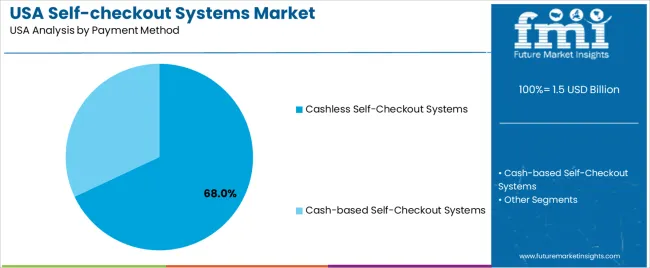
Cashless systems account for an estimated 68.0% of U.S. demand. Contactless cards, mobile wallets, QR-code payments, and integrated digital wallets drive adoption among retailers focusing on rapid transaction flow. Cashless units reduce maintenance, limit mechanical failures, and support faster customer movement.
Cash-based systems represent 32.0%, remaining necessary in environments with notable cash-using customer groups. These units require additional hardware for note and coin handling, influencing cost and maintenance schedules. Payment-method distribution reflects consumer adoption of digital payments and retailer preference for streamlined checkout processes.
Key drivers and attributes:

Product manufacturers providing direct installations hold an estimated 42.0% share. Retailers rely on manufacturer-supplied systems for hardware consistency, software compatibility, and ongoing support. Leasing or rental arrangements account for 28.0%, appealing to small and mid-size retailers seeking lower upfront costs and flexible contract structures.
Integration partners represent 22.0%, supporting multi-vendor environments requiring customised deployment across legacy POS systems. The remaining 8.0% includes procurement through niche distributors and technology resellers. End-use distribution reflects retailer size, capital-allocation preferences, and system-integration requirements.
Key drivers and attributes:
Labour shortages, rising retail automation, and consumer preference for fast checkout experiences are driving demand.
Retailers in the USA are deploying more self-checkout systems to reduce dependence on front-line staff amidst labour industry tightness and wage pressure. The expansion of grocery, convenience and big-box retail formats with high transaction volumes makes self-checkout appealing for improving throughput and reducing queue times. Consumers increasingly prefer self-service checkout for its speed, control and minimal human interaction, especially in high-traffic or quick-stop shopping environments. Advances in payment technology, such as mobile wallets, touchless payments and barcode-less scanning, enhance the viability of self-checkout installations and support retailer investment.
Theft and shrink risk, consumer resistance and installation cost complicate deployment.
Retailers face elevated shrinkage risks when self-checkout systems are improperly supervised or poorly configured, which raises concerns about return-on-investment and store security. Some consumers express frustration with self-checkout usability, technical errors or lack of assistance, which can diminish satisfaction and create negative experiences. The initial cost of hardware, software, integration and maintenance for self-checkout systems remains significant, particularly for smaller retailers or stores with lower transaction volumes, which can limit adoption in those segments.
Trend towards hybrid checkout models, integration of AI and computer-vision safeguards, and growth among convenience store and quick-service formats define industry direction.
Retailers are evolving toward hybrid checkout setups that combine staffed lanes with self-checkout and mobile/in-lane scanning to optimise flexibility and customer choice. Self-checkout systems are increasingly incorporating AI, machine-vision item recognition and advanced analytics to reduce errors, detect theft and streamline operations. Adoption is growing in convenience stores, fuel-stations and quick-service retail outlets, where speed and small basket sizes are especially important, expanding the industry beyond traditional supermarket applications.
Demand for self-checkout systems in the United States is rising through 2035 as retailers expand automated checkout options to reduce wait times, manage labor constraints, and support higher transaction throughput. Supermarkets, big-box stores, pharmacies, and convenience chains continue to increase deployment of barcode-scanner units, age-verification modules, cash-handling systems, and AI-supported loss-prevention tools. Growth is influenced by retail-network density, technology-adoption rates, and store-modernization programs across regions.
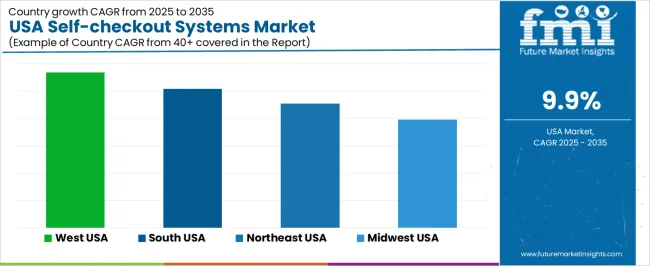
The West leads with a 11.4% CAGR, followed by the South (10.2%), the Northeast (9.1%), and the Midwest (7.9%). Demand is reinforced by continuous investment in in-store automation and growing consumer familiarity with self-service formats.
| Region | CAGR (2025-2035) |
|---|---|
| West | 11.4% |
| South | 10.2% |
| Northeast | 9.1% |
| Midwest | 7.9% |
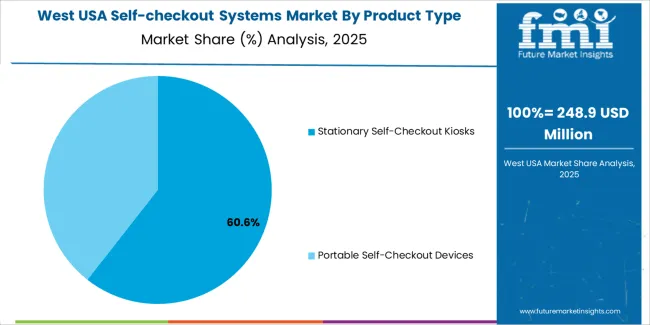
The West grows at 11.4% CAGR, supported by dense retail networks, high adoption of in-store automation, and steady modernization across supermarkets and big-box chains in California, Washington, Oregon, and Colorado. Retailers use self-checkout systems to manage peak-hour traffic, reduce operational delays, and streamline high-volume transactions. Technology companies in the region contribute to early adoption of AI-supported loss-detection and camera-assisted scanning tools. Convenience stores and pharmacies expand self-service kiosks to improve transaction speed and reduce dependency on traditional staffed checkout lanes. Retail remodel programs across suburban and metropolitan areas reinforce steady procurement of upgraded units.
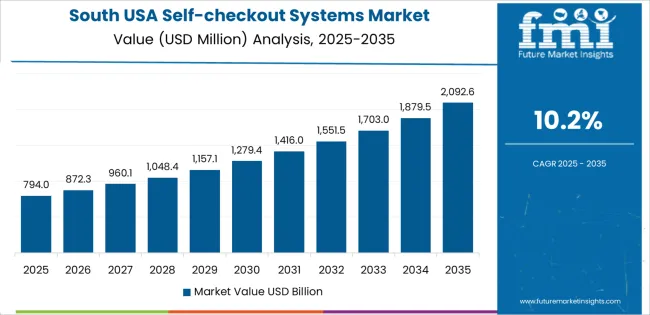
The South grows at 10.2% CAGR, supported by expanding retail footprints, rising population levels, and broad adoption of automation across grocery, discount-retail, and general-merchandise stores. States such as Texas, Florida, Georgia, and North Carolina see consistent deployment of self-checkout systems to reduce queue times and support large customer volumes. Retailers use self-checkout tools to manage operational costs and reduce staffing pressure during high-traffic periods. Home-improvement and warehouse-format retailers also integrate upgraded scanning units for bulky-item transactions. Growth is reinforced by strong suburban development and competitive retail-market expansion across major corridors.

The Northeast grows at 9.1% CAGR, supported by dense metropolitan retail industries, high store turnover, and continuous modernization among established supermarket chains. States including New York, New Jersey, Massachusetts, and Pennsylvania deploy self-checkout units to manage high daily transaction volume and limited floor-space availability. Retailers use these systems to reduce checkout congestion in urban areas and streamline smaller-format grocery stores. Pharmacy chains and specialty retailers maintain steady adoption to support quick-transaction environments. Retailers in the region frequently upgrade existing units to incorporate better scanning accuracy and enhanced loss-control functions.
The Midwest grows at 7.9% CAGR, supported by established supermarket networks, regional retail chains, and consistent investment in store-automation tools. Illinois, Michigan, Ohio, and Wisconsin maintain steady use of self-checkout systems across grocery, home-improvement, and general-retail environments. Retailers adopt self-checkout technology to improve operational efficiency and mitigate labor shortages in suburban and rural areas. Continuous replacement of legacy scanning units supports ongoing procurement. While growth is slower than coastal regions, strong retail presence and broad consumer acceptance ensure reliable demand.

Demand for self-checkout systems in the USA is shaped by a concentrated group of technology providers supporting supermarkets, big-box retailers, convenience chains, and specialty stores. Diebold Nixdorf, Inc. holds the leading position with an estimated 35.3% share, supported by long-standing retail-automation expertise, dependable scanner–scale integration, and strong deployment capacity across large grocery and mass-merchandise environments. Its position is reinforced by stable transaction performance, controlled hardware quality, and established service networks.
NCR Voyix Corporation follows as a major participant, supplying configurable self-checkout units used widely across national retail chains. Its strengths include flexible software, reliable item-recognition capability, and integration with loyalty platforms and inventory systems. Fujitsu Ltd. maintains a strong presence through compact and modular self-checkout systems suited to high-traffic stores requiring predictable throughput and durable components. Toshiba Global Commerce Solutions contributes notable capability with self-checkout hardware optimized for large-format stores, emphasizing ease of maintenance, strong peripheral compatibility, and integration with advanced retail software ecosystems. ITAB Group supports additional demand through space-efficient self-checkout solutions designed for mid-sized retailers and formats prioritizing simplified user interaction.
Competition across this segment centers on scanning accuracy, uptime reliability, payment-device stability, loss-prevention features, and system integration with existing POS environments. Demand continues to increase as U.S. retailers expand self-service formats to manage labor constraints, improve checkout efficiency, and support hybrid human-plus-automated service models. Adoption is further strengthened by ongoing investment in computer-vision tools, friction-reduction features, and consistent multi-payment compatibility across diverse retail settings.
| Items | Values |
|---|---|
| Quantitative Units | USD billion |
| Product Type | Portable Self-Checkout Devices, Stationary Self-Checkout Kiosks |
| Payment Method | Cash-based Self-Checkout Systems, Cashless Self-Checkout Systems |
| End Use | Product Manufacturers (Direct), Leasing or Rental, Integration Partners, Others |
| Regions Covered | West, Midwest, South, Northeast |
| Key Companies Profiled | Diebold Nixdorf, Inc., NCR Voyix Corporation, Fujitsu Ltd., Toshiba Global Commerce Solutions, ITAB Group |
| Additional Attributes | Dollar sales by product type, payment method, and end-use categories; regional adoption trends across West, Midwest, South, and Northeast; competitive landscape of self-checkout system providers; advancements in cashless checkout, AI-driven loss prevention, POS integration, and frictionless retail technologies; integration with supermarkets, convenience stores, department stores, and self-service retail environments in the USA. |
The global demand for self-checkout systems in USA is estimated to be valued at USD 1.5 billion in 2025.
The market size for the demand for self-checkout systems in USA is projected to reach USD 3.7 billion by 2035.
The demand for self-checkout systems in USA is expected to grow at a 9.9% CAGR between 2025 and 2035.
The key product types in demand for self-checkout systems in USA are stationary self-checkout kiosks and portable self-checkout devices.
In terms of payment method, cashless self-checkout systems segment to command 68.0% share in the demand for self-checkout systems in USA in 2025.


Our Research Products

The "Full Research Suite" delivers actionable market intel, deep dives on markets or technologies, so clients act faster, cut risk, and unlock growth.

The Leaderboard benchmarks and ranks top vendors, classifying them as Established Leaders, Leading Challengers, or Disruptors & Challengers.

Locates where complements amplify value and substitutes erode it, forecasting net impact by horizon

We deliver granular, decision-grade intel: market sizing, 5-year forecasts, pricing, adoption, usage, revenue, and operational KPIs—plus competitor tracking, regulation, and value chains—across 60 countries broadly.

Spot the shifts before they hit your P&L. We track inflection points, adoption curves, pricing moves, and ecosystem plays to show where demand is heading, why it is changing, and what to do next across high-growth markets and disruptive tech

Real-time reads of user behavior. We track shifting priorities, perceptions of today’s and next-gen services, and provider experience, then pace how fast tech moves from trial to adoption, blending buyer, consumer, and channel inputs with social signals (#WhySwitch, #UX).

Partner with our analyst team to build a custom report designed around your business priorities. From analysing market trends to assessing competitors or crafting bespoke datasets, we tailor insights to your needs.
Supplier Intelligence
Discovery & Profiling
Capacity & Footprint
Performance & Risk
Compliance & Governance
Commercial Readiness
Who Supplies Whom
Scorecards & Shortlists
Playbooks & Docs
Category Intelligence
Definition & Scope
Demand & Use Cases
Cost Drivers
Market Structure
Supply Chain Map
Trade & Policy
Operating Norms
Deliverables
Buyer Intelligence
Account Basics
Spend & Scope
Procurement Model
Vendor Requirements
Terms & Policies
Entry Strategy
Pain Points & Triggers
Outputs
Pricing Analysis
Benchmarks
Trends
Should-Cost
Indexation
Landed Cost
Commercial Terms
Deliverables
Brand Analysis
Positioning & Value Prop
Share & Presence
Customer Evidence
Go-to-Market
Digital & Reputation
Compliance & Trust
KPIs & Gaps
Outputs
Full Research Suite comprises of:
Market outlook & trends analysis
Interviews & case studies
Strategic recommendations
Vendor profiles & capabilities analysis
5-year forecasts
8 regions and 60+ country-level data splits
Market segment data splits
12 months of continuous data updates
DELIVERED AS:
PDF EXCEL ONLINE
Self-checkout Systems Market Analysis by Portable Self-Checkout Devices and Stationary Self-Checkout Kiosks Through 2035
Market Share Breakdown of Self-Checkout System Manufacturers
Demand for Self-checkout Systems in Japan Size and Share Forecast Outlook 2025 to 2035
Systems Administration Management Tools Market Size and Share Forecast Outlook 2025 to 2035
VRF Systems Market Growth - Trends & Forecast 2025 to 2035
Cloud Systems Management Software Market Size and Share Forecast Outlook 2025 to 2035
Hi-Fi Systems Market Size and Share Forecast Outlook 2025 to 2035
Cough systems Market
Backpack Systems Market Size and Share Forecast Outlook 2025 to 2035
Unmanned Systems Market Analysis - Size, Share, & Forecast Outlook 2025 to 2035
DC Power Systems Market Trends - Growth, Demand & Forecast 2025 to 2035
Catheter Systems Market
Reporter Systems Market
Aerostat Systems Market
Cryogenic Systems Market Size and Share Forecast Outlook 2025 to 2035
Air Brake Systems Market Growth & Demand 2025 to 2035
Metrology Systems Market
Fluid Bed Systems Market
Cognitive Systems Spending Market Report – Growth & Forecast 2016-2026
Nurse Call Systems Market Insights - Size, Share & Forecast 2025 to 2035

Thank you!
You will receive an email from our Business Development Manager. Please be sure to check your SPAM/JUNK folder too.
Chat With
MaRIA