The Japan self-checkout systems demand is valued at USD 211.4 million in 2025 and is forecasted to reach USD 448.0 million by 2035, recording a CAGR of 7.8%. Demand is driven by automation needs across supermarkets, convenience stores, pharmacies, and specialty retail chains. Labour shortages, extended operating hours, and rising transaction volumes continue to influence adoption. Retailers use self-checkout systems to reduce queue times, optimise staffing patterns, and support hybrid store formats that combine attended and unattended checkout options. Growth also reflects wider use of cashless payment functions and expanded digital-retail infrastructure.
Stationary self-checkout kiosks represent the leading product type due to their suitability for high-traffic environments and compatibility with diverse product categories. These kiosks integrate barcode scanners, touch interfaces, weight-verification modules, and secure payment terminals. Advances in item-recognition tools, loss-prevention analytics, and user-interface design are improving accuracy and reducing intervention requirements, supporting wider rollout across medium and large-format stores.
Demand is concentrated in Kyushu & Okinawa, Kanto, and Kinki, where dense retail networks and high rates of technology adoption support deployment. Key suppliers include Diebold Nixdorf, Inc., NCR Voyix Corporation, Fujitsu Ltd., Toshiba Global Commerce Solutions, and ITAB Group, offering integrated checkout platforms used in national retail operations.
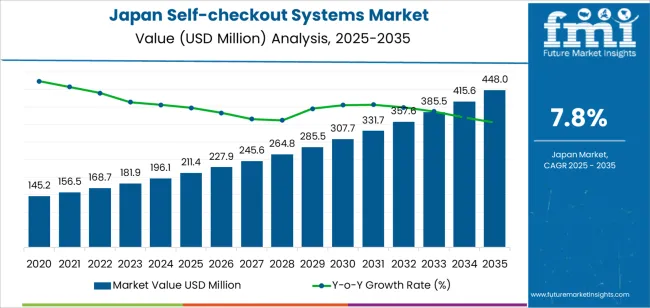
Growth momentum analysis shows a clear early-phase strengthening between 2025 and 2029, driven by labour-shortage pressures, workflow-efficiency needs, and steady adoption across supermarkets, convenience stores, and pharmacy chains. Retailers will expand the use of compact kiosks, camera-assisted scanning units, and mobile-checkout tools to reduce queue times and streamline store operations. This period benefits from active investment in digital in-store systems and rising familiarity with unattended retail formats.
From 2030 to 2035, momentum transitions toward a more stable trajectory as deployments shift from new installations to structured replacement and optimisation cycles. Retailers will focus on integrating self-checkout units with inventory-tracking software, electronic shelf-label systems, and loss-prevention analytics. Growth during this phase remains steady but less accelerated, reflecting a mature adoption environment with predictable utilisation patterns. The momentum profile overall indicates a technology segment moving from strong early adoption toward sustained operational reliance, shaped by consistent retail-automation needs and stable equipment-lifecycle planning across Japan’s food, convenience, and general-merchandise retail networks.
| Metric | Value |
|---|---|
| Japan Self-checkout Systems Sales Value (2025) | USD 211.4 million |
| Japan Self-checkout Systems Forecast Value (2035) | USD 448.0 million |
| Japan Self-checkout Systems Forecast CAGR (2025 to 2035) | 7.8% |
Demand for self-checkout systems in Japan is increasing as retailers face rising labour costs, shrinking workforce availability and consumer expectations for faster, more convenient checkout options. Large convenience store chains, supermarkets and department stores are adopting automated checkout systems to streamline operations and improve customer experience. The shift toward digital payment methods and contactless transactions supports adoption of self-checkout solutions that integrate with mobile wallets and QR-code payments.
Urban environments and smaller retail formats place value on compact kiosk systems that reduce queue times and optimise limited floor space. Constraints include strong preference among Japanese consumers for human interaction, cultural comfort with staffed checkouts and the need for multilingual support given rising tourism. High upfront cost, integration complexity with existing retail IT and difficulty in standardising self-checkout across store networks may slow full rollout. Some chains may adopt hybrid models combining traditional and self-checkout lanes rather than full automation.
Demand for self-checkout systems in Japan reflects broader retail-automation trends, shaped by workforce shortages, high customer-service expectations, and steady investment in digital transaction infrastructure. Adoption patterns vary across product types, payment formats, and end-use categories, influenced by store layout, transaction volume, and operational cost structures. These systems support convenience stores, supermarkets, specialty shops, and mixed-format retail environments that balance throughput needs with floor-space constraints.
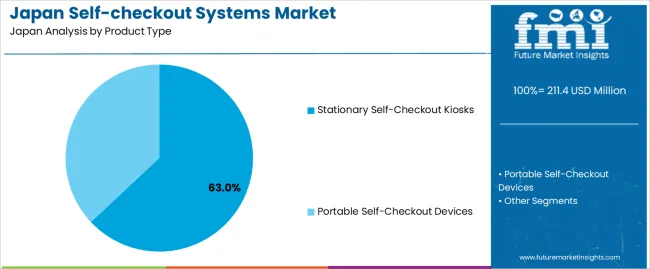
Stationary self-checkout kiosks hold an estimated 63.0% share of demand in Japan, making them the leading product category. Retailers rely on these fixed units for high-throughput environments such as supermarkets and large convenience stores, where stable scanning performance and integrated payment functions support continuous customer flow. Their structured layout accommodates security features and inventory-management integration. Portable self-checkout devices represent 37.0%, serving smaller retail spaces, flexible layouts, and specialty outlets requiring lower installation effort. Portable systems allow rapid deployment and are suited for stores with moderate foot traffic and limited counter space. Product-type distribution reflects transaction intensity, available floor area, and store-automation strategies across Japan’s retail formats.
Key drivers and attributes:
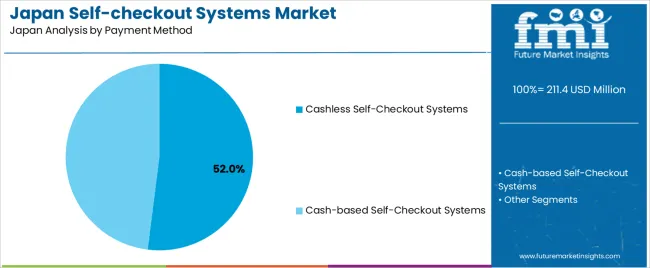
Cashless self-checkout systems hold an estimated 52.0% share and represent the leading payment segment in Japan. Growth reflects wider adoption of contactless cards, smartphone-based wallets, QR-code services, and loyalty-linked payment tools. Cashless systems reduce maintenance requirements, improve transaction speed, and support streamlined checkout experiences. Cash-based systems account for 48.0%, maintaining strong relevance due to Japan’s continued cultural and demographic reliance on physical currency. These units include coin and note-handling components, influencing cost and maintenance cycles. Payment-method distribution reflects Japan’s balanced transition toward digital payments while retaining infrastructure for cash-dependent customer groups across age categories and regional industries.
Key drivers and attributes:

Product manufacturers providing direct installations hold an estimated 41.0% share of Japan’s industry and represent the largest end-use category. Retailers prefer direct procurement for consistent hardware-software compatibility, integrated service support, and long-term operational reliability. Leasing or rental arrangements hold 27.0%, supporting smaller and mid-sized retailers seeking reduced upfront investment and predictable costs. Integration partners represent 23.0%, assisting retailers that operate heterogeneous POS systems requiring custom configuration. The remaining 9.0% reflects procurement through niche distributors and technology resellers. End-use distribution aligns with retail-automation strategy, capital-budget preferences, and the complexity of system integration across Japan’s diverse retail environments.
Key drivers and attributes:
In Japan, demand for self-checkout systems is rising as retailers contend with ageing workforce demographics and rising labour costs which reduce staffing flexibility. The proliferation of convenience stores, small format supermarkets, and mixed-use retail environments increases pressure on checkout lanes and prompts adoption of compact self-checkout units. Japanese consumers display high readiness for digital payments and mobile wallets, which supports self-service checkout deployment. Retail chains are investing in systems that reduce queue times, handle multiple payment types, and support multilingual interfaces to serve tourists and cross-border shoppers.
Self-checkout systems require investment in hardware, software and integration with POS systems, which may limit uptake especially by smaller retail chains. Many Japanese shoppers value human interaction and personalised service, which may reduce the perceived benefit of self-checkout compared with staffed lanes. Retailers must mitigate shrinkage, operational errors and customer support needs in self-checkout zones, which increases operational oversight and hinders broad rollout of unattended systems.
Retailers in Japan are investing in mobile checkout apps, scan-and-go systems and cashier-less store formats to further minimise labour dependence and improve convenience. Self-checkout systems are increasingly integrated with analytics that detect customer behaviour, payment patterns and queue monitoring to optimise staffing and layout. Compact self-checkout units are being deployed in smaller store formats such as drugstores, mini-industries and service stations where space is limited. These trends support increasing demand for self-checkout systems across Japanese retail.
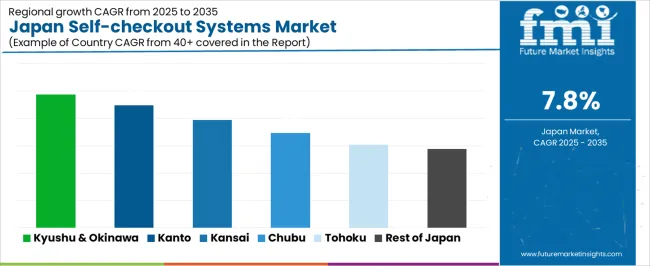
Demand for self-checkout systems in Japan is increasing through 2035 as retailers adopt automated checkout technologies to streamline store operations, reduce queue times, and manage labor shortages. Supermarkets, convenience stores, pharmacies, and home-improvement chains continue integrating barcode scanning stations, cash-handling units, AI-supported loss-prevention features, and camera-assisted verification systems. Growth varies by region based on retail density, consumer adoption of self-service formats, and modernization investments across large and mid-sized retail groups. Retailers also rely on self-checkout systems to support extended operating hours and consistent transaction speed. Kyushu & Okinawa leads with a 9.8% CAGR, followed by Kanto (9.0%), Kinki (7.9%), Chubu (6.9%), Tohoku (6.1%), and the Rest of Japan (5.8%).
| Region | CAGR (2025-2035) |
|---|---|
| Kyushu & Okinawa | 9.8% |
| Kanto | 9.0% |
| Kinki | 7.9% |
| Chubu | 6.9% |
| Tohoku | 6.1% |
| Rest of Japan | 5.8% |
Kyushu & Okinawa grows at 9.8% CAGR, supported by active adoption of automation across supermarkets, convenience stores, and regional retail chains. Fukuoka, Kumamoto, and Kagoshima maintain strong retail networks where operators deploy self-checkout to manage high customer volumes and reduce peak-time congestion. Stores adopt compact kiosk designs suited for limited floor space, while larger chains use hybrid formats combining manned and unmanned checkout lanes. Okinawa’s tourism-linked retail outlets depend on self-service units to accommodate fluctuating visitor traffic. Pharmacies incorporate self-checkout to handle prescription pickups and over-the-counter purchases with minimal staffing. Continuous modernization across regional outlets sustains strong demand for reliable and easy-to-manage systems.

Kanto grows at 9.0% CAGR, driven by Japan’s densest retail environment and rapid adoption of in-store automation across Tokyo, Kanagawa, and Chiba. Supermarkets and drugstores deploy self-checkout systems to manage high daily transaction volumes and reduce store-labor requirements. Convenience stores use compact scanners to support rapid purchases and maintain short wait times in urban districts. Large retail groups invest in AI-supported loss-prevention tools integrated into self-checkout stations. Specialty stores and home-improvement chains adopt self-checkout to support varied product categories and customer flow patterns. Evolving consumer comfort with digital payments reinforces steady system usage across metropolitan areas.
Kinki grows at 7.9% CAGR, supported by broad retail activity across Osaka, Kyoto, and Hyogo. Supermarkets use self-checkout to maintain efficient customer movement during peak shopping periods, while convenience stores rely on compact systems for rapid point-of-sale interactions. Department stores and specialty retailers integrate self-checkout machines to support growing self-service patterns among urban consumers. Pharmacies adopt these systems to manage prescription and OTC purchases more efficiently. Retailers prioritize equipment with reliable scanning accuracy to serve diverse product assortments. Although adoption intensity is lower compared with Kanto, expanded modernization across high-traffic retail districts ensures steady demand.
Chubu grows at 6.9% CAGR, supported by balanced retail expansion across Aichi, Shizuoka, and Mie. Mid-sized supermarket chains deploy self-checkout systems to manage weekday and weekend transaction surges. Retailers in industrial zones adopt these systems to support predictable consumer traffic linked to shift-based work schedules. Home-improvement stores integrate self-checkout to handle bulky or multi-item purchases efficiently. Convenience stores increasingly use compact stations, aligning with regional digital-payment adoption. Although retail density is moderate, consistent modernization programs across regional chains sustain steady demand for scalable self-checkout platforms.
Tohoku grows at 6.1% CAGR, supported by gradual expansion of self-service technologies across supermarkets, pharmacies, and regional convenience stores. Cities such as Sendai and Fukushima see reliable adoption of automated checkout due to moderate but steady retail traffic. Retail chains use self-checkout systems to address staffing constraints and improve transaction flow in both urban and semi-rural settings. Pharmacies deploy compact kiosks to manage rising demand for over-the-counter products. Although consumer traffic is lower than in southern regions, stable usage patterns across daily-needs retail formats support ongoing system deployment.
The Rest of Japan grows at 5.8% CAGR, supported by small-format supermarkets, local convenience chains, and distributed retail operations in rural prefectures. Retailers adopt self-checkout systems to maintain extended operating hours and manage labor shortages without reducing service availability. Compact kiosks suit stores with limited space, while larger regional supermarkets implement dual-lane self-checkout formats. Pharmacies rely on automated systems to streamline high-frequency purchases. Although transaction volumes are lower than in major metropolitan areas, essential retail operations sustain consistent system usage and steady replacement cycles.
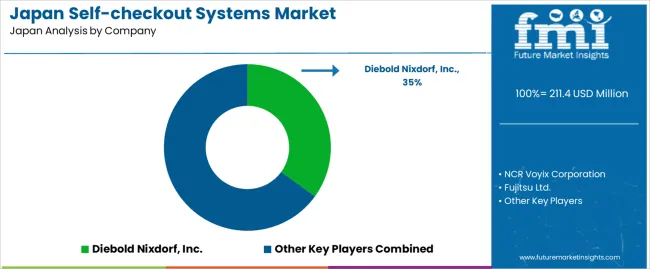
Demand for self-checkout systems in Japan is shaped by a concentrated group of retail-technology suppliers supporting supermarkets, convenience stores, specialty retailers, and mixed-format chains. Diebold Nixdorf, Inc. holds the leading position with an estimated 35.0% share, supported by long-running expertise in automated retail equipment, stable scanner-scale integration, and strong relationships with large Japanese retail groups. Its position is reinforced by dependable uptime, controlled hardware quality, and established nationwide service capability.
NCR Voyix Corporation and Fujitsu Ltd. follow as major participants, supplying modular and configurable systems suited to Japan’s high-traffic retail environments. Their strengths include consistent barcode-recognition performance, user-friendly software, and compatibility with loyalty systems, digital payments, and inventory platforms. Toshiba Global Commerce Solutions maintains a notable presence through self-checkout designs aligned with large supermarket and convenience-store formats, emphasizing durable components and straightforward maintenance. ITAB Group contributes additional capability with compact units tailored to mid-sized retailers seeking efficient deployment and simplified user interaction.
Competition across this segment centers on scanning accuracy, payment-device stability, loss-prevention features, software reliability, and seamless integration with existing POS and back-office systems. Demand remains strong as Japanese retailers expand self-service options to manage labour constraints, reduce queue times, and support hybrid checkout models that blend automated stations with assisted-service positions across diverse retail formats.
| Items | Values |
|---|---|
| Quantitative Units | USD million |
| Product Type | Portable Self-Checkout Devices, Stationary Self-Checkout Kiosks |
| Payment Method | Cash-based Self-Checkout Systems, Cashless Self-Checkout Systems |
| End Use | Product Manufacturers (Direct), Leasing or Rental, Integration Partners, Others |
| Regions Covered | Kyushu & Okinawa, Kanto, Kinki, Chubu, Tohoku, Rest of Japan |
| Key Companies Profiled | Diebold Nixdorf, Inc., NCR Voyix Corporation, Fujitsu Ltd., Toshiba Global Commerce Solutions, ITAB Group |
| Additional Attributes | Dollar sales by product type, payment method, and end-use categories; regional adoption trends across Kyushu & Okinawa, Kanto, Kinki, Chubu, Tohoku, and Rest of Japan; competitive landscape of self-checkout system providers; advancements in cashless payment integration, AI-enabled loss prevention, and compact kiosk designs suited to Japanese retail formats; integration with supermarkets, convenience stores, department stores, and franchise retail chains in Japan. |
The global demand for self-checkout systems in Japan is estimated to be valued at USD 211.4 million in 2025.
The demand for self-checkout systems in Japan is projected to reach USD 448.0 million by 2035.
The demand for self-checkout systems in Japan is expected to grow at a 7.8% CAGR between 2025 and 2035.
The key product types are stationary self-checkout kiosks and portable self-checkout devices.
In terms of payment method, the cashless self-checkout systems segment is expected to command 52.0% share in the demand for self-checkout systems in Japan in 2025.


Our Research Products

The "Full Research Suite" delivers actionable market intel, deep dives on markets or technologies, so clients act faster, cut risk, and unlock growth.

The Leaderboard benchmarks and ranks top vendors, classifying them as Established Leaders, Leading Challengers, or Disruptors & Challengers.

Locates where complements amplify value and substitutes erode it, forecasting net impact by horizon

We deliver granular, decision-grade intel: market sizing, 5-year forecasts, pricing, adoption, usage, revenue, and operational KPIs—plus competitor tracking, regulation, and value chains—across 60 countries broadly.

Spot the shifts before they hit your P&L. We track inflection points, adoption curves, pricing moves, and ecosystem plays to show where demand is heading, why it is changing, and what to do next across high-growth markets and disruptive tech

Real-time reads of user behavior. We track shifting priorities, perceptions of today’s and next-gen services, and provider experience, then pace how fast tech moves from trial to adoption, blending buyer, consumer, and channel inputs with social signals (#WhySwitch, #UX).

Partner with our analyst team to build a custom report designed around your business priorities. From analysing market trends to assessing competitors or crafting bespoke datasets, we tailor insights to your needs.
Supplier Intelligence
Discovery & Profiling
Capacity & Footprint
Performance & Risk
Compliance & Governance
Commercial Readiness
Who Supplies Whom
Scorecards & Shortlists
Playbooks & Docs
Category Intelligence
Definition & Scope
Demand & Use Cases
Cost Drivers
Market Structure
Supply Chain Map
Trade & Policy
Operating Norms
Deliverables
Buyer Intelligence
Account Basics
Spend & Scope
Procurement Model
Vendor Requirements
Terms & Policies
Entry Strategy
Pain Points & Triggers
Outputs
Pricing Analysis
Benchmarks
Trends
Should-Cost
Indexation
Landed Cost
Commercial Terms
Deliverables
Brand Analysis
Positioning & Value Prop
Share & Presence
Customer Evidence
Go-to-Market
Digital & Reputation
Compliance & Trust
KPIs & Gaps
Outputs
Full Research Suite comprises of:
Market outlook & trends analysis
Interviews & case studies
Strategic recommendations
Vendor profiles & capabilities analysis
5-year forecasts
8 regions and 60+ country-level data splits
Market segment data splits
12 months of continuous data updates
DELIVERED AS:
PDF EXCEL ONLINE
Demand Signal Repository Solutions Market Size and Share Forecast Outlook 2025 to 2035
Demand Side Management Market Size and Share Forecast Outlook 2025 to 2035
Demand Response Market Analysis - Size, Share, and Forecast Outlook 2025 to 2035
North America Shipping Supplies Market Trends – Innovations & Growth 2024-2034
Demand of Kozani Saffron in Greece Analysis - Size, Share & Forecast 2025 to 2035
Demand of No-acid Whey Strained Dairy Processing Concepts in European Union Size and Share Forecast Outlook 2025 to 2035
Demand for Bronte Pistachio in Italy Analysis - Size, Share & Forecast 2025 to 2035
Demand and Trend Analysis of Gaming Monitor in Western Europe Size and Share Forecast Outlook 2025 to 2035
Demand and Trend Analysis of Gaming Monitor in Korea Size and Share Forecast Outlook 2025 to 2035
Demand and Trend Analysis of Gaming Monitor in Japan Size and Share Forecast Outlook 2025 to 2035
Glycine Soja (Soybean) Seed Extract Market Size and Share Forecast Outlook 2025 to 2035
Demand and Trend Analysis of Yeast in Japan - Size, Share, and Forecast Outlook 2025 to 2035
Demand of Pistachio-based desserts & ingredients in France Analysis - Size, Share & Forecast 2025 to 2035
Western Europe Men’s Skincare Market Analysis – Forecast 2023-2033
Demand and Trends Analysis of Stevia in Japan Size and Share Forecast Outlook 2025 to 2035
Japan Women’s Intimate Care Market Trends – Growth & Forecast 2024-2034
Demand and Trend Analysis of Fabric Stain Remover in Korea Size and Share Forecast Outlook 2025 to 2035
Demand and Sales Analysis of Paper Cup in Korea Size and Share Forecast Outlook 2025 to 2035
Demand and Sales Analysis of Paper Cup in Western Europe Size and Share Forecast Outlook 2025 to 2035
Demand of MFGM-enriched Powders & RTDs in European Union Size and Share Forecast Outlook 2025 to 2035

Thank you!
You will receive an email from our Business Development Manager. Please be sure to check your SPAM/JUNK folder too.
Chat With
MaRIA