Vascular Parkinsonism Market Size and Share Forecast Outlook 2025 to 2035

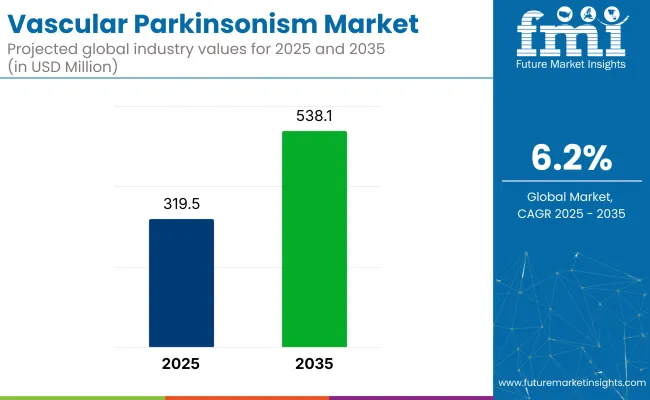
The vascular parkinsonism market is forecasted to grow from USD 319.5 million in 2025 to USD 538.1 million by 2035, at a CAGR of 6.20% during the forecast period. The growth is being driven by the increasing incidence of vascular parkinson's disease and the rising demand for advanced therapeutic options.
Quick Stats in the Vascular Parkinsonism Market

  • Market Value (2025): USD 319.5 million
  • Forecast Value (2035): USD 538.1 million
  • Forecast CAGR: 6.20%
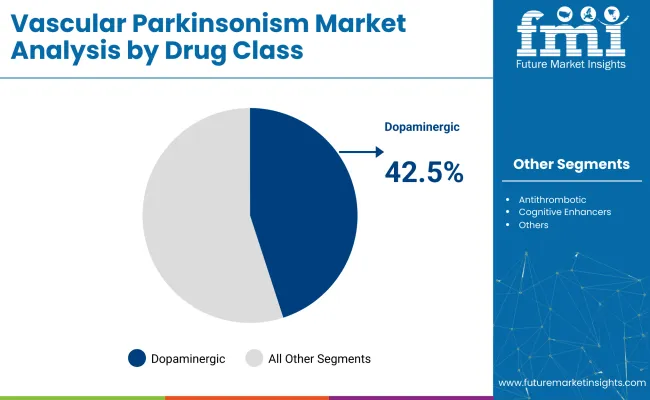
  • Leading Segment in 2025: Dopaminergic Agents (~42.5% share)
  • Key Growth Region: South Asia
  • Top Key Players: Novartis, AbbVie Inc., Teva Pharmaceutical Industries Ltd., Pfizer Inc., Roche Holding AG

Vascular Parkinsonism Market

Vascular parkinsonism, caused by damage to blood vessels in the brain, is characterized by motor and non-motor symptoms. The industry is being influenced by growing awareness of vascular parkinson's disease and advancements in drug development for neurodegenerative diseases.

Vascular parkinsonism has been regarded as a niche indication within the broader neurology industry. In 2025, nearly 1.2% of the Parkinson’s therapeutics industry is expected to be captured by its treatment segment. The share within the larger movement disorders treatment industry is projected to decline to 0.6%. In the neurodegenerative disease therapeutics segment, its share is estimated at 0.35%, and in the central nervous system industry, it drops further to 0.05%.

Around 0.4% of the cerebrovascular therapies industry is anticipated to be attributed to vascular parkinsonism. This limited share is influenced by diagnostic limitations, a scarcity of approved drugs, and ongoing reliance on levodopa. Expansion is expected as screening improves and neuroprotective therapies advance.

ValtteriKaasinen, Professor of Neurology at the University of Turku and principal investigator of the study, stated on April 7, 2025, “Notably, a majority of these diagnostic changes occur within the first two years of diagnosis, which emphasises the challenges and uncertainty clinicians face in diagnosing Parkinson's disease accurately.”

A Phase 1 clinical trial at Mass General Brigham is being conducted to examine a novel treatment approach for Parkinson’s disease. In this trial, patients’ stem cells are being reprogrammed to replace dopamine-producing cells lost due to the disease. Three patients have been enrolled and treated in this first-of-its-kind autologous stem cell transplant trial. A total of six participants will be followed for 12 months to monitor the safety and effectiveness of the procedure

Analyzing Vascular Parkinsonism Market by Top Investment Segments

Strong growth is expected in the vascular parkinsonism market, driven by dopaminergic agents, oral administration routes, and retail pharmacy chains. These factors are ensuring wider accessibility and effective treatment options.

Dopaminergic Agents Predicted to Dominate Vascular Parkinson's Disease Treatment

Dopaminergic agents are expected to dominate the market, holding a 42.5% share in 2025.
  • Dopamine levels in the brain are increased using specific agents to address the underlying neurological deficit in Parkinson’s disease and vascular parkinsonism. These drugs are widely prescribed to manage the motor symptoms. Associated with conditions including tremors, stiffness, and bradykinesia.
  • Key companies like AbbVie, with its prominent product Sinemet, and Merck, with its broader dopaminergic drug portfolio, are major contributors to the availability of these treatments.
  • The rising diagnosis rates of vascular parkinsonism, along with increased awareness and access to treatments, are driving industry growth. As more treatment options become available, dopaminergic agents are expected to remain at the forefront of managing vascular parkinson's disease symptoms.

Vascular Parkinsonism Market Analysis By Drug Class

Oral Medications to Be the Leading Choice in Vascular Parkinson's Disease Treatment

Oral medication is expected to dominate the route of administration segment, with an 81.4% share in 2025.
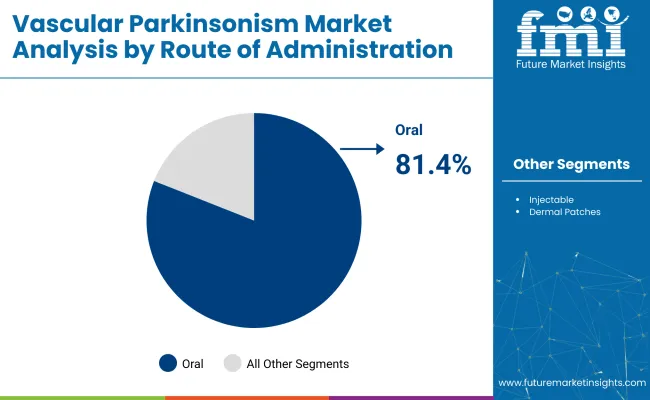
  • Oral medications are favored due to their convenience and ease of administration, making them the preferred choice for long-term treatment regimens. Companies like GlaxoSmithKline with their dopamine agonist product Requip and AbbVie’s Sinemet, an oral levodopa/carbidopa combination, are widely used to treat vascular parkinson's disease
  • Oral drugs are increasingly prescribed because they offer effective symptom relief. They require minimal intervention, making them suitable for use at home. As more patients opt for self-management of their condition, oral medications will continue to drive the growth of the industry.

Vascular Parkinsonism Market Analysis By Route Of Administration

Retail Pharmacy Chains Expected to Lead Sales in Vascular Parkinsonism Drugs

Retail pharmacy chains are projected to hold 42% of the share by 2025.

  • Accessible treatment options are provided through these channels, ensuring that prescribed dopaminergic agents can be conveniently purchased by patients.
  • Companies such as Walgreens and CVS Health are leading the retail pharmacy sector, offering various Parkinson's treatment options through brick-and-mortar stores and online platforms.
  • The growing trend of patient-centered care, where individuals prefer easy access to medication, especially for chronic conditions like vascular parkinsonism, is supporting the dominance of retail pharmacies.
  • Improved online pharmacies and home delivery services are contributing to the widespread availability of drugs.

Top Vascular Parkinsonism Market Dynamics

The vascular parkinsonism market is being driven by the increasing prevalence of cerebrovascular diseases and advancements in diagnostic imaging. However, challenges such as limited awareness and the complexity of distinguishing it from idiopathic Parkinson's disease are hindering industry growth.

Increasing prevalence of cerebrovascular diseases is driving industry growth

The rising incidence of cerebrovascular diseases, including strokes and small vessel disease, is significantly contributing to the demand for vascular parkinson's disease therapies.

  • Ischemic lesions in the brain, particularly in areas involved in motor control, increase the risk of developing vascular parkinsonism.
  • With the aging global population, the prevalence of cerebrovascular events is expected to rise, further elevating the incidence of vascular parkinsonism.
  • The growing burden is prompting healthcare systems to adopt advanced diagnostic and therapeutic interventions, driving the demand for vascular parkinson's disease treatments.

Advancements in diagnostic imaging are enhancing early detection

Advancements in neuroimaging techniques, such as high-resolution MRI and PET scans, are improving the early detection and accurate diagnosis of vascular parkinsonism.
  • Imaging modalities allow for the identification of subtle ischemic changes in the brain, facilitating differentiation from other forms of parkinsonism.
  • Early and precise diagnosis is crucial for initiating appropriate treatment strategies, which can potentially slow disease progression and improve patient outcomes.
  • The enhanced diagnostic capabilities are contributing to the increased adoption of therapies, thereby supporting industry growth.

Analyzing Top Countries Synthesizing, Distributing, and Generating Demand for Vascular Parkinsonism Treatment

Country Wise Analysis Of Vascular Parkinsonism Market

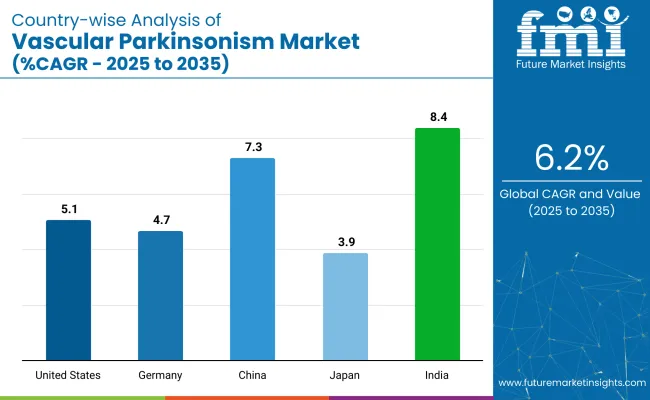
Country CAGR (2025 to 2035)
United States 5.1%
Germany 4.7%
China 7.3%
Japan 3.9%
India 8.4%

The Vascular Parkinsonism industry is expected to grow at a global CAGR of 6.20% from 2025 to 2035, with varying growth rates seen in key countries. The highest growth rate of 8.4% is expected in India, driven by an expanding healthcare infrastructure and rising demand for neurological treatments. A 7.3% growth rate is expected in China, fueled by a large population and an increasing focus on healthcare innovation.

Moderate growth of 5.1% is anticipated in the United States, as the industry remains stable with consistent demand for existing treatments. Slower growth of 4.7% is projected for Germany, while Japan is expected to experience the lowest growth at 3.9%, due to an aging population and slower adoption of new treatments. Emerging countries like India and China are expected to drive the majority of the growth, while developed industry are expected to remain stable but less dynamic.

In-depth Analysis of Vascular Parkinsonism Market in India

India is expected to grow at an 8.4% CAGR through 2035, leading the vascular parkinson's disease treatment industry among major countries, particularly in the BRICS group. The demand is supported by an aging population and increasing healthcare infrastructure. Industry expansion is driven by the rising incidence of cerebrovascular diseases, as well as growing awareness of vascular parkinson's diseaseas a distinct neurodegenerative disorder. The industry growth is being accelerated by government healthcare initiatives and increasing access to affordable medical treatments.

  • Rising incidence of cerebrovascular diseases, including strokes, is contributing to demand.
  • Increased focus on early diagnosis and advanced treatments is being observed.
  • Growing healthcare infrastructure and awareness programs are driving industry growth.

Sales Analysis of Vascular Parkinsonism Market in the United States

The USA market is projected to grow at a 5.1% CAGR, reflecting steady demand for vascular parkinson's disease treatments, particularly within the OECD group. Growth is being driven by the adoption of advanced diagnostic technologies, including neuroimaging, and the aging baby boomer population. Despite the industry remaining niche, increased diagnosis and treatment adoption are being supported by government funding and the expansion of telehealth services. Significant R&D investments are being made to improve therapeutic outcomes for patients.

  • Advanced diagnostic technologies are being widely adopted.
  • Increased focus on personalized treatment options is contributing to growth.
  • Government and insurance support are enabling easier treatment access.

Demand Outlook for Vascular Parkinsonism Market in Germany

Germany’s market for Vascular Parkinsonism is expected to grow at a 4.7% CAGR by 2035, contributing to the growth of the EU market. The development and adoption of effective treatments are being facilitated by the country’s advanced healthcare system and robust research capabilities. Long-term care solutions are being emphasized by healthcare policies, benefiting patients. Industry expansion is being supported by an aging population and rising stroke incidence, with neuroprotective treatments being increasingly integrated into care strategies.

  • Research and clinical trials are being strongly focused on.
  • Rising incidence of strokes among the elderly is contributing to industry growth.
  • Strong healthcare infrastructure is enabling easier treatment access.

Opportunity Analysis of Vascular Parkinsonism Market in China

China is expected to grow at a 7.3% CAGR through 2035, leading the BRICS group in vascular parkinson's disease industry growth. The adoption of advanced diagnostic methods, along with greater awareness of vascular Parkinsonism, is propelling the industry. Industry development is being supported by China’s growing focus on improving healthcare systems and expanding access to specialized treatments. Government initiatives to address neurodegenerative diseases are expected to further accelerate industry growth.

  • Rising stroke incidence and an aging population are driving demand.
  • Early diagnostic methods are being increasingly adopted.
  • Government-led healthcare innovation is supporting industry development.

Demand Analysis for Vascular Parkinsonism Market in Japan

The sales in Japan for Vascular Parkinsonism is projected to grow at a 3.9% CAGR through 2035, contributing to the growth of the OECD region. The demand for neurodegenerative treatments, including therapies, is being driven by the aging population. Industry growth is being supported by Japan’s emphasis on precision medicine, neuroimaging, and clinical research. Although vascular parkinson's disease remains a specialized focus, steady growth is being ensured by Japan's leadership in pharmaceutical development and healthcare technology.

  • Precision medicine and diagnostic tools are being highly emphasized.
  • Increased demand is being contributed to by the aging population.
  • Clinical research is supporting industry development.

Vascular Parkinsonism Market Growth Outlook in Germany

Germany’s Vascular Parkinsonism demand is projected to grow at a steady 4.7% CAGR through 2035, contributing significantly to the EU market. The solid foundation for developing effective treatments is being provided by the country’s efficient healthcare system. The growth of the industry is being driven by focused clinical trials and the integration of new diagnostic technologies, such as neuroimaging and biomarkers. Additionally, the aging population and rising cases of cerebrovascular diseases are contributing to industry expansion.
  • New diagnostic technologies are being integrated into treatment strategies.
  • Research funding and clinical trials are being increased.
  • Rising prevalence of cerebrovascular diseases among the elderly is contributing to growth.

Leading Players in the Vascular Parkinsonism Market

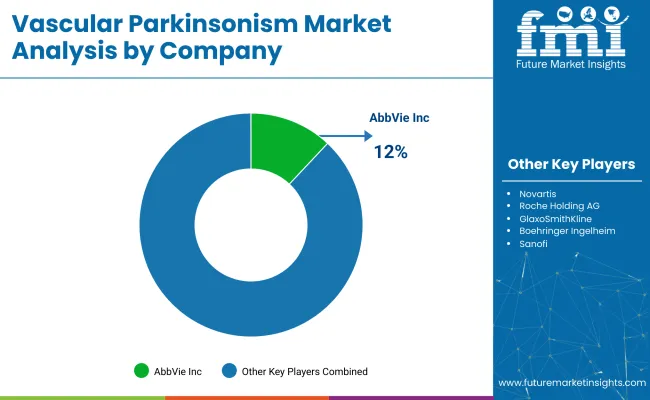
Vascular Parkinsonism Market Analysis By Company

The Parkinson's disease treatment industry features a semi-consolidated competitive landscape, segmented into dominant players, key players, and emerging firms. Dominant players such as AbbVie, Merck & Co., and GlaxoSmithKline hold leading positions, supported by strong R&D pipelines, branded therapies like levodopa combinations, and global commercialization strategies. Key players including Novartis, Teva, and UCB focus on diversified neurology portfolios and next-generation dopamine agonists.

Emerging players such as Acadia Pharmaceuticals, Amneal, and Sun Pharma are expanding their presence through generics, novel delivery systems, and niche indications like non-motor symptoms and advanced-stage management, enhancing accessibility and innovation in Parkinson’s disease therapeutics.

Recent Vascular Parkinsonism Industry News

  • In April 2025, BlueRock Therapeutics, a subsidiary of Bayer AG, announced the publication of 18-month data from its Phase 1 clinical trial for bemdaneprocel, an investigational cell therapy for Parkinson’s disease, in Nature. The study demonstrated sustained neuron cell engraftment and no serious adverse events following immunosuppression discontinuation. A Phase 3 trial is expected to begin in the first half of 2025.
  • In August 2024,AbbVie completed the acquisition of Cerevel Therapeutics, gaining access to tavapadon, a selective dopamine D1/D5 receptor partial agonist for Parkinson’s disease. The drug is expected to launch in the USA in 2025.

Key Players in the Vascular Parkinsonism Market

  • Novartis
  • AbbVie Inc.
  • Teva Pharmaceutical Industries Ltd.
  • Pfizer Inc.
  • Roche Holding AG
  • GlaxoSmithKline (GSK)
  • BoehringerIngelheim
  • Sanofi
  • Sun Pharmaceutical Industries Ltd.

Research Coverage and Scope Summary

Report Attributes Details
Market Size (2025) USD 319.5 million
Projected Market Size (2035) USD 538.1 million
CAGR (2025 to 2035) 6.20%
Base Year for Estimation 2024
Historical Period 2020 to 2024
Projections Period 2025 to 2035
Quantitative Units USD million for value and million units for volume
Drug Classes Analyzed (Segment 1) Dopaminergic Agents, Antithrombotic Agents, Cognitive Enhancers, Antihypertensive Agents, Muscle Relaxants
Routes of Administration Analyzed (Segment 2) Oral, Injectable, Dermal Patches
Sales Channels Analyzed (Segment 3) Hospitals, Neurology Clinics, Retail Pharmacy Chains, Mail-Order Pharmacies
Regions Covered North America, Western Europe, East Asia, South Asia
Countries Covered United States, Canada, Germany, United Kingdom, France, Italy, Spain, China, India, Japan, South Korea, Australia, Brazil, Mexico, Argentina, Saudi Arabia, UAE, South Africa
Key Players Novartis, AbbVie Inc., Teva Pharmaceutical, Pfizer Inc., Roche Holding AG, GlaxoSmithKline, Boehringer Ingelheim, Sanofi, Sun Pharmaceutical
Additional Attributes Dollar sales, share by drug class and route of administration, increasing demand for cognitive enhancers and antithrombotic agents, regional market growth in neurology clinics, advancements in muscle relaxants and injectable formulations

Vascular Parkinsonism Market Analyzed by Key Investment Segments

By Drug Class:

The industry is segmented into dopaminergic agents, antithrombotic agents, cognitive enhancers, antihypertensive agents, and muscle relaxants.

By Route of Administration:

The industry includes oral, injectable, and dermal patches.

By Sales Channel:

The industry covers hospitals, neurology clinics, retail pharmacy chains, and mail-order pharmacies.

By Region:

The industry spans North America, Western Europe, East Asia, and South Asia.

Table of Content

  1. Executive Summary
    • Global Market Outlook
    • Demand-side Trends
    • Supply-side Trends
    • Technology Roadmap Analysis
    • Analysis and Recommendations
  2. Market Overview
    • Market Coverage / Taxonomy
    • Market Definition / Scope / Limitations
  3. Market Background
    • Market Dynamics
      • Drivers
      • Restraints
      • Opportunity
      • Trends
    • Scenario Forecast
      • Demand in Optimistic Scenario
      • Demand in Likely Scenario
      • Demand in Conservative Scenario
    • Opportunity Map Analysis
    • Product Life Cycle Analysis
    • Supply Chain Analysis
      • Supply Side Participants and their Roles
        • Producers
        • Mid-Level Participants (Traders/ Agents/ Brokers)
        • Wholesalers and Distributors
      • Value Added and Value Created at Node in the Supply Chain
      • List of Raw Material Suppliers
      • List of Existing and Potential Buyer’s
    • Investment Feasibility Matrix
    • Value Chain Analysis
      • Profit Margin Analysis
      • Wholesalers and Distributors
      • Retailers
    • PESTLE and Porter’s Analysis
    • Regulatory Landscape
      • By Key Regions
      • By Key Countries
    • Regional Parent Market Outlook
    • Production and Consumption Statistics
    • Import and Export Statistics
  4. Global Market Analysis 2020 to 2024 and Forecast, 2025 to 2035
    • Historical Market Size Value (USD Million) & Volume (Mn unit) Analysis, 2020 to 2024
    • Current and Future Market Size Value (USD Million) & Volume (Mn unit) Projections, 2025 to 2035
      • Y-o-Y Growth Trend Analysis
      • Absolute $ Opportunity Analysis
  5. Global Market Pricing Analysis 2020 to 2024 and Forecast 2025 to 2035
  6. Global Market Analysis 2020 to 2024 and Forecast 2025 to 2035, By Drug Class
    • Introduction / Key Findings
    • Historical Market Size Value (USD Million) & Volume (Mn unit) Analysis By Drug Class, 2020 to 2024
    • Current and Future Market Size Value (USD Million) & Volume (Mn unit) Analysis and Forecast By Drug Class, 2025 to 2035
      • Dopaminergic Agents
      • Antithrombotic Agents
      • Cognitive Enhancers
      • Antihypertensive
    • Y-o-Y Growth Trend Analysis By Drug Class, 2020 to 2024
    • Absolute $ Opportunity Analysis By Drug Class, 2025 to 2035
  7. Global Market Analysis 2020 to 2024 and Forecast 2025 to 2035, By Route of Administration
    • Introduction / Key Findings
    • Historical Market Size Value (USD Million) & Volume (Mn unit) Analysis By Route of Administration, 2020 to 2024
    • Current and Future Market Size Value (USD Million) & Volume (Mn unit) Analysis and Forecast By Route of Administration, 2025 to 2035
      • Oral
      • Injectable
      • Dermal Patches
    • Y-o-Y Growth Trend Analysis By Route of Administration, 2020 to 2024
    • Absolute $ Opportunity Analysis By Route of Administration, 2025 to 2035
  8. Global Market Analysis 2020 to 2024 and Forecast 2025 to 2035, By Sales Channel
    • Introduction / Key Findings
    • Historical Market Size Value (USD Million) & Volume (Mn unit) Analysis By Sales Channel, 2020 to 2024
    • Current and Future Market Size Value (USD Million) & Volume (Mn unit) Analysis and Forecast By Sales Channel, 2025 to 2035
      • Hospitals
      • Neurology Clinics
      • Retail Pharmacy Chains
      • Mail-Order Pharmacies
    • Y-o-Y Growth Trend Analysis By Sales Channel, 2020 to 2024
    • Absolute $ Opportunity Analysis By Sales Channel, 2025 to 2035
  9. Global Market Analysis 2020 to 2024 and Forecast 2025 to 2035, By Region
    • Introduction
    • Historical Market Size Value (USD Million) & Volume (Mn unit) Analysis By Region, 2020 to 2024
    • Current Market Size Value (USD Million) & Volume (Mn unit) Analysis and Forecast By Region, 2025 to 2035
      • North America
      • Latin America
      • Western Europe
      • Eastern Europe
      • East Asia
      • South Asia & Pacific
      • Middle East and Africa
    • Market Attractiveness Analysis By Region
  10. North America Market Analysis 2020 to 2024 and Forecast 2025 to 2035, By Country
    • Historical Market Size Value (USD Million) & Volume (Mn unit) Trend Analysis By Market Taxonomy, 2020 to 2024
    • Market Size Value (USD Million) & Volume (Mn unit) Forecast By Market Taxonomy, 2025 to 2035
      • By Country
        • USA
        • Canada
        • Mexico
      • By Drug Class
      • By Route of Administration
      • By Sales Channel
    • Market Attractiveness Analysis
      • By Country
      • By Drug Class
      • By Route of Administration
      • By Sales Channel
    • Key Takeaways
  11. Latin America Market Analysis 2020 to 2024 and Forecast 2025 to 2035, By Country
    • Historical Market Size Value (USD Million) & Volume (Mn unit) Trend Analysis By Market Taxonomy, 2020 to 2024
    • Market Size Value (USD Million) & Volume (Mn unit) Forecast By Market Taxonomy, 2025 to 2035
      • By Country
        • Brazil
        • Argentina
        • Rest of LATAM
      • By Drug Class
      • By Route of Administration
      • By Sales Channel
    • Market Attractiveness Analysis
      • By Country
      • By Drug Class
      • By Route of Administration
      • By Sales Channel
    • Key Takeaways
  12. Western Europe Market Analysis 2020 to 2024 and Forecast 2025 to 2035, By Country
    • Historical Market Size Value (USD Million) & Volume (Mn unit) Trend Analysis By Market Taxonomy, 2020 to 2024
    • Market Size Value (USD Million) & Volume (Mn unit) Forecast By Market Taxonomy, 2025 to 2035
      • By Country
        • Germany
        • Italy
        • France
        • UK
        • Spain
        • BENELUX
        • Nordic
        • Rest of W.Europe
      • By Drug Class
      • By Route of Administration
      • By Sales Channel
    • Market Attractiveness Analysis
      • By Country
      • By Drug Class
      • By Route of Administration
      • By Sales Channel
    • Key Takeaways
  13. Eastern Europe Market Analysis 2020 to 2024 and Forecast 2025 to 2035, By Country
    • Historical Market Size Value (USD Million) & Volume (Mn unit) Trend Analysis By Market Taxonomy, 2020 to 2024
    • Market Size Value (USD Million) & Volume (Mn unit) Forecast By Market Taxonomy, 2025 to 2035
      • By Country
        • Russia
        • Hungary
        • Poland
        • Balkan & Baltics
        • Rest of E. Europe
      • By Drug Class
      • By Route of Administration
      • By Sales Channel
    • Market Attractiveness Analysis
      • By Country
      • By Drug Class
      • By Route of Administration
      • By Sales Channel
    • Key Takeaways
  14. East Asia Market Analysis 2020 to 2024 and Forecast 2025 to 2035, By Country
    • Historical Market Size Value (USD Million) & Volume (Mn unit) Trend Analysis By Market Taxonomy, 2020 to 2024
    • Market Size Value (USD Million) & Volume (Mn unit) Forecast By Market Taxonomy, 2025 to 2035
      • By Country
        • China
        • Japan
        • South Korea
      • By Drug Class
      • By Route of Administration
      • By Sales Channel
    • Market Attractiveness Analysis
      • By Country
      • By Drug Class
      • By Route of Administration
      • By Sales Channel
    • Key Takeaways
  15. South Asia & Pacific Market Analysis 2020 to 2024 and Forecast 2025 to 2035, By Country
    • Historical Market Size Value (USD Million) & Volume (Mn unit) Trend Analysis By Market Taxonomy, 2020 to 2024
    • Market Size Value (USD Million) & Volume (Mn unit) Forecast By Market Taxonomy, 2025 to 2035
      • By Country
        • India
        • Australia & New Zealand
        • ASEAN
        • Rest of SAP
      • By Drug Class
      • By Route of Administration
      • By Sales Channel
    • Market Attractiveness Analysis
      • By Country
      • By Drug Class
      • By Route of Administration
      • By Sales Channel
    • Key Takeaways
  16. Middle East and Africa Market Analysis 2020 to 2024 and Forecast 2025 to 2035, By Country
    • Historical Market Size Value (USD Million) & Volume (Mn unit) Trend Analysis By Market Taxonomy, 2020 to 2024
    • Market Size Value (USD Million) & Volume (Mn unit) Forecast By Market Taxonomy, 2025 to 2035
      • By Country
        • GCC Countries
        • Northern Africa
        • South Africa
        • Turkiye
        • Rest of MEA
      • By Drug Class
      • By Route of Administration
      • By Sales Channel
    • Market Attractiveness Analysis
      • By Country
      • By Drug Class
      • By Route of Administration
      • By Sales Channel
    • Key Takeaways
  17. Key Countries Market Analysis
    • USA
      • Pricing Analysis
      • Market Share Analysis, 2024
        • By Drug Class
        • By Route of Administration
        • By Sales Channel
    • Canada
      • Pricing Analysis
      • Market Share Analysis, 2024
        • By Drug Class
        • By Route of Administration
        • By Sales Channel
    • Brazil
      • Pricing Analysis
      • Market Share Analysis, 2024
        • By Drug Class
        • By Route of Administration
        • By Sales Channel
    • Mexico
      • Pricing Analysis
      • Market Share Analysis, 2024
        • By Drug Class
        • By Route of Administration
        • By Sales Channel
    • Argentina
      • Pricing Analysis
      • Market Share Analysis, 2024
        • By Drug Class
        • By Route of Administration
        • By Sales Channel
  18. Market Structure Analysis
    • Competition Dashboard
    • Competition Benchmarking
    • Market Share Analysis of Top Players
      • By Regional
      • By Drug Class
      • By Route of Administration
      • By Sales Channel
  19. Competition Analysis
    • Competition Deep Dive
      • Novartis
        • Overview
        • Product Portfolio
        • Profitability by Market Segments (Product/Age /Sales Channel/Region)
        • Sales Footprint
        • Strategy Overview
          • Marketing Strategy
          • Product Strategy
          • Channel Strategy
      • AbbVie Inc.
        • Overview
        • Product Portfolio
        • Profitability by Market Segments (Product/Age /Sales Channel/Region)
        • Sales Footprint
        • Strategy Overview
          • Marketing Strategy
          • Product Strategy
          • Channel Strategy
      • Teva Pharmaceutical Industries Ltd.
        • Overview
        • Product Portfolio
        • Profitability by Market Segments (Product/Age /Sales Channel/Region)
        • Sales Footprint
        • Strategy Overview
          • Marketing Strategy
          • Product Strategy
          • Channel Strategy
      • Pfizer Inc.
        • Overview
        • Product Portfolio
        • Profitability by Market Segments (Product/Age /Sales Channel/Region)
        • Sales Footprint
        • Strategy Overview
          • Marketing Strategy
          • Product Strategy
          • Channel Strategy
      • Roche Holding AG
        • Overview
        • Product Portfolio
        • Profitability by Market Segments (Product/Age /Sales Channel/Region)
        • Sales Footprint
        • Strategy Overview
          • Marketing Strategy
          • Product Strategy
          • Channel Strategy
      • GlaxoSmithKline (GSK)
        • Overview
        • Product Portfolio
        • Profitability by Market Segments (Product/Age /Sales Channel/Region)
        • Sales Footprint
        • Strategy Overview
          • Marketing Strategy
          • Product Strategy
          • Channel Strategy
      • Boehringer Ingelheim
        • Overview
        • Product Portfolio
        • Profitability by Market Segments (Product/Age /Sales Channel/Region)
        • Sales Footprint
        • Strategy Overview
          • Marketing Strategy
          • Product Strategy
          • Channel Strategy
      • Sanofi
        • Overview
        • Product Portfolio
        • Profitability by Market Segments (Product/Age /Sales Channel/Region)
        • Sales Footprint
        • Strategy Overview
          • Marketing Strategy
          • Product Strategy
          • Channel Strategy
      • Sun Pharmaceutical Industries Ltd.
        • Overview
        • Product Portfolio
        • Profitability by Market Segments (Product/Age /Sales Channel/Region)
        • Sales Footprint
        • Strategy Overview
          • Marketing Strategy
          • Product Strategy
          • Channel Strategy
  20. Assumptions & Acronyms Used
  21. Research Methodology

List of Tables

  • Table 1: Global Market Value (USD Million) Forecast by Region, 2020 to 2035
  • Table 2: Global Market Volume (Mn unit) Forecast by Region, 2020 to 2035
  • Table 3: Global Market Value (USD Million) Forecast by Drug Class, 2020 to 2035
  • Table 4: Global Market Volume (Mn unit) Forecast by Drug Class, 2020 to 2035
  • Table 5: Global Market Value (USD Million) Forecast by Route of Administration, 2020 to 2035
  • Table 6: Global Market Volume (Mn unit) Forecast by Route of Administration, 2020 to 2035
  • Table 7: Global Market Value (USD Million) Forecast by Sales Channel, 2020 to 2035
  • Table 8: Global Market Volume (Mn unit) Forecast by Sales Channel, 2020 to 2035
  • Table 9: North America Market Value (USD Million) Forecast by Country, 2020 to 2035
  • Table 10: North America Market Volume (Mn unit) Forecast by Country, 2020 to 2035
  • Table 11: North America Market Value (USD Million) Forecast by Drug Class, 2020 to 2035
  • Table 12: North America Market Volume (Mn unit) Forecast by Drug Class, 2020 to 2035
  • Table 13: North America Market Value (USD Million) Forecast by Route of Administration, 2020 to 2035
  • Table 14: North America Market Volume (Mn unit) Forecast by Route of Administration, 2020 to 2035
  • Table 15: North America Market Value (USD Million) Forecast by Sales Channel, 2020 to 2035
  • Table 16: North America Market Volume (Mn unit) Forecast by Sales Channel, 2020 to 2035
  • Table 17: Latin America Market Value (USD Million) Forecast by Country, 2020 to 2035
  • Table 18: Latin America Market Volume (Mn unit) Forecast by Country, 2020 to 2035
  • Table 19: Latin America Market Value (USD Million) Forecast by Drug Class, 2020 to 2035
  • Table 20: Latin America Market Volume (Mn unit) Forecast by Drug Class, 2020 to 2035
  • Table 21: Latin America Market Value (USD Million) Forecast by Route of Administration, 2020 to 2035
  • Table 22: Latin America Market Volume (Mn unit) Forecast by Route of Administration, 2020 to 2035
  • Table 23: Latin America Market Value (USD Million) Forecast by Sales Channel, 2020 to 2035
  • Table 24: Latin America Market Volume (Mn unit) Forecast by Sales Channel, 2020 to 2035
  • Table 25: Western Europe Market Value (USD Million) Forecast by Country, 2020 to 2035
  • Table 26: Western Europe Market Volume (Mn unit) Forecast by Country, 2020 to 2035
  • Table 27: Western Europe Market Value (USD Million) Forecast by Drug Class, 2020 to 2035
  • Table 28: Western Europe Market Volume (Mn unit) Forecast by Drug Class, 2020 to 2035
  • Table 29: Western Europe Market Value (USD Million) Forecast by Route of Administration, 2020 to 2035
  • Table 30: Western Europe Market Volume (Mn unit) Forecast by Route of Administration, 2020 to 2035
  • Table 31: Western Europe Market Value (USD Million) Forecast by Sales Channel, 2020 to 2035
  • Table 32: Western Europe Market Volume (Mn unit) Forecast by Sales Channel, 2020 to 2035
  • Table 33: Eastern Europe Market Value (USD Million) Forecast by Country, 2020 to 2035
  • Table 34: Eastern Europe Market Volume (Mn unit) Forecast by Country, 2020 to 2035
  • Table 35: Eastern Europe Market Value (USD Million) Forecast by Drug Class, 2020 to 2035
  • Table 36: Eastern Europe Market Volume (Mn unit) Forecast by Drug Class, 2020 to 2035
  • Table 37: Eastern Europe Market Value (USD Million) Forecast by Route of Administration, 2020 to 2035
  • Table 38: Eastern Europe Market Volume (Mn unit) Forecast by Route of Administration, 2020 to 2035
  • Table 39: Eastern Europe Market Value (USD Million) Forecast by Sales Channel, 2020 to 2035
  • Table 40: Eastern Europe Market Volume (Mn unit) Forecast by Sales Channel, 2020 to 2035
  • Table 41: East Asia Market Value (USD Million) Forecast by Country, 2020 to 2035
  • Table 42: East Asia Market Volume (Mn unit) Forecast by Country, 2020 to 2035
  • Table 43: East Asia Market Value (USD Million) Forecast by Drug Class, 2020 to 2035
  • Table 44: East Asia Market Volume (Mn unit) Forecast by Drug Class, 2020 to 2035
  • Table 45: East Asia Market Value (USD Million) Forecast by Route of Administration, 2020 to 2035
  • Table 46: East Asia Market Volume (Mn unit) Forecast by Route of Administration, 2020 to 2035
  • Table 47: East Asia Market Value (USD Million) Forecast by Sales Channel, 2020 to 2035
  • Table 48: East Asia Market Volume (Mn unit) Forecast by Sales Channel, 2020 to 2035
  • Table 49: South Asia & Pacific Market Value (USD Million) Forecast by Country, 2020 to 2035
  • Table 50: South Asia & Pacific Market Volume (Mn unit) Forecast by Country, 2020 to 2035
  • Table 51: South Asia & Pacific Market Value (USD Million) Forecast by Drug Class, 2020 to 2035
  • Table 52: South Asia & Pacific Market Volume (Mn unit) Forecast by Drug Class, 2020 to 2035
  • Table 53: South Asia & Pacific Market Value (USD Million) Forecast by Route of Administration, 2020 to 2035
  • Table 54: South Asia & Pacific Market Volume (Mn unit) Forecast by Route of Administration, 2020 to 2035
  • Table 55: South Asia & Pacific Market Value (USD Million) Forecast by Sales Channel, 2020 to 2035
  • Table 56: South Asia & Pacific Market Volume (Mn unit) Forecast by Sales Channel, 2020 to 2035
  • Table 57: Middle East and Africa Market Value (USD Million) Forecast by Country, 2020 to 2035
  • Table 58: Middle East and Africa Market Volume (Mn unit) Forecast by Country, 2020 to 2035
  • Table 59: Middle East and Africa Market Value (USD Million) Forecast by Drug Class, 2020 to 2035
  • Table 60: Middle East and Africa Market Volume (Mn unit) Forecast by Drug Class, 2020 to 2035
  • Table 61: Middle East and Africa Market Value (USD Million) Forecast by Route of Administration, 2020 to 2035
  • Table 62: Middle East and Africa Market Volume (Mn unit) Forecast by Route of Administration, 2020 to 2035
  • Table 63: Middle East and Africa Market Value (USD Million) Forecast by Sales Channel, 2020 to 2035
  • Table 64: Middle East and Africa Market Volume (Mn unit) Forecast by Sales Channel, 2020 to 2035

List of Figures

  • Figure 1: Global Market Volume (Mn unit) Forecast 2020 to 2035
  • Figure 2: Global Market Pricing Analysis
  • Figure 3: Global Market Value (USD Million) Forecast 2020 to 2035
  • Figure 4: Global Market Value Share and BPS Analysis by Drug Class, 2025 and 2035
  • Figure 5: Global Market Y-o-Y Growth Comparison by Drug Class, 2025 to 2035
  • Figure 6: Global Market Attractiveness Analysis by Drug Class
  • Figure 7: Global Market Value Share and BPS Analysis by Route of Administration, 2025 and 2035
  • Figure 8: Global Market Y-o-Y Growth Comparison by Route of Administration, 2025 to 2035
  • Figure 9: Global Market Attractiveness Analysis by Route of Administration
  • Figure 10: Global Market Value Share and BPS Analysis by Sales Channel, 2025 and 2035
  • Figure 11: Global Market Y-o-Y Growth Comparison by Sales Channel, 2025 to 2035
  • Figure 12: Global Market Attractiveness Analysis by Sales Channel
  • Figure 13: Global Market Value (USD Million) Share and BPS Analysis by Region, 2025 and 2035
  • Figure 14: Global Market Y-o-Y Growth Comparison by Region, 2025 to 2035
  • Figure 15: Global Market Attractiveness Analysis by Region
  • Figure 16: North America Market Incremental $ Opportunity, 2025 to 2035
  • Figure 17: Latin America Market Incremental $ Opportunity, 2025 to 2035
  • Figure 18: Western Europe Market Incremental $ Opportunity, 2025 to 2035
  • Figure 19: Eastern Europe Market Incremental $ Opportunity, 2025 to 2035
  • Figure 20: East Asia Market Incremental $ Opportunity, 2025 to 2035
  • Figure 21: South Asia & Pacific Market Incremental $ Opportunity, 2025 to 2035
  • Figure 22: Middle East and Africa Market Incremental $ Opportunity, 2025 to 2035
  • Figure 23: North America Market Value Share and BPS Analysis by Country, 2025 and 2035
  • Figure 24: North America Market Value Share and BPS Analysis by Drug Class, 2025 and 2035
  • Figure 25: North America Market Y-o-Y Growth Comparison by Drug Class, 2025 to 2035
  • Figure 26: North America Market Attractiveness Analysis by Drug Class
  • Figure 27: North America Market Value Share and BPS Analysis by Route of Administration, 2025 and 2035
  • Figure 28: North America Market Y-o-Y Growth Comparison by Route of Administration, 2025 to 2035
  • Figure 29: North America Market Attractiveness Analysis by Route of Administration
  • Figure 30: North America Market Value Share and BPS Analysis by Sales Channel, 2025 and 2035
  • Figure 31: North America Market Y-o-Y Growth Comparison by Sales Channel, 2025 to 2035
  • Figure 32: North America Market Attractiveness Analysis by Sales Channel
  • Figure 33: Latin America Market Value Share and BPS Analysis by Country, 2025 and 2035
  • Figure 34: Latin America Market Value Share and BPS Analysis by Drug Class, 2025 and 2035
  • Figure 35: Latin America Market Y-o-Y Growth Comparison by Drug Class, 2025 to 2035
  • Figure 36: Latin America Market Attractiveness Analysis by Drug Class
  • Figure 37: Latin America Market Value Share and BPS Analysis by Route of Administration, 2025 and 2035
  • Figure 38: Latin America Market Y-o-Y Growth Comparison by Route of Administration, 2025 to 2035
  • Figure 39: Latin America Market Attractiveness Analysis by Route of Administration
  • Figure 40: Latin America Market Value Share and BPS Analysis by Sales Channel, 2025 and 2035
  • Figure 41: Latin America Market Y-o-Y Growth Comparison by Sales Channel, 2025 to 2035
  • Figure 42: Latin America Market Attractiveness Analysis by Sales Channel
  • Figure 43: Western Europe Market Value Share and BPS Analysis by Country, 2025 and 2035
  • Figure 44: Western Europe Market Value Share and BPS Analysis by Drug Class, 2025 and 2035
  • Figure 45: Western Europe Market Y-o-Y Growth Comparison by Drug Class, 2025 to 2035
  • Figure 46: Western Europe Market Attractiveness Analysis by Drug Class
  • Figure 47: Western Europe Market Value Share and BPS Analysis by Route of Administration, 2025 and 2035
  • Figure 48: Western Europe Market Y-o-Y Growth Comparison by Route of Administration, 2025 to 2035
  • Figure 49: Western Europe Market Attractiveness Analysis by Route of Administration
  • Figure 50: Western Europe Market Value Share and BPS Analysis by Sales Channel, 2025 and 2035
  • Figure 51: Western Europe Market Y-o-Y Growth Comparison by Sales Channel, 2025 to 2035
  • Figure 52: Western Europe Market Attractiveness Analysis by Sales Channel
  • Figure 53: Eastern Europe Market Value Share and BPS Analysis by Country, 2025 and 2035
  • Figure 54: Eastern Europe Market Value Share and BPS Analysis by Drug Class, 2025 and 2035
  • Figure 55: Eastern Europe Market Y-o-Y Growth Comparison by Drug Class, 2025 to 2035
  • Figure 56: Eastern Europe Market Attractiveness Analysis by Drug Class
  • Figure 57: Eastern Europe Market Value Share and BPS Analysis by Route of Administration, 2025 and 2035
  • Figure 58: Eastern Europe Market Y-o-Y Growth Comparison by Route of Administration, 2025 to 2035
  • Figure 59: Eastern Europe Market Attractiveness Analysis by Route of Administration
  • Figure 60: Eastern Europe Market Value Share and BPS Analysis by Sales Channel, 2025 and 2035
  • Figure 61: Eastern Europe Market Y-o-Y Growth Comparison by Sales Channel, 2025 to 2035
  • Figure 62: Eastern Europe Market Attractiveness Analysis by Sales Channel
  • Figure 63: East Asia Market Value Share and BPS Analysis by Country, 2025 and 2035
  • Figure 64: East Asia Market Value Share and BPS Analysis by Drug Class, 2025 and 2035
  • Figure 65: East Asia Market Y-o-Y Growth Comparison by Drug Class, 2025 to 2035
  • Figure 66: East Asia Market Attractiveness Analysis by Drug Class
  • Figure 67: East Asia Market Value Share and BPS Analysis by Route of Administration, 2025 and 2035
  • Figure 68: East Asia Market Y-o-Y Growth Comparison by Route of Administration, 2025 to 2035
  • Figure 69: East Asia Market Attractiveness Analysis by Route of Administration
  • Figure 70: East Asia Market Value Share and BPS Analysis by Sales Channel, 2025 and 2035
  • Figure 71: East Asia Market Y-o-Y Growth Comparison by Sales Channel, 2025 to 2035
  • Figure 72: East Asia Market Attractiveness Analysis by Sales Channel
  • Figure 73: South Asia & Pacific Market Value Share and BPS Analysis by Country, 2025 and 2035
  • Figure 74: South Asia & Pacific Market Value Share and BPS Analysis by Drug Class, 2025 and 2035
  • Figure 75: South Asia & Pacific Market Y-o-Y Growth Comparison by Drug Class, 2025 to 2035
  • Figure 76: South Asia & Pacific Market Attractiveness Analysis by Drug Class
  • Figure 77: South Asia & Pacific Market Value Share and BPS Analysis by Route of Administration, 2025 and 2035
  • Figure 78: South Asia & Pacific Market Y-o-Y Growth Comparison by Route of Administration, 2025 to 2035
  • Figure 79: South Asia & Pacific Market Attractiveness Analysis by Route of Administration
  • Figure 80: South Asia & Pacific Market Value Share and BPS Analysis by Sales Channel, 2025 and 2035
  • Figure 81: South Asia & Pacific Market Y-o-Y Growth Comparison by Sales Channel, 2025 to 2035
  • Figure 82: South Asia & Pacific Market Attractiveness Analysis by Sales Channel
  • Figure 83: Middle East and Africa Market Value Share and BPS Analysis by Country, 2025 and 2035
  • Figure 84: Middle East and Africa Market Value Share and BPS Analysis by Drug Class, 2025 and 2035
  • Figure 85: Middle East and Africa Market Y-o-Y Growth Comparison by Drug Class, 2025 to 2035
  • Figure 86: Middle East and Africa Market Attractiveness Analysis by Drug Class
  • Figure 87: Middle East and Africa Market Value Share and BPS Analysis by Route of Administration, 2025 and 2035
  • Figure 88: Middle East and Africa Market Y-o-Y Growth Comparison by Route of Administration, 2025 to 2035
  • Figure 89: Middle East and Africa Market Attractiveness Analysis by Route of Administration
  • Figure 90: Middle East and Africa Market Value Share and BPS Analysis by Sales Channel, 2025 and 2035
  • Figure 91: Middle East and Africa Market Y-o-Y Growth Comparison by Sales Channel, 2025 to 2035
  • Figure 92: Middle East and Africa Market Attractiveness Analysis by Sales Channel
  • Figure 93: Global Market - Tier Structure Analysis
  • Figure 94: Global Market - Company Share Analysis

Frequently Asked Questions

What is the projected size of the vascular parkinsonism industry by 2035?

It is expected to reach USD 538.1 million by 2035.

What is the estimated size of the vascular parkinsonism industry in 2025?

The industry is projected to be USD 319.5 million in 2025.

What is the CAGR of the vascular parkinsonism industry from 2025 to 2035?

The industry is expected to grow at a robust CAGR of 6.20%.

Which route of administration is expected to dominate the vascular parkinsonism industry in 2025?

Oral administration is projected to dominate with an 81.4% share.

Which country is expected to be the fastest-growing in the vascular parkinsonism industry?

India is expected to be the fastest-growing country with an 8.4% growth rate.

Explore Similar Insights

Future Market Insights

Vascular Parkinsonism Market