The Vascular Patches market is witnessing significant growth driven by the increasing prevalence of cardiovascular diseases and the rising demand for minimally invasive surgical interventions. The future outlook for this market is shaped by advancements in biomaterials, which enhance the safety, compatibility, and efficacy of vascular patch procedures. Growing awareness among healthcare providers and patients about postoperative outcomes and long-term vascular health has further strengthened market adoption.
Hospitals and surgical centers are increasingly focusing on improving patient recovery times and reducing complications, which has created a demand for superior vascular patch materials and designs. The expansion of healthcare infrastructure, coupled with rising investments in cardiovascular surgery technologies, is contributing to the market’s growth. Additionally, increasing geriatric populations and the corresponding rise in cardiovascular disorders are expected to sustain demand for vascular patches globally.
The market benefits from ongoing research and development in biologic materials, which offer improved integration with native tissues and reduce the risk of immune rejection These factors collectively support a positive growth trajectory for the Vascular Patches market.
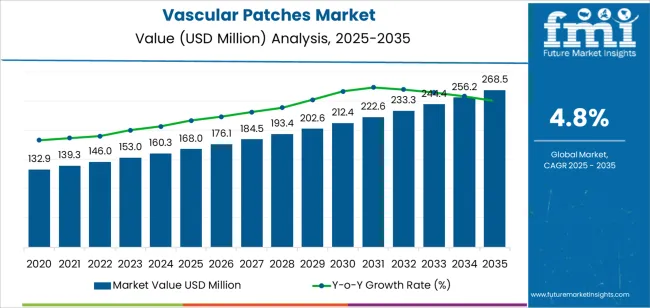
| Metric | Value |
|---|---|
| Vascular Patches Market Estimated Value in (2025 E) | USD 168.0 million |
| Vascular Patches Market Forecast Value in (2035 F) | USD 268.5 million |
| Forecast CAGR (2025 to 2035) | 4.8% |
The market is segmented by Material, Application, and End-User and region. By Material, the market is divided into Biologic and Synthetic. In terms of Application, the market is classified into Carotid Endarterectomy, Open Repair Of Abdominal Aneurysm, Vascular Bypass Surgery, Peripheral Vascular Reconstruction, and Others. Based on End-User, the market is segmented into Hospitals, Trauma Care Centres, and Academic & Research Institutes. Regionally, the market is classified into North America, Latin America, Western Europe, Eastern Europe, Balkan & Baltic Countries, Russia & Belarus, Central Asia, East Asia, South Asia & Pacific, and the Middle East & Africa.
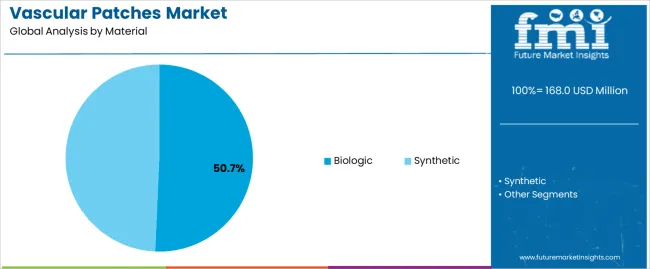
The biologic material segment is projected to hold 50.70% of the Vascular Patches market revenue share in 2025, making it the leading material type. This dominance is attributed to the superior biocompatibility and reduced risk of infection offered by biologic patches compared to synthetic alternatives. Biologic materials provide enhanced healing outcomes, integrating effectively with native vascular tissues, which has strengthened their preference among surgeons.
The growing focus on minimally invasive procedures and postoperative recovery has further reinforced the adoption of biologic patches. Additionally, the availability of advanced processing techniques that maintain material integrity and improve durability has contributed to segment growth.
The increasing use of biologic patches in high-risk patient populations and complex cardiovascular surgeries has further driven their prominence Continuous innovation and clinical validation supporting biologic materials have positioned this segment as a key driver of market expansion.
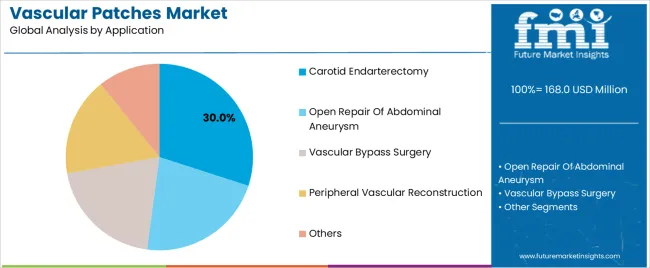
The carotid endarterectomy application segment is expected to capture 30.00% of the Vascular Patches market revenue share in 2025, establishing it as the leading application. The growth of this segment is driven by the increasing prevalence of carotid artery stenosis and related cerebrovascular disorders. Vascular patches are commonly employed to reduce the risk of postoperative complications such as restenosis and thrombosis, which has elevated their demand in carotid procedures.
Advancements in surgical techniques and improved patch materials have enhanced procedural safety and patient outcomes, supporting segment adoption. The rising number of cardiovascular surgeries performed in hospitals and specialized clinics has also contributed to the segment’s growth.
Additionally, increased awareness among clinicians regarding the benefits of vascular patching in improving long-term arterial patency has reinforced the segment’s leading position The integration of biologic and advanced synthetic materials further supports growth by optimizing surgical outcomes and patient safety.
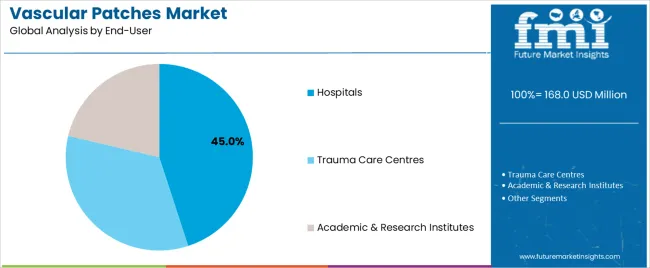
The hospitals end-user segment is anticipated to account for 45.00% of the Vascular Patches market revenue in 2025, making it the leading end-use industry. The substantial share is driven by the high volume of cardiovascular surgeries performed in hospital settings, where access to specialized surgical teams and advanced infrastructure is available. Hospitals prioritize patient safety, postoperative recovery, and long-term outcomes, which has encouraged the adoption of biologic and advanced vascular patches.
The integration of vascular patch procedures into standard surgical protocols has further reinforced market penetration. Growing investments in hospital infrastructure, coupled with increasing healthcare expenditure and the rising prevalence of cardiovascular diseases, have propelled demand for vascular patches.
Additionally, hospitals benefit from centralized procurement and streamlined supply chains, making them primary drivers of market revenue The ability to provide high-quality surgical outcomes, combined with the increasing number of surgical procedures, ensures continued dominance of hospitals in the end-user segment.
The above table presents the expected CAGR for the global vascular patches market over several semi-annual periods spanning from 2025 to 2035. In the first half (H1) of the decade from 2025 to 2035, the business is predicted to surge at a CAGR of 5.6%, followed by a slightly higher growth rate of 5.1% in the second half (H2) of the same decade.
| Particular | Value CAGR |
|---|---|
| H1 | 5.6% (2025 to 2035) |
| H2 | 5.1% (2025 to 2035) |
| H1 | 4.8% (2025 to 2035) |
| H2 | 4.5% (2025 to 2035) |
Moving into the subsequent period, from H1 2025 to H2 2035, the CAGR is projected to decrease slightly to 4.8% in the first half and increase moderately at 4.5% in the second half. In the first half (H1) the market witnessed a decrease of 80 BPS while in the second half (H2), the market witnessed a decrease of 62 BPS.
Unleashing Growth: The Vascular Patches Market is growing amidst Surging Vascular Diseases
Rise in Vascular diseases is the primary factor contributing to the expansion of the market. With aging population, there is a rise in conditions such as atherosclerosis and peripheral artery diseases. Addressing these conditions often necessitates the use of vascular patches.
For Instance in the USA approximately 8.5 million people are affected by peripheral artery disease, of which nearly 12 to 20% represent people 60 years and older.
Some of the key factors that contribute to this in the USA are smoking, hypertension, and other similar lifestyle disorders that is common among the older population in USA Similarly, in the UK over 100,000 hospital admissions are recorded every year that are associated with atherosclerosis.
This advancement in minimally invasive techniques has really upped the success rate of vascular surgeries, and thereby increases the demand for quality vascular patches. There is very strong R&D going on in devising novel materials and technologies for vascular patches, which will raise biocompatibility and reduce the risks of infection and rejection.
Incidence of heart diseases and other disorders of the cardio system is rising, so goes the frequency of cardio surgeries, and in proportion, the vascular patch market will be in demand now and in the future. With the rise of vascular diseases worldwide, the demand for surgical interventions also increases. Vascular patches play a vital role of restoring normal blood flow making them a key product to consider in such procedures.
Harnessing the Potential of Minimally Invasive Techniques is Creating Opportunities for Vascular Patches Industry
Minimally invasive procedures such as endovascular surgeries have significant benefits over the traditional open surgeries. For an instance these procedures provide advantages like small incision, less pain, short hospital stay and faster recovery time. These advantages contribute to enhanced patient satisfaction.
Procedures such as angioplasty and stenting require advanced vascular patches to minimize tissue damage. With the rising demand for minimally invasive procedures the vascular patches market is evolving to meet the new needs and demands. The industry is evolving through innovations in this space.
Innovations such as catheter-based delivery systems, advancements in imaging technology, and enhancements in medical devices are the key factors that are driving this evolution. Some of the key changes or technology updates seen in this space include bioresorbable material-based vascular patches and drug-eluting patches.
The past decade has seen a surge in endovascular surgeries in the USA that has increased by 50%. This type of trend towards minimally invasive surgeries not confined only to the USA Europe is also experiencing the rise in uptake of minimally invasive surgeries that is supported by updated healthcare policies that focus on cost reduction and betterment of patient care.
In essence, this shift towards minimally invasive procedures is only beginning and yet to reach its peak. As healthcare systems worldwide prioritize cost-effective, patient-friendly treatment options, the demand for innovative vascular patches that support these techniques will continue to surge, driving further growth in the industry.
Regulatory Hurdles is a Barrier for New Entrants in the Vascular Patches Industry
Entering the vascular patches market isn't without its challenges, especially for newcomers. Regulations imposed by the USA FDA and European Medicines Agency (EMA) are stringent and pose significant hurdles in the approval process. This costs the manufactures significant time.
While regulations by these bodies are meant for patient safety, they also entail substantial cost and time for manufacturers to navigate. This protracted approval process not only impacts market competition but also stifles innovation and product development.
Small businesses are the ones that are the most affected but these stringent regulations as they face barriers due to limited financial resources. Clinical trials are the most time and cost consuming steps for these small players. Furthermore, variations in regulations across different regions added to the complexity of gaining market entry for new entrants and product development.
This means heavy investments in research and development, and complex regulatory pathways to entry for new entrants. Even the clinical trials can be very expensive in terms of the procedures involved in patient recruitment, monitoring, and the analysis of data, thereby making this out of reach for smaller companies with limited funding.
The approval process itself can take a very long time and is relatively uncertain. These agencies may require several rounds of submission and query responses that take up to years, thus delaying the launch of products. Such uncertainties in regulatory approval create a problem for financial planning in a company, market strategy, and also make investment and partnership difficult to secure.
The global vascular patches industry recorded a CAGR of 3.2% during the historical period between 2020 and 2025. The growth of vascular patches industry was positive as it reached a value of USD 168.0 million in 2025 from USD 132.9 billion in 2020.
Advanced bioengineering solutions opens new opportunities in the vascular patches industry. There is a rising demand for more effective and biocompatible options, this is the primary driver for most manufacturers to push boundaries of innovation and develop patches that integrate seamlessly and support better healing.
Bioresorbable vascular patches dissolve slowly inside the human body, drastically reducing the potential risk of further surgeries and shortening, to a colossally great extent, the recovery time of patients.
Bioresorbable vascular patches are just the beginning. The development of drug-eluting patches, designed to deliver specific drugs like anti-inflammatory agents, represents a new and exciting innovation in the vascular patch industry. Further, 3D bioprinting technology gives options for customization that best suits personalized medicine to meet the unique needs of the individual patient.
Tier 1 companies comprise market leaders with a market revenue of above USD 100 million capturing significant market share of 64.6% in global market. These market leaders are characterized by high production capacity and a wide product portfolio. These market leaders are distinguished by their extensive expertise in manufacturing and reconditioning across multiple packaging formats and a broad geographical reach, underpinned by a robust consumer base.
They provide a wide range of series including reconditioning, recycling, and manufacturing utilizing the latest technology and meeting the regulatory standards providing the highest quality. Prominent companies within tier 1 include Getinge AB (Maquet), LeMaitre Vascular, Inc., and B. Braun Melsungen AG.
Tier 2 companies include mid-size players with revenue of USD 50 to 100 million having presence in specific regions and highly influencing the local market and holds around 31.7% market share. These are characterized by a strong presence overseas and strong market knowledge.
These market players have good technology and ensure regulatory compliance but may not have advanced technology and wide global reach. Prominent companies in tier 2 include Edwards Lifesciences, Baxter International, Terumo Corporation, and CryoLife among others.
Finally, Tier 3 companies, such as Braile Biomedica, Labcor Laboratórios, and W. L. Gore & Associates, while smaller, are essential for the market.
The section below covers the industry analysis for the vascular patches market for different countries. Market demand analysis on key countries in several regions of the globe, including North America, Asia Pacific, Europe, and others, is provided. The United States is anticipated to remain at the forefront in North America, with a value share of 91.7% through 2035. In Asia Pacific, South Korea is projected to witness a CAGR of 5.8% by 2035.
| Countries | Value CAGR (2025 to 2035) |
|---|---|
| Canada | 5.5% |
| Argentina | 2.4% |
| France | 5.0% |
| Russia | 3.8% |
| Indonesia | 2.3% |
| South Korea | 5.8% |
| GCC Countries | 6.4% |
USA Vascular Patches market is poised to exhibit a CAGR of 6.6% between 2025 and 2035, reaching over USD 268.5 million by 2035. Currently, it holds the highest share in the North American market, and the trend is expected to continue during the forecast period.
Rise in number of older population, evolving lifestyle changes that negatively impact dietary choices, promote sedentary habits, and smoking contribute to the rise in vascular disease. For an instance in the USA alone, the American Heart Association reports that approximately 8.5 million people are affected by PAD.
Furthermore, comprehensive insurance coverage in the USA extends to a wide array of medical procedures that also include vascular surgeries. This allows easy access to advanced treatments that surges the number of surgeries and use of advanced products such as carotid endarterectomy, vascular bypass surgery, and peripheral vascular reconstruction, all of which rely heavily on the utilization of vascular patches to ensure successful outcomes.
East Asia, spearheaded by China currently holds around 44.0% share of the East Asia vascular Patches industry. East Asia’s market is anticipated to grow at a CAGR of 8.1% throughout the forecast period, amounting to a valuation of USD 40.5 Million by 2035.
Rapid urbanization is causing a shift in lifestyle across China. This is leading to significant health challenges including significant rise in conditions like diabetes and hypertension.
These conditions further increase the risk of vascular diseases. Rise in vascular diseases is the primary factor for driving the demand for vascular surgeries and there by vascular patches. Concurrently, advancements in healthcare further improve access to advance medical treatments to a large chunk of the population in China.
Disappearing middle class in China indicates that there is a rise in disposable income. These individuals are seeking enhanced healthcare services, and sophisticated medical procedures that include use of vascular patches.
Furthermore, the government in China is actively working towards initiatives that enhance healthcare services and reduce impact of chronic diseases. One of the key initiatives is investment in medical research that promotes innovation in the medical arena. Rapidly growing cities, changing lifestyles has led to increasing number of people having increased risk of cardiovascular diseases.
This has created a greater need for vascular patches used in surgeries to address these issues. Alongside this, improvements in healthcare infrastructure mean more people in China can access advanced medical treatments.
Germany is expected to have a strong foothold when it comes to technology innovation. In 2025 the country is projected to account for almost 22.7% of the European Vascular Patches Market.
Germany is known to develop some of the world’s most cutting-edge medical technologies and has a very robust healthcare infrastructure. Leveraging state-of-the-art medical devices and highly skilled vascular surgery professionals, patients benefit from top-tier care. Well-equipped hospitals and clinics, with advanced medical technologies ensures seamless access to key medical devices like advanced vascular patches for the patients in need in the country.
Moreover, the regulatory framework and quality standards in Germany provide an excellent base for producing top-notch medical devices. In view of the rather strict procedure involved in certification processes, and particularly attaining international standards, it is ensured that German-made vascular patches are of unsurpassed quality both in respect of safety and efficacy.
These were some of the major factors that boosted the demand for German vascular patches first at home, then abroad. Such trust in Germany's products instills confidence in healthcare providers the world over, which has been one of the triggers toward global market expansion.
The section contains information about the leading segments in the industry. By material, the biologic patches segment is estimated to grow at a CAGR of 4.9% throughout 2035. Additionally, the synthetic patches industry is projected to expand at 6.8% till 2035.
| Material | Biologic |
|---|---|
| Value Share (2025) | 50.7% |
In 2025, the biologic patches segment emerges as the revenue leader, commanding nearly 51% of the market share. Although the adoption rates for both biologic and synthetic patches are currently similar, biologic patches are anticipated to gain traction over the forecast period, ultimately claiming dominance in the market.
The most common activity in this market is the continuous development of biologic patches. With advancements in material research, it has become possible to develop patches that more and more closely replicate the properties of natural tissue and thus support faster and better healing.
This significantly minimizes the number of repeat surgeries and the resultant rate of complications that come along with them. This factor has thus come to make the biologic patches more attractive for use in vascular interventions among patients.
Biologic patches provide patients with the advantage of better outcomes and less adverse reactions because they are very much compatible with natural tissue. The trends in biologic materials and techniques have been further accelerated for adoption in clinical practice and are probably one of the preferred choices for vascular surgeries.
Therefore, it will assume prime of place in the market in the long run through a combination of advantages such as biocompatibility, natural integration, reduced need for additional surgeries, and decreased risk of complications associated with biologic vascular patches.
| End Use | Hospitals |
|---|---|
| Value Share (2035) | 45.0% |
The hospitals segment is forecast to account for a revenue of over USD 268.5 million in the Vascular Patches market by 2035 end. It is also poised to expand at a CAGR of 7.0% across the forecast period.
Since most of the vascular surgeries are conducted in hospital based settings, the adoption of vascular patches in hospitals is the highest making it the dominant segment among all end users. Hospitals handle a significant volume of both emergency and schedules surgeries because this segment is supported with cutting edge technologies, good number of specialized personnel that can ensure the best care for patients.
Additionally, hospitals are known to be a part of a large number of clinical trials and research based studies that results in higher uptake of advanced medical devices including vascular patches. Healthcare services, spanning from diagnostics to treatment and postoperative care, solidify hospitals as the largest consumers of vascular patches in the market.
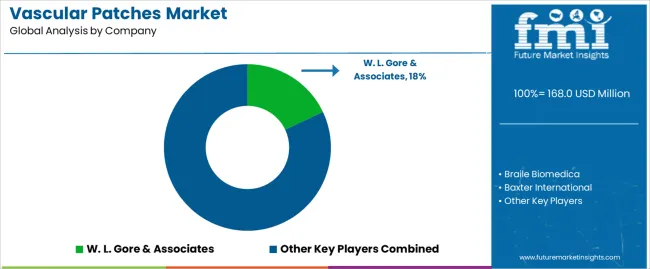
Substantial investments are seen in the vascular patches industry towards research and development in order to drive innovations such as bioresorbable, drug eluting patches and research for enhancing biocompatibility. Another key strategic focus of these companies is to actively look for strategic partners to bolster their product portfolios and expand their global market presence.
Recent Industry Developments in Vascular Patches Market
In terms of material, the industry is divided into biologic, and synthetic.
In terms of application, the industry is segregated into Carotid Endarterectomy, Open Repair of Abdominal Aneurysm, Vascular Bypass Surgery, Peripheral vascular reconstruction, and others.
The industry is classified by end user as hospitals, trauma care centres and academic & research institutes.
Key countries of North America, Latin America, East Asia, South Asia & Pacific, Western Europe, Eastern Europe and Middle East & Africa have been covered in the report.
The global vascular patches market is estimated to be valued at USD 168.0 million in 2025.
The market size for the vascular patches market is projected to reach USD 268.5 million by 2035.
The vascular patches market is expected to grow at a 4.8% CAGR between 2025 and 2035.
The key product types in vascular patches market are biologic and synthetic.
In terms of application, carotid endarterectomy segment to command 30.0% share in the vascular patches market in 2025.


Our Research Products

The "Full Research Suite" delivers actionable market intel, deep dives on markets or technologies, so clients act faster, cut risk, and unlock growth.

The Leaderboard benchmarks and ranks top vendors, classifying them as Established Leaders, Leading Challengers, or Disruptors & Challengers.

Locates where complements amplify value and substitutes erode it, forecasting net impact by horizon

We deliver granular, decision-grade intel: market sizing, 5-year forecasts, pricing, adoption, usage, revenue, and operational KPIs—plus competitor tracking, regulation, and value chains—across 60 countries broadly.

Spot the shifts before they hit your P&L. We track inflection points, adoption curves, pricing moves, and ecosystem plays to show where demand is heading, why it is changing, and what to do next across high-growth markets and disruptive tech

Real-time reads of user behavior. We track shifting priorities, perceptions of today’s and next-gen services, and provider experience, then pace how fast tech moves from trial to adoption, blending buyer, consumer, and channel inputs with social signals (#WhySwitch, #UX).

Partner with our analyst team to build a custom report designed around your business priorities. From analysing market trends to assessing competitors or crafting bespoke datasets, we tailor insights to your needs.
Supplier Intelligence
Discovery & Profiling
Capacity & Footprint
Performance & Risk
Compliance & Governance
Commercial Readiness
Who Supplies Whom
Scorecards & Shortlists
Playbooks & Docs
Category Intelligence
Definition & Scope
Demand & Use Cases
Cost Drivers
Market Structure
Supply Chain Map
Trade & Policy
Operating Norms
Deliverables
Buyer Intelligence
Account Basics
Spend & Scope
Procurement Model
Vendor Requirements
Terms & Policies
Entry Strategy
Pain Points & Triggers
Outputs
Pricing Analysis
Benchmarks
Trends
Should-Cost
Indexation
Landed Cost
Commercial Terms
Deliverables
Brand Analysis
Positioning & Value Prop
Share & Presence
Customer Evidence
Go-to-Market
Digital & Reputation
Compliance & Trust
KPIs & Gaps
Outputs
Full Research Suite comprises of:
Market outlook & trends analysis
Interviews & case studies
Strategic recommendations
Vendor profiles & capabilities analysis
5-year forecasts
8 regions and 60+ country-level data splits
Market segment data splits
12 months of continuous data updates
DELIVERED AS:
PDF EXCEL ONLINE
Vascular Sheath Group Market Size and Share Forecast Outlook 2025 to 2035
Vascular Access System Market Size and Share Forecast Outlook 2025 to 2035
Vascular Parkinsonism Market Analysis - Size, Share, and Forecast Outlook 2025 to 2035
Vascular Boot Market Trends and Forecast 2025 to 2035
The Vascular Ulcer Treatment Market Is Segmented by Ulcer Type, Treatment and Distribution Channel from 2025 To 2035
Vascular Dementia Treatment Market Analysis by Drug Class, Route of Administration, Distribution Channel, and Region through 2035
Vascular Imaging Systems Market Growth - Trends & Forecast 2025 to 2035
Vascular Closure Devices Analysis by Product Type by Product, By Age Group and by Distribution Channel through 2035
Vascular Access Catheters Market - Growth & Forecast 2025 to 2035
Vascular Endothelial Growth Factor Inhibitor Market
Vascular Dressings Market
Vascular prostheses market
Vascular Screening Market
Vascular Testing Devices Market
Neovascular AMD Treatment Market Growth, Analysis & Forecast by Drug Type, Disease Type, Age Group, Gender, Stage of Disease, Distribution Channel and Region through 2035
Nonvascular Interventional Radiology Device Market Trends – Growth & Forecast 2024-2034
PET Vascular Prosthesis Market Size and Share Forecast Outlook 2025 to 2035
Endovascular Aneurysm Repair (EVAR) Market Size and Share Forecast Outlook 2025 to 2035
Endovascular Therapy Devices Market Size and Share Forecast Outlook 2025 to 2035
Non-Vascular Stents Market Growth - Trends & Forecast 2025 to 2035

Thank you!
You will receive an email from our Business Development Manager. Please be sure to check your SPAM/JUNK folder too.
Chat With
MaRIA