Vascular Sheath Group Market Forecast and Outlook (2025-2035)

The global vascular sheath group market is projected to grow from USD 1 billion in 2025 to USD 2.6 billion by 2035, reflecting expanding demand for devices that support safe and reliable vascular access in interventional procedures. Key market dynamics are being shaped by the rising prevalence of cardiovascular disease and the increasing shift toward minimally invasive diagnostic and therapeutic interventions. Hospitals and catheterization labs are performing a higher volume of angioplasty, electrophysiology, structural heart, and peripheral vascular procedures, which require vascular sheaths for controlled catheter entry and hemostasis management. As procedural complexity increases, clinicians are prioritizing sheaths that provide stable access while minimizing arterial trauma, bleeding risk, and post-procedure complications.

Technology enhancements are further influencing adoption. Hydrophilic coatings, kink-resistant shaft materials, tapered tips, and improved hemostatic valve mechanisms are enabling smoother vessel entry and better catheter manipulation. Devices designed for radial access are gaining momentum due to reduced patient recovery time and lower complication rates compared to femoral access. Healthcare system expansion in emerging markets is broadening procurement of vascular access devices, supported by increased training of interventional cardiologists and vascular surgeons. The growing focus on procedural efficiency, patient safety, and shorter recovery timelines continues to drive demand for vascular sheaths that are highly reliable and deliver consistent clinical performance.
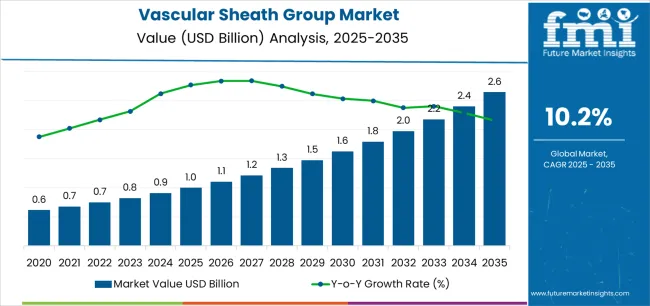
Quick Stats for Vascular Sheath Group Market

  • Vascular Sheath Group Market Value (2025): USD 1 billion
  • Vascular Sheath Group Market Forecast Value (2035): USD 2.6 billion
  • Vascular Sheath Group Market CAGR: 10.2%
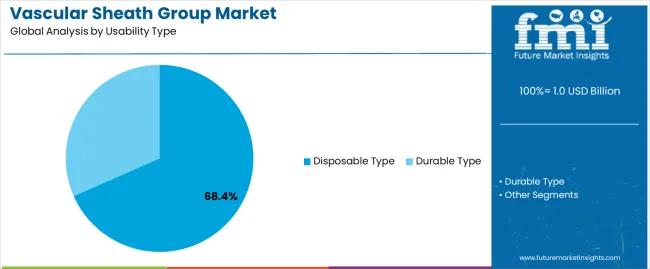
  • Leading Segment by Usability Type (2025): Disposable Type (68.4%)
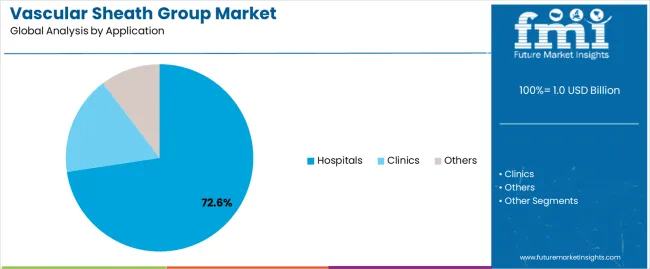
  • Leading Segment by Application (2025): Hospitals (72.6%)
  • Key Growth Regions: North America, Europe, and Asia Pacific
  • Top Companies by Market Share: Abbott, BD, B Braun

Vascular Sheath Group Market Market Value Analysis

Regional variations in healthcare spending and procedural volumes significantly influence market development patterns. North American and European markets maintain leadership through established interventional cardiology programs and comprehensive reimbursement frameworks supporting advanced vascular procedures. Asian markets demonstrate accelerating growth driven by healthcare modernization initiatives and expanding middle-class populations seeking quality cardiovascular care. The shift toward outpatient catheterization procedures and same-day discharge protocols is creating demand for vascular sheaths optimized for rapid hemostasis and reduced recovery times.

Manufacturing consolidation continues among major medical device companies pursuing economies of scale and regulatory compliance efficiencies. Supply chain integration between raw material suppliers, device manufacturers, and healthcare distributors is improving product availability and pricing stability. Quality standards enforcement by regulatory authorities in major markets creates barriers for smaller manufacturers while ensuring consistent device performance and patient safety outcomes.

Vascular Sheath Group Market Key Takeaways

Metric Value
Market Value (2025) USD 1 billion
Market Forecast Value (2035) USD 2.6 billion
Forecast CAGR (2025-2035) 10.2%

Why is the Vascular Sheath Group Market Growing?

HEALTHCARE INFRASTRUCTURE TRENDS PROCEDURAL REQUIREMENTS REGULATORY & QUALITY STANDARDS
  • Cardiovascular Disease Prevalence Growth: Continuous expansion of cardiovascular disease burden across established and emerging markets driving demand for vascular access solutions.
  • Aging Population Demographics: Growing elderly populations requiring interventional cardiology procedures and diagnostic catheterization creating demand for reliable vascular access devices.
  • Minimally Invasive Procedure Adoption: Increasing preference for minimally invasive cardiovascular interventions requiring sophisticated vascular access systems supporting procedural efficiency and patient safety.
  • Advanced Catheterization Techniques: Modern interventional cardiology requires precise vascular access devices delivering consistent performance and enhanced procedural control.
  • Hemostasis Management Demands: Healthcare facilities investing in premium vascular sheaths offering rapid hemostasis capabilities while maintaining procedural efficiency.
  • Quality and Reliability Standards: Certified manufacturers with proven track records required for advanced cardiovascular applications demanding consistent device performance.
  • Medical Device Safety Standards: Regulatory requirements establishing performance benchmarks favoring high-quality vascular access devices with documented safety profiles.
  • Biocompatibility Requirements: Quality standards requiring superior material properties and resistance to thrombogenic complications during catheterization procedures.
  • Sterilization Compliance Standards: Diverse regulatory requirements and quality standards driving need for sophisticated manufacturing capabilities and validated sterilization protocols.

How Is the Vascular Sheath Group Market Segmented by Usability Type, Application, and Region?

Category Segments Covered
By Usability Type Disposable Type, Durable Type
By Application Hospitals, Clinics, Others
By Region North America, Europe, Asia Pacific, Latin America, Middle East & Africa

Vascular Sheath Group Market Analysis by Usability Type

Vascular Sheath Group Market Analysis By Usability Type

Segment 2025 to 2035 Outlook
Disposable Type
  • Leader in 2025 with 68.4% market share, likely to maintain dominance through 2035. Single-use design eliminates cross-contamination risks, streamlines inventory management, and aligns with infection control protocols across healthcare facilities.
  • Momentum: strong growth driven by procedural volume expansion and hospital preference for disposable medical devices.
  • Watchouts: pricing pressure from healthcare cost containment initiatives, environmental concerns regarding medical waste generation.
Durable Type
  • Serves specialized applications where reprocessing capabilities justify higher initial costs. Limited adoption in 2025 due to sterilization complexity and regulatory scrutiny of reusable cardiovascular devices.
  • Momentum: stable in niche segments, declining share in mainstream interventional cardiology as disposable options improve cost-effectiveness.
  • Watchouts: stringent reprocessing validation requirements, liability concerns related to device reuse in critical cardiovascular applications.

Vascular Sheath Group Market Analysis by Application

Vascular Sheath Group Market Analysis By Application

Segment 2025 to 2035 Outlook
Hospitals
  • At 72.6%, largest application segment in 2025 with established interventional cardiology programs and comprehensive catheterization laboratory infrastructure. Hospitals maintain procurement relationships with major medical device manufacturers for consistent supply and technical support.
  • Momentum: steady growth driven by procedural volume increases and expansion of structural heart interventions requiring vascular access systems.
  • Watchouts: reimbursement pressures affecting device budgets, value-based care models emphasizing procedural outcomes over device costs.
Clinics
  • Growing segment serving outpatient diagnostic catheterization and peripheral vascular interventions. Ambulatory surgery centers and specialized cardiology clinics adopting vascular sheaths for same-day discharge procedures requiring rapid hemostasis capabilities.
  • Momentum: moderate growth through 2035 as healthcare delivery shifts toward outpatient settings for appropriate cardiovascular procedures.
  • Watchouts: regulatory requirements for procedural complexity in outpatient environments, limitations on reimbursement for clinic-based interventions.
Others
  • Includes emergency departments, mobile catheterization units, and research facilities. Small volume applications with specialized requirements for portable vascular access capabilities and rapid deployment scenarios.
  • Momentum: selective growth in emergency cardiac care and point-of-care diagnostic applications.
  • Watchouts: limited market size, fragmented procurement patterns complicating distribution strategies.

DRIVERS

DRIVERS RESTRAINTS KEY TRENDS
  • Cardiovascular Disease Burden Growth: Continuing expansion of cardiovascular disease prevalence across established and emerging markets driving demand for interventional procedures requiring vascular access devices.
  • Interventional Cardiology Advancement: Increasing adoption of percutaneous coronary interventions and structural heart procedures requiring sophisticated vascular access systems supporting complex catheter manipulations.
  • Aging Demographics: Growing elderly populations experiencing higher rates of atherosclerotic disease and requiring diagnostic catheterization and therapeutic interventions supported by reliable vascular sheaths.
  • Reimbursement Constraints: Healthcare cost containment initiatives affecting device procurement budgets and limiting adoption of premium vascular access systems in price-sensitive markets.
  • Radial Access Competition: Growing preference for transradial catheterization approaches reducing demand for femoral vascular sheaths in certain procedural contexts.
  • Regulatory Complexity: Varying medical device regulations across regional markets affecting product registrations and compliance costs for manufacturers.
  • Hemostatic Valve Technology: Integration of advanced hemostatic valve designs enabling multiple catheter exchanges while maintaining hemostasis and reducing blood loss during procedures.
  • Hydrophilic Coating Innovation: Development of sophisticated surface treatments reducing insertion trauma and improving patient comfort during vascular access procedures.
  • Smaller Profile Designs: Engineering progress enabling reduced sheath sizes supporting same-day discharge protocols and accelerated patient recovery timelines.
  • Kink-Resistant Materials: Integration of advanced polymer formulations and reinforcement technologies providing enhanced trackability and durability during complex catheter manipulations.

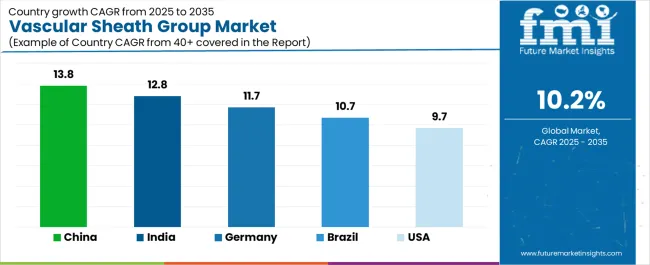
How Are Leading Countries Driving Growth in the Vascular Sheath Group Market?

Vascular Sheath Group Market Cagr Analysis By Country

Country CAGR (2025-2035)
China 13.8%
India 12.8%
Germany 11.7%
Brazil 10.7%
USA 9.7%

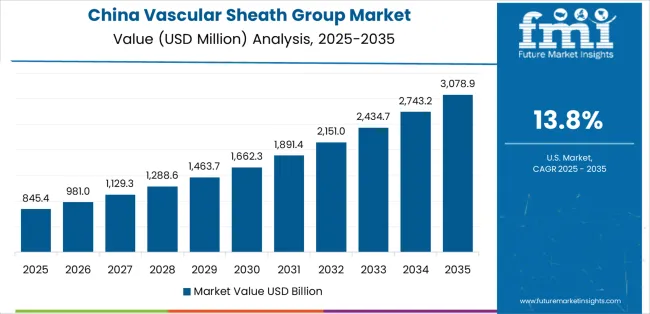
How Is Healthcare Infrastructure Expansion Accelerating Market Growth in China?

Vascular Sheath Group Market Country Value Analysis

Revenue from Vascular Sheath Group in China is projected to exhibit strong growth with a market value of USD 358.9 million by 2035, driven by expanding cardiovascular care infrastructure and comprehensive interventional cardiology program development creating substantial opportunities for medical device suppliers across hospital networks, specialty cardiac centers, and emerging ambulatory facilities. The country's healthcare modernization initiatives and expanding middle-class populations are creating significant demand for both conventional and advanced vascular access devices. Major healthcare systems and medical device distributors are establishing comprehensive local distribution networks to support large-scale hospital operations and meet growing demand for reliable cardiovascular device solutions.

  • Cardiovascular care infrastructure modernization programs are supporting widespread adoption of advanced vascular access systems across hospital operations, driving demand for high-quality medical devices meeting international performance standards
  • Interventional cardiology program expansion and specialized training development are creating substantial opportunities for device suppliers requiring reliable performance and cost-effective procurement solutions supporting procedural volume growth
  • Healthcare infrastructure investment and urban hospital development are facilitating adoption of premium vascular sheaths throughout major metropolitan regions serving expanding patient populations

Why Is Cardiovascular Care Modernization Strengthening Market Adoption in India?

Revenue from Vascular Sheath Group in India is expanding to reach USD 407.0 million by 2035, supported by extensive healthcare infrastructure development and comprehensive medical tourism sector growth creating sustained demand for reliable cardiovascular devices across diverse hospital categories and specialty cardiac facilities. The country's expanding healthcare access and growing awareness of cardiovascular disease management are driving demand for device solutions that provide consistent clinical performance while supporting cost-effective care delivery requirements. Medical device importers and domestic manufacturers are investing in local distribution capabilities to support growing hospital operations and cardiovascular procedure volumes.

  • Healthcare infrastructure expansion and cardiac care facility development are creating opportunities for vascular access devices across diverse hospital segments requiring reliable performance and competitive procurement pricing supporting procedural accessibility
  • Medical tourism growth and specialty hospital capability development are driving investments in international-standard medical devices supporting quality requirements throughout major urban healthcare centers
  • Government healthcare initiatives and insurance coverage expansion programs are enhancing demand for cardiovascular devices throughout secondary and tertiary care facilities across metropolitan and regional markets

How Does Advanced Clinical Infrastructure Support Market Leadership in Germany?

Demand for Vascular Sheath Group in Germany is projected to reach USD 1733.3 million by 2035, supported by the country's leadership in interventional cardiology and advanced cardiovascular technologies requiring sophisticated vascular access systems for complex structural heart interventions and peripheral vascular procedures. German hospitals are implementing high-quality device procurement systems that support advanced procedural techniques, operational efficiency, and comprehensive quality protocols. The market is characterized by focus on clinical outcomes, device innovation, and compliance with stringent medical device and patient safety standards.

  • Premium cardiovascular care investments are prioritizing advanced vascular access technologies that demonstrate superior clinical performance and safety while meeting German medical device regulations and quality standards
  • Interventional cardiology leadership programs and operational excellence initiatives are driving adoption of precision-engineered vascular sheaths that support advanced procedural systems and clinical optimization
  • Research and development programs for procedural innovation are facilitating adoption of specialized vascular access techniques throughout major university hospitals and cardiac centers

Why Is Healthcare Coverage Expansion Fueling Market Growth in Brazil?

Revenue from Vascular Sheath Group in Brazil is growing to reach USD 2785.2 million by 2035, driven by healthcare coverage expansion programs and increasing cardiovascular disease awareness creating sustained opportunities for device suppliers serving both public hospital networks and private healthcare operators. The country's developing cardiovascular care infrastructure and expanding health insurance penetration are creating demand for vascular access devices that support diverse clinical requirements while maintaining cost-effective performance standards. Medical device importers and local distributors are developing procurement strategies to support hospital operational efficiency and regulatory compliance requirements.

  • Healthcare coverage expansion and cardiovascular care access programs are facilitating adoption of vascular access devices capable of supporting diverse clinical requirements and cost-effective performance standards across public and private facilities
  • Medical device procurement modernization and hospital efficiency programs are enhancing demand for reliable vascular sheaths that support operational performance and clinical reliability throughout expanding hospital networks
  • Cardiovascular care market expansion and specialty hospital development are creating opportunities for advanced vascular access capabilities across Brazilian healthcare facilities serving growing patient populations

How Are Procedural Innovations Driving Market Evolution in United States?

Demand for Vascular Sheath Group in USA is projected to reach USD 251.6 million by 2035, expanding at a CAGR of 9.7%, driven by advanced procedural innovation and specialty device capabilities supporting structural heart interventions and complex peripheral vascular procedures. The country's established interventional cardiology leadership and sophisticated healthcare delivery systems are creating demand for premium vascular access devices that support procedural performance and clinical outcome standards. Device manufacturers and specialty distributors are maintaining comprehensive development capabilities to support diverse hospital requirements and evolving procedural techniques.
  • Advanced procedural innovation and specialty device programs are supporting demand for vascular access systems that meet contemporary clinical performance and reliability standards across leading cardiac centers
  • Structural heart intervention growth and peripheral vascular procedure expansion programs are creating opportunities for specialized vascular sheaths that provide comprehensive procedural support and enhanced clinical capabilities
  • Healthcare delivery optimization and clinical outcome enhancement programs are facilitating adoption of advanced vascular access technologies throughout major hospital systems and academic medical centers

How Is Hospital Network Expansion Supporting Market Penetration Across Europe?

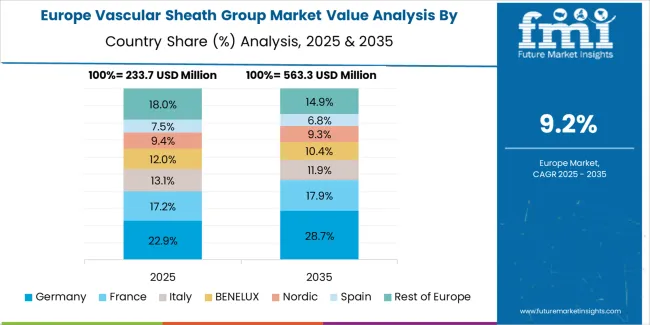
Vascular Sheath Group Market Europe Country Market Share Analysis, 2025 & 2035

The vascular sheath group market in Europe is projected to grow from USD 189.4 million in 2025 to USD 512.7 million by 2035, registering a CAGR of 10.5% over the forecast period. Germany is expected to maintain its leadership position with a 29.3% market share in 2025, declining slightly to 28.1% by 2035, supported by its advanced interventional cardiology infrastructure and major cardiovascular centers including Berlin Heart Center and German Heart Center Munich.

France follows with a 21.4% share in 2025, projected to reach 22.1% by 2035, driven by comprehensive cardiovascular care modernization programs at Paris cardiac hospitals and regional specialty centers. The United Kingdom holds a 18.7% share in 2025, expected to decrease to 17.9% by 2035 due to National Health Service budget constraints affecting device procurement. Italy commands a 16.2% share, while Spain accounts for 14.4% in 2025. The Rest of Europe region is anticipated to gain momentum, expanding its collective share from 10.8% to 11.6% by 2035, attributed to increasing vascular sheath adoption in Nordic countries and emerging Eastern European hospitals implementing cardiovascular program expansions.
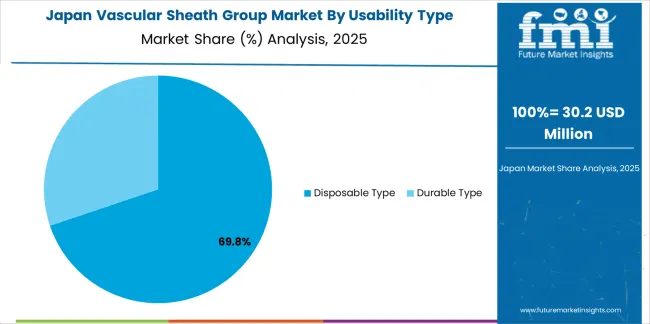
Premium Quality Standards Define Japanese Market Dynamics

Vascular Sheath Group Market Japan Market Share Analysis By Usability Type

Japanese Vascular Sheath Group operations reflect the country's exacting medical device standards and sophisticated clinical expectations. Major hospital systems including National Cerebral and Cardiovascular Center, Japanese Red Cross Medical Center, and University of Tokyo Hospital maintain rigorous supplier qualification processes that often exceed international standards, requiring extensive documentation, batch testing, and facility audits that can take 12-18 months to complete. This creates high barriers for new suppliers but ensures consistent quality that supports premium clinical positioning.

The Japanese market demonstrates unique application preferences, with significant demand for smaller profile vascular sheaths tailored to Asian patient anatomies and procedural techniques emphasizing radial access approaches. Hospitals require specific dimensional specifications and hemostatic valve performance characteristics that differ from Western applications, driving demand for customized device capabilities.

Regulatory oversight through the Pharmaceuticals and Medical Devices Agency emphasizes comprehensive biocompatibility assessment and traceability requirements that surpass most international standards. The medical device approval system requires detailed clinical data and performance documentation, creating advantages for suppliers with transparent manufacturing processes and comprehensive validation systems.

Supply chain management focuses on relationship-based partnerships rather than purely transactional procurement. Japanese hospitals typically maintain long-term supplier relationships spanning decades, with annual contract negotiations emphasizing device performance consistency over price competition. This stability supports investment in specialized manufacturing processes tailored to Japanese specifications.
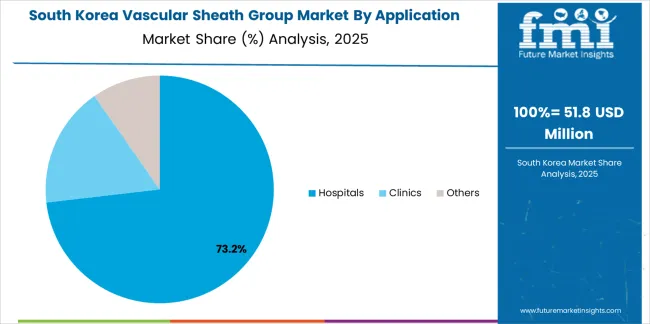
Market Dynamics Drive Innovation in South Korea

Vascular Sheath Group Market South Korea Market Share Analysis By Application

South Korean Vascular Sheath Group operations reflect the country's advanced healthcare sector and quality-focused procurement model. Major hospital systems including Seoul National University Hospital, Asan Medical Center, and Samsung Medical Center drive sophisticated device procurement strategies, establishing direct relationships with global manufacturers to secure consistent quality and pricing for their interventional cardiology programs serving both domestic and international patients.

The Korean market demonstrates particular strength in adopting advanced vascular access technologies, with hospitals integrating premium sheaths into comprehensive cardiovascular care pathways designed for optimal clinical outcomes. This clinical excellence approach creates demand for specific device specifications that support procedural efficiency and patient safety objectives, requiring suppliers to demonstrate validated performance capabilities.

Regulatory frameworks emphasize medical device safety and traceability, with Ministry of Food and Drug Safety standards often exceeding international requirements. This creates barriers for smaller device suppliers but benefits established manufacturers who can demonstrate compliance capabilities. The regulatory environment particularly favors suppliers with ISO certification and comprehensive quality management systems.

Supply chain efficiency remains critical given Korea's import dependence for advanced medical devices. Hospitals increasingly pursue long-term contracts with suppliers in USA, Europe, and Japan to ensure reliable access to vascular sheaths while managing foreign exchange risks. Cold chain logistics investments support device quality preservation during extended shipping periods.

The market faces pressure from government healthcare cost containment initiatives and competition from domestic device manufacturers, driving consolidation among smaller importers. The premium positioning of Korean cardiovascular care internationally continues to support demand for high-quality vascular access devices meeting stringent clinical specifications.
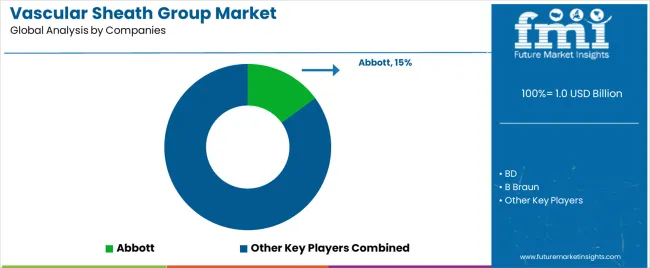
How Competitive Is the Global Vascular Sheath Group Market and What Defines Its Leadership Structure?

Vascular Sheath Group Market Analysis By Company

Profit pools are consolidating around manufacturers with regulatory compliance capabilities and established hospital relationships. Value is migrating from commodity vascular access devices to differentiated products offering hemostatic valve innovation, hydrophilic coating performance, and kink-resistant designs supporting complex procedures. Several archetypes set the pace: global medical device conglomerates leveraging distribution scale and product portfolios; specialized cardiovascular device companies with procedural expertise and clinical relationships; regional manufacturers serving price-sensitive markets with regulatory-compliant alternatives; and innovation-driven entrants targeting specific procedural niches with differentiated technologies.

Switching costs remain substantial through hospital formulary processes, clinical training requirements, and procedural preference card standardization, stabilizing market shares for incumbent suppliers while creating barriers for new entrants. Supply shocks from raw material availability, regulatory compliance changes, and manufacturing capacity constraints periodically disrupt procurement patterns. Clinical outcome data increasingly influences purchasing decisions as hospitals adopt value-based procurement models emphasizing procedural success rates and complication reduction.

Consolidation continues among mid-tier manufacturers unable to sustain regulatory compliance costs and distribution infrastructure requirements. Vertical integration remains limited given specialized manufacturing capabilities and capital intensity of medical device production. Digital procurement platforms gain traction for standardized device categories while complex vascular access products maintain traditional relationship-driven sales models. Hospital group purchasing organizations consolidate buying power, negotiating volume-based pricing that pressures manufacturer margins while ensuring supply reliability.

Lock long-term hospital contracts with comprehensive training and clinical support programs; establish multi-country regulatory approval portfolios; option to develop procedure-specific sheath variants addressing structural heart and peripheral vascular applications with documented clinical outcome improvements.

Stakeholder Type Primary Advantage Repeatable Plays
Global device conglomerates Distribution scale, product portfolio breadth, regulatory infrastructure Long-term hospital contracts, bundled pricing, clinical education programs
Specialized cardiovascular companies Procedural expertise, physician relationships, clinical data Procedural training, physician preferences, outcome studies
Regional manufacturers Cost competitiveness, local market knowledge, regulatory compliance Value-based pricing, domestic distribution, emerging market focus
Innovation-driven entrants Differentiated technology, niche procedural focus, clinical collaboration Procedural partnerships, targeted clinical studies, key opinion leader engagement

Who Are the Leading Companies Driving Innovation in the Vascular Sheath Group Market?

  • Abbott
  • BD
  • B Braun
  • Cordis US Corp
  • Edwards Lifesciences LLC
  • Fresenius Kabi AG
  • Argon Medical Devices, Inc.
  • Cook Incorporated
  • Terumo Corporation
  • Nanjing Mai Chuang Medical Technology
  • Beijing Dimac Medical Technology
  • Zhongke Juming (Changchun) Medical Devices
  • Shenzhen Weikang Medical Technology
  • Henan Junren Best Medical Devices
  • Suzhou Hengruidi Medical Technology
  • Tianjin Saima Technology
  • Jiangxi Xiwei Peptide Biotechnology
  • Shanghai Baiquantong Medical Technology
  • Hunan Puhui Shengkang Medical Technology

What Defines the Analytical Scope, Coverage, and Framework of the Vascular Sheath Group Market Report?

Items Values
Quantitative Units USD 1 billion
Product Disposable Type, Durable Type
Application Hospitals, Clinics, Others
Regions Covered North America, Latin America, Europe, Asia Pacific, Middle East & Africa
Country Covered USA, Germany, China, India, Brazil, and other 40+ countries
Key Companies Profiled Abbott, BD, B Braun, Cordis US Corp, Edwards Lifesciences LLC, Fresenius Kabi AG, Argon Medical Devices Inc., Cook Incorporated, Terumo Corporation, Nanjing Mai Chuang Medical Technology
Additional Attributes Dollar sales by usability type/application, regional demand (NA, EU, APAC), competitive landscape, hospital vs. clinic adoption, manufacturing innovation, and hemostatic valve technologies driving procedural efficiency, patient safety, and clinical outcomes

How Is the Vascular Sheath Group Market Structured Across Usability Type, Application, and Regional Segments?

Usability Type

  • Disposable Type
  • Durable Type

Application

  • Hospitals
  • Clinics
  • Others

By Region

  • North America
  • Europe
  • Asia Pacific
  • Latin America
  • Middle East & Africa

Frequently Asked Questions

How big is the vascular sheath group market in 2025?

The global vascular sheath group market is estimated to be valued at USD 1.0 billion in 2025.

What will be the size of vascular sheath group market in 2035?

The market size for the vascular sheath group market is projected to reach USD 2.6 billion by 2035.

How much will be the vascular sheath group market growth between 2025 and 2035?

The vascular sheath group market is expected to grow at a 10.2% CAGR between 2025 and 2035.

What are the key product types in the vascular sheath group market?

The key product types in vascular sheath group market are disposable type and durable type.

Which application segment to contribute significant share in the vascular sheath group market in 2025?

In terms of application, hospitals segment to command 72.6% share in the vascular sheath group market in 2025.

Table of Content

  1. Executive Summary
    • Global Market Outlook
    • Demand to side Trends
    • Supply to side Trends
    • Technology Roadmap Analysis
    • Analysis and Recommendations
  2. Market Overview
    • Market Coverage / Taxonomy
    • Market Definition / Scope / Limitations
  3. Market Background
    • Market Dynamics
      • Drivers
      • Restraints
      • Opportunity
      • Trends
    • Scenario Forecast
      • Demand in Optimistic Scenario
      • Demand in Likely Scenario
      • Demand in Conservative Scenario
    • Opportunity Map Analysis
    • Product Life Cycle Analysis
    • Supply Chain Analysis
    • Investment Feasibility Matrix
    • Value Chain Analysis
    • PESTLE and Porter’s Analysis
    • Regulatory Landscape
    • Regional Parent Market Outlook
    • Production and Consumption Statistics
    • Import and Export Statistics
  4. Global Market Analysis 2020 to 2024 and Forecast, 2025 to 2035
    • Historical Market Size Value (USD Million) Analysis, 2020 to 2024
    • Current and Future Market Size Value (USD Million) Projections, 2025 to 2035
      • Y to o to Y Growth Trend Analysis
      • Absolute $ Opportunity Analysis
  5. Global Market Pricing Analysis 2020 to 2024 and Forecast 2025 to 2035
  6. Global Market Analysis 2020 to 2024 and Forecast 2025 to 2035, By Usability Type
    • Introduction / Key Findings
    • Historical Market Size Value (USD Million) Analysis By Usability Type , 2020 to 2024
    • Current and Future Market Size Value (USD Million) Analysis and Forecast By Usability Type , 2025 to 2035
      • Disposable Type
      • Durable Type
    • Y to o to Y Growth Trend Analysis By Usability Type , 2020 to 2024
    • Absolute $ Opportunity Analysis By Usability Type , 2025 to 2035
  7. Global Market Analysis 2020 to 2024 and Forecast 2025 to 2035, By Application
    • Introduction / Key Findings
    • Historical Market Size Value (USD Million) Analysis By Application, 2020 to 2024
    • Current and Future Market Size Value (USD Million) Analysis and Forecast By Application, 2025 to 2035
      • Hospitals
      • Clinics
      • Others
    • Y to o to Y Growth Trend Analysis By Application, 2020 to 2024
    • Absolute $ Opportunity Analysis By Application, 2025 to 2035
  8. Global Market Analysis 2020 to 2024 and Forecast 2025 to 2035, By Region
    • Introduction
    • Historical Market Size Value (USD Million) Analysis By Region, 2020 to 2024
    • Current Market Size Value (USD Million) Analysis and Forecast By Region, 2025 to 2035
      • North America
      • Latin America
      • Western Europe
      • Eastern Europe
      • East Asia
      • South Asia and Pacific
      • Middle East & Africa
    • Market Attractiveness Analysis By Region
  9. North America Market Analysis 2020 to 2024 and Forecast 2025 to 2035, By Country
    • Historical Market Size Value (USD Million) Trend Analysis By Market Taxonomy, 2020 to 2024
    • Market Size Value (USD Million) Forecast By Market Taxonomy, 2025 to 2035
      • By Country
        • USA
        • Canada
        • Mexico
      • By Usability Type
      • By Application
    • Market Attractiveness Analysis
      • By Country
      • By Usability Type
      • By Application
    • Key Takeaways
  10. Latin America Market Analysis 2020 to 2024 and Forecast 2025 to 2035, By Country
    • Historical Market Size Value (USD Million) Trend Analysis By Market Taxonomy, 2020 to 2024
    • Market Size Value (USD Million) Forecast By Market Taxonomy, 2025 to 2035
      • By Country
        • Brazil
        • Chile
        • Rest of Latin America
      • By Usability Type
      • By Application
    • Market Attractiveness Analysis
      • By Country
      • By Usability Type
      • By Application
    • Key Takeaways
  11. Western Europe Market Analysis 2020 to 2024 and Forecast 2025 to 2035, By Country
    • Historical Market Size Value (USD Million) Trend Analysis By Market Taxonomy, 2020 to 2024
    • Market Size Value (USD Million) Forecast By Market Taxonomy, 2025 to 2035
      • By Country
        • Germany
        • UK
        • Italy
        • Spain
        • France
        • Nordic
        • BENELUX
        • Rest of Western Europe
      • By Usability Type
      • By Application
    • Market Attractiveness Analysis
      • By Country
      • By Usability Type
      • By Application
    • Key Takeaways
  12. Eastern Europe Market Analysis 2020 to 2024 and Forecast 2025 to 2035, By Country
    • Historical Market Size Value (USD Million) Trend Analysis By Market Taxonomy, 2020 to 2024
    • Market Size Value (USD Million) Forecast By Market Taxonomy, 2025 to 2035
      • By Country
        • Russia
        • Poland
        • Hungary
        • Balkan & Baltic
        • Rest of Eastern Europe
      • By Usability Type
      • By Application
    • Market Attractiveness Analysis
      • By Country
      • By Usability Type
      • By Application
    • Key Takeaways
  13. East Asia Market Analysis 2020 to 2024 and Forecast 2025 to 2035, By Country
    • Historical Market Size Value (USD Million) Trend Analysis By Market Taxonomy, 2020 to 2024
    • Market Size Value (USD Million) Forecast By Market Taxonomy, 2025 to 2035
      • By Country
        • China
        • Japan
        • South Korea
      • By Usability Type
      • By Application
    • Market Attractiveness Analysis
      • By Country
      • By Usability Type
      • By Application
    • Key Takeaways
  14. South Asia and Pacific Market Analysis 2020 to 2024 and Forecast 2025 to 2035, By Country
    • Historical Market Size Value (USD Million) Trend Analysis By Market Taxonomy, 2020 to 2024
    • Market Size Value (USD Million) Forecast By Market Taxonomy, 2025 to 2035
      • By Country
        • India
        • ASEAN
        • Australia & New Zealand
        • Rest of South Asia and Pacific
      • By Usability Type
      • By Application
    • Market Attractiveness Analysis
      • By Country
      • By Usability Type
      • By Application
    • Key Takeaways
  15. Middle East & Africa Market Analysis 2020 to 2024 and Forecast 2025 to 2035, By Country
    • Historical Market Size Value (USD Million) Trend Analysis By Market Taxonomy, 2020 to 2024
    • Market Size Value (USD Million) Forecast By Market Taxonomy, 2025 to 2035
      • By Country
        • Kingdom of Saudi Arabia
        • Other GCC Countries
        • Turkiye
        • South Africa
        • Other African Union
        • Rest of Middle East & Africa
      • By Usability Type
      • By Application
    • Market Attractiveness Analysis
      • By Country
      • By Usability Type
      • By Application
    • Key Takeaways
  16. Key Countries Market Analysis
    • USA
      • Pricing Analysis
      • Market Share Analysis, 2024
        • By Usability Type
        • By Application
    • Canada
      • Pricing Analysis
      • Market Share Analysis, 2024
        • By Usability Type
        • By Application
    • Mexico
      • Pricing Analysis
      • Market Share Analysis, 2024
        • By Usability Type
        • By Application
    • Brazil
      • Pricing Analysis
      • Market Share Analysis, 2024
        • By Usability Type
        • By Application
    • Chile
      • Pricing Analysis
      • Market Share Analysis, 2024
        • By Usability Type
        • By Application
    • Germany
      • Pricing Analysis
      • Market Share Analysis, 2024
        • By Usability Type
        • By Application
    • UK
      • Pricing Analysis
      • Market Share Analysis, 2024
        • By Usability Type
        • By Application
    • Italy
      • Pricing Analysis
      • Market Share Analysis, 2024
        • By Usability Type
        • By Application
    • Spain
      • Pricing Analysis
      • Market Share Analysis, 2024
        • By Usability Type
        • By Application
    • France
      • Pricing Analysis
      • Market Share Analysis, 2024
        • By Usability Type
        • By Application
    • India
      • Pricing Analysis
      • Market Share Analysis, 2024
        • By Usability Type
        • By Application
    • ASEAN
      • Pricing Analysis
      • Market Share Analysis, 2024
        • By Usability Type
        • By Application
    • Australia & New Zealand
      • Pricing Analysis
      • Market Share Analysis, 2024
        • By Usability Type
        • By Application
    • China
      • Pricing Analysis
      • Market Share Analysis, 2024
        • By Usability Type
        • By Application
    • Japan
      • Pricing Analysis
      • Market Share Analysis, 2024
        • By Usability Type
        • By Application
    • South Korea
      • Pricing Analysis
      • Market Share Analysis, 2024
        • By Usability Type
        • By Application
    • Russia
      • Pricing Analysis
      • Market Share Analysis, 2024
        • By Usability Type
        • By Application
    • Poland
      • Pricing Analysis
      • Market Share Analysis, 2024
        • By Usability Type
        • By Application
    • Hungary
      • Pricing Analysis
      • Market Share Analysis, 2024
        • By Usability Type
        • By Application
    • Kingdom of Saudi Arabia
      • Pricing Analysis
      • Market Share Analysis, 2024
        • By Usability Type
        • By Application
    • Turkiye
      • Pricing Analysis
      • Market Share Analysis, 2024
        • By Usability Type
        • By Application
    • South Africa
      • Pricing Analysis
      • Market Share Analysis, 2024
        • By Usability Type
        • By Application
  17. Market Structure Analysis
    • Competition Dashboard
    • Competition Benchmarking
    • Market Share Analysis of Top Players
      • By Regional
      • By Usability Type
      • By Application
  18. Competition Analysis
    • Competition Deep Dive
      • Abbott
        • Overview
        • Product Portfolio
        • Profitability by Market Segments (Product/Age /Sales Channel/Region)
        • Sales Footprint
        • Strategy Overview
          • Marketing Strategy
          • Product Strategy
          • Channel Strategy
      • BD
      • B Braun
      • Cordis US Corp
      • Edwards Lifesciences LLC
      • Fresenius Kabi AG
      • Argon Medical Devices, Inc.
      • Cook Incorporated
      • Terumo Corporation
      • Nanjing Mai Chuang Medical Technology
      • Beijing Dimac Medical Technology
      • Zhongke Juming (Changchun) Medical Devices
      • Shenzhen Weikang Medical Technology
      • Henan Junren Best Medical Devices
      • Suzhou Hengruidi Medical Technology
      • Tianjin Saima Technology
      • Jiangxi Xiwei Peptide Biotechnology
      • Shanghai Baiquantong Medical Technology
      • Hunan Puhui Shengkang Medical Technology
  19. Assumptions & Acronyms Used
  20. Research Methodology

List of Tables

  • Table 1: Global Market Value (USD Million) Forecast by Region, 2020 to 2035
  • Table 2: Global Market Value (USD Million) Forecast by Usability Type , 2020 to 2035
  • Table 3: Global Market Value (USD Million) Forecast by Application, 2020 to 2035
  • Table 4: North America Market Value (USD Million) Forecast by Country, 2020 to 2035
  • Table 5: North America Market Value (USD Million) Forecast by Usability Type , 2020 to 2035
  • Table 6: North America Market Value (USD Million) Forecast by Application, 2020 to 2035
  • Table 7: Latin America Market Value (USD Million) Forecast by Country, 2020 to 2035
  • Table 8: Latin America Market Value (USD Million) Forecast by Usability Type , 2020 to 2035
  • Table 9: Latin America Market Value (USD Million) Forecast by Application, 2020 to 2035
  • Table 10: Western Europe Market Value (USD Million) Forecast by Country, 2020 to 2035
  • Table 11: Western Europe Market Value (USD Million) Forecast by Usability Type , 2020 to 2035
  • Table 12: Western Europe Market Value (USD Million) Forecast by Application, 2020 to 2035
  • Table 13: Eastern Europe Market Value (USD Million) Forecast by Country, 2020 to 2035
  • Table 14: Eastern Europe Market Value (USD Million) Forecast by Usability Type , 2020 to 2035
  • Table 15: Eastern Europe Market Value (USD Million) Forecast by Application, 2020 to 2035
  • Table 16: East Asia Market Value (USD Million) Forecast by Country, 2020 to 2035
  • Table 17: East Asia Market Value (USD Million) Forecast by Usability Type , 2020 to 2035
  • Table 18: East Asia Market Value (USD Million) Forecast by Application, 2020 to 2035
  • Table 19: South Asia and Pacific Market Value (USD Million) Forecast by Country, 2020 to 2035
  • Table 20: South Asia and Pacific Market Value (USD Million) Forecast by Usability Type , 2020 to 2035
  • Table 21: South Asia and Pacific Market Value (USD Million) Forecast by Application, 2020 to 2035
  • Table 22: Middle East & Africa Market Value (USD Million) Forecast by Country, 2020 to 2035
  • Table 23: Middle East & Africa Market Value (USD Million) Forecast by Usability Type , 2020 to 2035
  • Table 24: Middle East & Africa Market Value (USD Million) Forecast by Application, 2020 to 2035

List of Figures

  • Figure 1: Global Market Pricing Analysis
  • Figure 2: Global Market Value (USD Million) Forecast 2020-2035
  • Figure 3: Global Market Value Share and BPS Analysis by Usability Type , 2025 and 2035
  • Figure 4: Global Market Y to o to Y Growth Comparison by Usability Type , 2025-2035
  • Figure 5: Global Market Attractiveness Analysis by Usability Type
  • Figure 6: Global Market Value Share and BPS Analysis by Application, 2025 and 2035
  • Figure 7: Global Market Y to o to Y Growth Comparison by Application, 2025-2035
  • Figure 8: Global Market Attractiveness Analysis by Application
  • Figure 9: Global Market Value (USD Million) Share and BPS Analysis by Region, 2025 and 2035
  • Figure 10: Global Market Y to o to Y Growth Comparison by Region, 2025-2035
  • Figure 11: Global Market Attractiveness Analysis by Region
  • Figure 12: North America Market Incremental Dollar Opportunity, 2025-2035
  • Figure 13: Latin America Market Incremental Dollar Opportunity, 2025-2035
  • Figure 14: Western Europe Market Incremental Dollar Opportunity, 2025-2035
  • Figure 15: Eastern Europe Market Incremental Dollar Opportunity, 2025-2035
  • Figure 16: East Asia Market Incremental Dollar Opportunity, 2025-2035
  • Figure 17: South Asia and Pacific Market Incremental Dollar Opportunity, 2025-2035
  • Figure 18: Middle East & Africa Market Incremental Dollar Opportunity, 2025-2035
  • Figure 19: North America Market Value Share and BPS Analysis by Country, 2025 and 2035
  • Figure 20: North America Market Value Share and BPS Analysis by Usability Type , 2025 and 2035
  • Figure 21: North America Market Y to o to Y Growth Comparison by Usability Type , 2025-2035
  • Figure 22: North America Market Attractiveness Analysis by Usability Type
  • Figure 23: North America Market Value Share and BPS Analysis by Application, 2025 and 2035
  • Figure 24: North America Market Y to o to Y Growth Comparison by Application, 2025-2035
  • Figure 25: North America Market Attractiveness Analysis by Application
  • Figure 26: Latin America Market Value Share and BPS Analysis by Country, 2025 and 2035
  • Figure 27: Latin America Market Value Share and BPS Analysis by Usability Type , 2025 and 2035
  • Figure 28: Latin America Market Y to o to Y Growth Comparison by Usability Type , 2025-2035
  • Figure 29: Latin America Market Attractiveness Analysis by Usability Type
  • Figure 30: Latin America Market Value Share and BPS Analysis by Application, 2025 and 2035
  • Figure 31: Latin America Market Y to o to Y Growth Comparison by Application, 2025-2035
  • Figure 32: Latin America Market Attractiveness Analysis by Application
  • Figure 33: Western Europe Market Value Share and BPS Analysis by Country, 2025 and 2035
  • Figure 34: Western Europe Market Value Share and BPS Analysis by Usability Type , 2025 and 2035
  • Figure 35: Western Europe Market Y to o to Y Growth Comparison by Usability Type , 2025-2035
  • Figure 36: Western Europe Market Attractiveness Analysis by Usability Type
  • Figure 37: Western Europe Market Value Share and BPS Analysis by Application, 2025 and 2035
  • Figure 38: Western Europe Market Y to o to Y Growth Comparison by Application, 2025-2035
  • Figure 39: Western Europe Market Attractiveness Analysis by Application
  • Figure 40: Eastern Europe Market Value Share and BPS Analysis by Country, 2025 and 2035
  • Figure 41: Eastern Europe Market Value Share and BPS Analysis by Usability Type , 2025 and 2035
  • Figure 42: Eastern Europe Market Y to o to Y Growth Comparison by Usability Type , 2025-2035
  • Figure 43: Eastern Europe Market Attractiveness Analysis by Usability Type
  • Figure 44: Eastern Europe Market Value Share and BPS Analysis by Application, 2025 and 2035
  • Figure 45: Eastern Europe Market Y to o to Y Growth Comparison by Application, 2025-2035
  • Figure 46: Eastern Europe Market Attractiveness Analysis by Application
  • Figure 47: East Asia Market Value Share and BPS Analysis by Country, 2025 and 2035
  • Figure 48: East Asia Market Value Share and BPS Analysis by Usability Type , 2025 and 2035
  • Figure 49: East Asia Market Y to o to Y Growth Comparison by Usability Type , 2025-2035
  • Figure 50: East Asia Market Attractiveness Analysis by Usability Type
  • Figure 51: East Asia Market Value Share and BPS Analysis by Application, 2025 and 2035
  • Figure 52: East Asia Market Y to o to Y Growth Comparison by Application, 2025-2035
  • Figure 53: East Asia Market Attractiveness Analysis by Application
  • Figure 54: South Asia and Pacific Market Value Share and BPS Analysis by Country, 2025 and 2035
  • Figure 55: South Asia and Pacific Market Value Share and BPS Analysis by Usability Type , 2025 and 2035
  • Figure 56: South Asia and Pacific Market Y to o to Y Growth Comparison by Usability Type , 2025-2035
  • Figure 57: South Asia and Pacific Market Attractiveness Analysis by Usability Type
  • Figure 58: South Asia and Pacific Market Value Share and BPS Analysis by Application, 2025 and 2035
  • Figure 59: South Asia and Pacific Market Y to o to Y Growth Comparison by Application, 2025-2035
  • Figure 60: South Asia and Pacific Market Attractiveness Analysis by Application
  • Figure 61: Middle East & Africa Market Value Share and BPS Analysis by Country, 2025 and 2035
  • Figure 62: Middle East & Africa Market Value Share and BPS Analysis by Usability Type , 2025 and 2035
  • Figure 63: Middle East & Africa Market Y to o to Y Growth Comparison by Usability Type , 2025-2035
  • Figure 64: Middle East & Africa Market Attractiveness Analysis by Usability Type
  • Figure 65: Middle East & Africa Market Value Share and BPS Analysis by Application, 2025 and 2035
  • Figure 66: Middle East & Africa Market Y to o to Y Growth Comparison by Application, 2025-2035
  • Figure 67: Middle East & Africa Market Attractiveness Analysis by Application
  • Figure 68: Global Market - Tier Structure Analysis
  • Figure 69: Global Market - Company Share Analysis
Dashboard
Dashboard
Dashboard
Dashboard
Dashboard
Dashboard

Full Research Suite comprises of:

Market outlook & trends analysis

Market outlook & trends analysis

Interviews & case studies

Interviews & case studies

Strategic recommendations

Strategic recommendations

Vendor profiles & capabilities analysis

Vendor profiles & capabilities analysis

5-year forecasts

5-year forecasts

8 regions and 60+ country-level data splits

8 regions and 60+ country-level data splits

Market segment data splits

Market segment data splits

12 months of continuous data updates

12 months of continuous data updates

DELIVERED AS:

PDF EXCEL ONLINE

Full Research Suite


$5000

$7500

$10000

Buy Report Now
Similar Industry Reports

Similar Industry Reports

Vascular Patches Market

Vascular Patches Market Forecast and Outlook 2025 to 2035

Vascular Access System Market

Vascular Access System Market Size and Share Forecast Outlook 2025 to 2035

Vascular Parkinsonism Market

Vascular Parkinsonism Market Analysis - Size, Share, and Forecast Outlook 2025 to 2035

Vascular Boot market

Vascular Boot Market Trends and Forecast 2025 to 2035

Vascular Ulcer Treatment Market

The Vascular Ulcer Treatment Market Is Segmented by Ulcer Type, Treatment and Distribution Channel from 2025 To 2035

Vascular Dementia Treatment Market

Vascular Dementia Treatment Market Analysis by Drug Class, Route of Administration, Distribution Channel, and Region through 2035

Vascular Imaging Systems Market

Vascular Imaging Systems Market Growth - Trends & Forecast 2025 to 2035

Vascular Closure Devices Market

Vascular Closure Devices Analysis by Product Type by Product, By Age Group and by Distribution Channel through 2035

Vascular Access Catheters Market

Vascular Access Catheters Market - Growth & Forecast 2025 to 2035

Vascular Endothelial Growth Factor Inhibitor Market

Vascular Endothelial Growth Factor Inhibitor Market

Vascular Dressings Market

Vascular Dressings Market

Vascular prostheses market

Vascular prostheses market

Vascular Screening Market

Vascular Screening Market

Vascular Testing Devices Market

Vascular Testing Devices Market

Neovascular AMD Treatment Market

Neovascular AMD Treatment Market Growth, Analysis & Forecast by Drug Type, Disease Type, Age Group, Gender, Stage of Disease, Distribution Channel and Region through 2035

Nonvascular Interventional Radiology Device Market

Nonvascular Interventional Radiology Device Market Trends – Growth & Forecast 2024-2034

PET Vascular Prosthesis Market

PET Vascular Prosthesis Market Size and Share Forecast Outlook 2025 to 2035

Endovascular Aneurysm Repair (EVAR) Market

Endovascular Aneurysm Repair (EVAR) Market Size and Share Forecast Outlook 2025 to 2035

Endovascular Therapy Devices Market

Endovascular Therapy Devices Market Size and Share Forecast Outlook 2025 to 2035

Non-Vascular Stents Market

Non-Vascular Stents Market Growth - Trends & Forecast 2025 to 2035

Future Market Insights

Vascular Sheath Group Market

Chat With MaRIA

Chat With

MaRIA

Hi There, I am MaRIA, Your Market Research Intelligence Assistant. How may I help you?