Vertical Mill Market
FMI Finds Versatile Functionality to be at Forefront of Surging Vertical Mill Market Expansion across the United States, Japan, Korea, United Kingdom, Germany, Italy, and 30+ Countries
Vertical Mill Market by Type, Material, Application, Sales Channel, Region | Forecast 2023 to 2033
Vertical Mill Market Outlook (2023 to 2033)
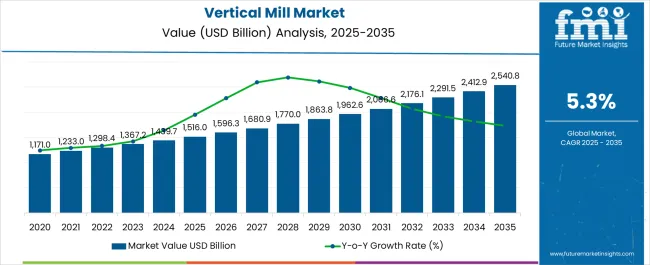
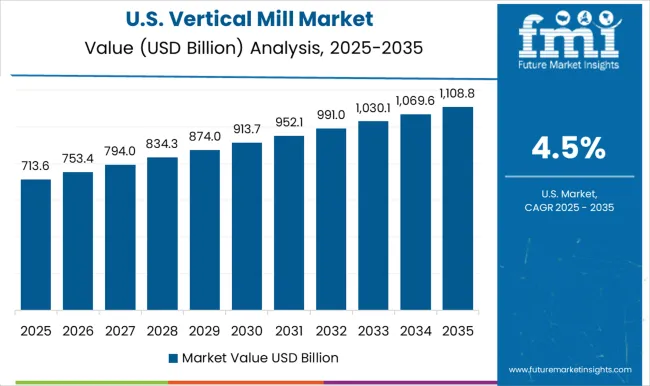
The overall sales of vertical mill are projected to reach a valuation of US$ 1,367.2 by the end of 2023, as per the study. This indicates a marginal jump from the market’s US$ 1,298.4 Million in 2022. A moderate growth at 5.3% CAGR is anticipated for the market during the forecast (2023 to 2033) period, which would yield a valuation of US$ 2,291.5 Million by 2033. The market’s year-on-year (Y-o-Y) growth in 2023 is anticipated to rise by 4.7%.
Vertical milling machines are precision tools used to fabricate and shape work pieces. Typically, they are used for fabricating and shaping metal. However, they can be compatible with plastic and other materials as well, depending on materials and tooling. Their operation may be computer numerical controlled (CNC), manual, or a combination of CNC and manual.
Apart from milling applications, they can also be used for boring, drilling, and slotting. Due to their one-piece tool heads, vertical milling machines are considerably less complex than horizontal ones. The heads remove the need for intricate gearing inside the vertical column. Over the past few years, this reality has been the market's main driver.
The demand for vertical CNC milling machines is projected to be considerably greater compared to the demand for their manual counterparts. This is due to the fact that CNC machines are much more accurate and efficient than manual mills owing to their computing power. They are better for creating parts featuring intricate geometries such as brackets, fittings, gearboxes, engine components, and more.
Additionally, vertical CNC mills offer greater ease of use than manual mills. They can also operate multiple sets simultaneously, leading to enhanced processing efficiency. However, the demand for vertical CNC mills may hit a roadblock during the forecast period due to high costs. Manual mills may not be as accurate and efficient as CNC mills, but they are significantly more affordable.
Owing to their versatile functionality, vertical milling machines are used in a diverse array of industries such as electronics, construction, aerospace, and automotive. FMI expects all these industries to register varying rates of expansion from 2023 to 2033. As a result, the vertical mill market is set to benefit as demand for vertical mills increases during the forecast period.
Attribute |
Key Insights |
Estimated Vertical Mill Market Value (2023) |
US$ 1,367.2 Million |
Projected Market Value (2033) |
US$ 2,291.5 Million |
Value-based CAGR (2023 to 2033) |
5.3% CAGR |
Market Share of the United States |
34.2% |
Let us know your requirement to get
100% FREE customization
2018 to 2022 Vertical Mill Market Outlook Compared to Demand Forecast from 2023 to 2033
The vertical mill market's size increased from US$ 1,080.5 Million in 2018 to US$ 1,298.4 Million in 2022. Demand in the market grew at a CAGR of 4.7% during the historical period (2018 to 2022). Manual vertical milling machines are generally inexpensive and do not require a highly skilled crew to operate them, the machine owner's operational costs are further reduced (by eliminating the training cost).
The machines' footprint is also smaller than that of horizontal milling machines due to their smaller size. In places where real estate costs are higher, these financial benefits are poised to fuel demand for manual vertical mills.
However, demand for CNC vertical mills is predicted to be significantly higher in industries and sectors where money is not a problem such as the aviation and aerospace sectors. Future Market Insights (FMI) anticipates substantial increase in demand for aviation and aerospace parts from 2023 to 2033, which is likely to propel the demand for vertical mills.
Market-o-Nomics – Highlighting the Key Trends
FMI expects the vertical mill market to be driven by multiple factors in the years ahead. Expert analysts at FMI have assessed emerging opportunities, market restraints, and potential threats that are set to affect the market. The drivers, restraints, opportunities, and threats (DROTs) identified are as follows:
DRIVERS |
|
RESTRAINTS |
|
OPPORTUNITIES |
|
THREATS |
|
Find your sweet spots for generating winning opportunities in this market.
Talk to AnalystCountry Wise Analysis
How is the Vertical Mill Market Developing in the United States?
Rising Vertical Mills Demand across Automotive and Construction Sectors in United States to Boost Sales
In recent years, the market for vertical mills in United States has been growing at a rapid pace. This is due to the increasing demand for these machines from various industries such as automotive, aerospace, and construction.
With the growing demand, various companies have been investing in research and development to improve the performance of their products. This has led to the introduction of new and innovative products in the market.
The competition in the market is also intensifying as more companies are entering this space. However, with the right strategies in place, companies can still gain a competitive edge. Global vertical mill sales generate 34.2% of its total revenue from the United States
How Big is the Opportunity for Vertical Mills in Europe?
United Kingdom and Germany to Spearhead the Growth in Europe Vertical Mill Market
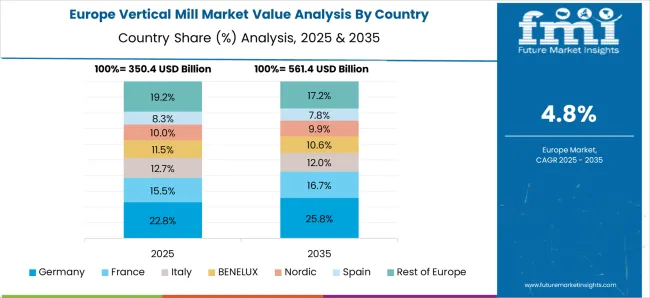
Demand for vertical mill machines in Europe is continuously rising on the back of rising popularity of the machining process across several industries such as food & beverage, automotive, and construction. This process is used to create parts with a high degree of accuracy and precision. Milling can be done on a variety of materials, including metals, plastics, and composites.
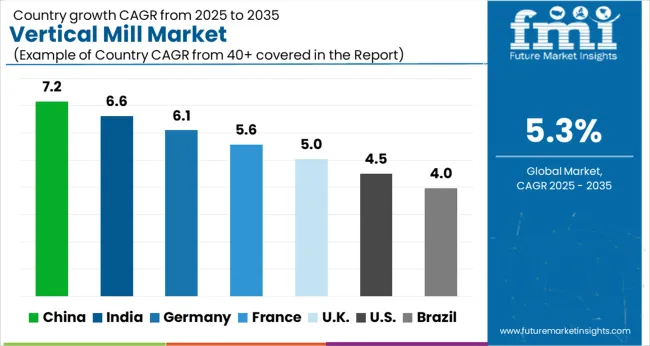
Another reason for the growing demand for vertical mills is the fact that they are much faster than traditional horizontal mills. This increased speed can lead to increased productivity and profits for businesses who utilize them. Germany is estimated to have a 25.9% market share, while the anticipated CAGR of the United Kingdom market is a healthy 6.1% over the projection period.
Will Demand for Vertical Mills in China Outpace the Sales in India?
Strong Presence of Manufacturing Sector Spurring Market Expansion in Asia Pacific
Due to the large presence of the manufacturing sector in the region, Asia Pacific was observed to be among the most dominant markets in 2022. The manufacturing sector has been spurred by rising commodity prices and population growth, which has fueled demand for vertical milling machines throughout Asia Pacific, particularly in China and India.
India and China are expected to be the most lucrative markets in Asia Pacific. Sales in India and China are slated to expand at 5.9% CAGR and 6.4% CAGR, respectively. However, Japan is slated to have around 6.4% share of the market.
Category Wise Insights
How are Vertical Mills Useful in the Food & Beverage Industry?
Customization in Vertical Mills to Create Opportunities for Manufacturers in Food & Beverage Domain
Extensive use of vertical mills in food and beverage industry due to their compact size and ability to deliver a high degree of grinding is expected to spur the sales. These mills are able to handle both wet and dry ingredients, making them versatile tools in any kitchen. Additionally, vertical mills can be used to grind a variety of food items, from spices to coffee beans.
One of the most significant potential advantages of using a vertical mill in the food and beverage domain is the ability to create custom grinding settings. This allows for more control over the quality of the final product, ensuring that it meets the specific needs of the end-user.
Which is the Chief Application for Vertical Mills?
Enhanced Production, Reduced Operating Costs, and Better Quality to Fuel Vertical Mills Demand for Drilling and Slotting
There are several advantages of using vertical mills over other types of mills when it comes to applications like drilling/boring, slotting/keyways, and milling. For starters, they are more efficient than other types of mills because they facilitate greater production.
Also, vertical mills require less energy to operate than other types of mills, resulting in lower operating costs. Additionally, they produce products with a higher degree of precision and accuracy than other types of mills, resulting in improved product quality.
A unified Market Research Subscription Platform, built for today's disparate research needs.
Competitive Landscape
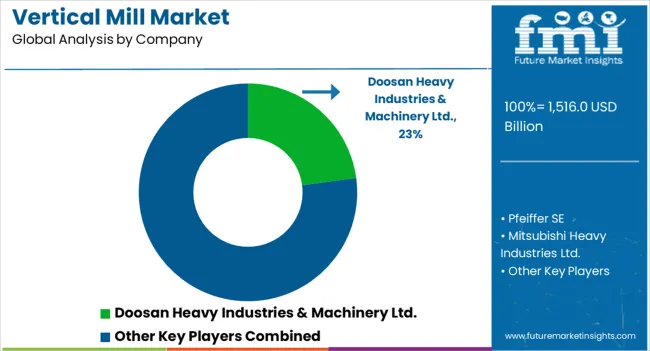
As per FMI, the global market for vertical mills is expected to be fragmented over the upcoming decade. Leading key players in the market include Doosan Heavy Industries & Machinery Ltd., GEBR. Pfeiffer SE, Mitsubishi Heavy Industries Ltd., FLSmidth & Co. A/S, and CITIC Heavy Industries Co. Ltd.
In order to survive and thrive in this competitive environment, these companies are focusing on product innovation and developments. They are also expanding their geographical reach to tap into new growth markets.
For instance
- In May 2021, Doosan Heavy Industries & Machinery Ltd. announced the launch of the PUMA VTR1012FC/1216FC with an automatic chuck changer feature.
Scope of the Report
Attribute |
Details |
Estimated Market Size (2023) |
US$ 1,367.2 Million |
Projected Market Valuation (2033) |
US$ 2,291.5 Million |
Value-based CAGR (2023 to 2033) |
5.3% |
Forecast Period |
2023 to 2033 |
Historical Data Available for |
2018 to 2022 |
Market Analysis |
Value (US$ Million) |
Key Regions Covered |
|
Key Countries Covered |
|
Key Segments Covered |
|
Key Companies Profiled |
|
Report Coverage |
Drivers, Restraints, Opportunities and Threats Analysis, Market Forecast, Company Share Analysis, Market Dynamics and Challenges, Competitive Landscape, and Strategic Growth Initiatives |
Vertical Mill Market Segmentation by Category
By Type:
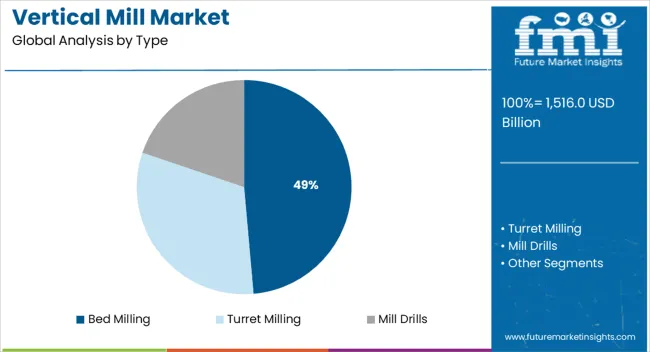
- Bed Milling
- Turret Milling
- Mill Drills
By Material:
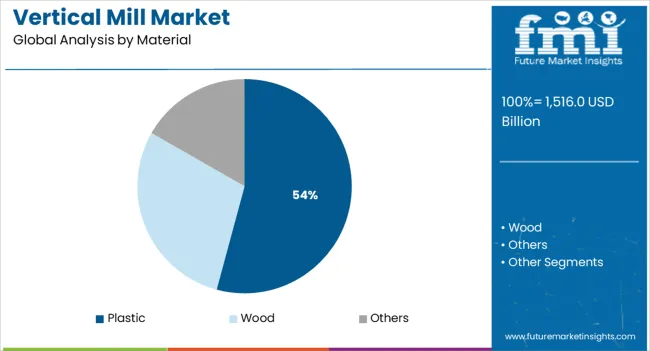
- Plastic
- Wood
- Others
By Application:
- Food & Beverage
- Drilling/Boring
- Milling
- Slotting/Keyways
By Sales Channel:
- Online
- Offline
By Region:
- North America
- Europe
- Asia Pacific
- Latin America
- Middle East & Africa
Frequently Asked Questions
What is the demand outlook for vertical mills in 2023?
Demand for vertical mills will reach a valuation of US$ 1,367.2 Million by the end of 2023, estimates FMI.
What is the sales outlook of vertical mills in the United States?
As per the study, the demand for vertical mills in the United States is anticipated to have a 34.2% share in the global market.
Which are the leading countries driving demand for vertical mills?
The United States, Brazil, Germany, United Kingdom, France, Italy, Russia, China, Japan, India, and Australia are expected to be the leading countries driving demand for vertical mills.
What is the outlook for the Germany market for vertical mills?
The Germany market for vertical mills is estimated to have a market share of 25.9%.
Who are the top 5 players operating in the market?
Doosan Heavy Industries & Machinery Ltd., Pfeiffer SE, Mitsubishi Heavy Industries Ltd., FLSmidth & Co. A/S, CITIC Heavy Industries Co. Ltd. are profiled to be the top 5 players manufacturing vertical mills.
What is the outlook for the Japan market for vertical mills?
The market share of Japan is predicted to be 6.4%.
At what rate is the market for vertical mills expected to grow in India?
The India market for vertical mills is expected to grow at 5.9% CAGR between 2023 and 2033.
What is the demand outlook forecast for the global market for vertical mills?
The global market for vertical mills is poised to surpass US$ 2,291.5 Million by the end of 2033.
Table of Content
1. Executive Summary | Vertical Mill Market 1.1. Global Market Outlook 1.2. Demand-side Trends 1.3. Supply-side Trends 1.4. Technology Roadmap Analysis 1.5. Analysis and Recommendations 2. Market Overview 2.1. Market Coverage / Taxonomy 2.2. Market Definition / Scope / Limitations 3. Market Background 3.1. Market Dynamics 3.1.1. Drivers 3.1.2. Restraints 3.1.3. Opportunity 3.1.4. Trends 3.2. Scenario Forecast 3.2.1. Demand in Optimistic Scenario 3.2.2. Demand in Likely Scenario 3.2.3. Demand in Conservative Scenario 3.3. Product launches & Recent Developments 3.4. Product Life Cycle Analysis 3.5. Value Chain Analysis 3.5.1. Supply Side Participants and their Roles 3.5.1.1. Producers 3.5.1.2. Mid-Level Participants (Traders/ Agents/ Brokers) 3.5.1.3. Wholesalers and Distributors 3.5.2. % of Operating Margin Analysis 3.5.3. List of Raw Material Suppliers 3.5.4. List of Existing and Potential Buyer’s 3.6. Global Market - Pricing Analysis 3.6.1. Price Point Assessment by Region 3.6.2. Price Point Assessment by Product Type 3.6.3. Price Forecast till 2033 3.6.4. Factors affecting pricing 3.7. Forecast Factors - Relevance & Impact 3.8. PESTLE and Porter’s Analysis 3.9. Regulatory Landscape 3.9.1. Packaging & Labelling Regulations 3.9.2. Certifications and Certifying Agency Overview 3.9.3. Import/Export Policies 3.10. Regional Parent Market Outlook 3.11. Production and Consumption Statistics 3.12. Import and Export Statistics 3.13. Consumers Survey Analysis 3.14. Macro-Economic Factors 3.15. Product Claims & Nutritional Information Scan by Buyers 4. Global Market Analysis 2018 to 2022 and Forecast, 2023 to 2033 4.1. Historical Market Size Value (US$ million) & Volume (MT) Analysis, 2018 to 2022 4.2. Current and Future Market Size Value (US$ million) & Volume (MT) Projections, 2023 to 2033 4.2.1. Y-o-Y Growth Trend Analysis 4.2.2. Absolute $ Opportunity Analysis 5. Global Market Analysis 2018 to 2022 and Forecast 2023 to 2033, By Type 5.1. Introduction / Key Findings 5.2. Historical Market Size Value (US$ million) & Volume (MT) Analysis By Type, 2018 to 2022 5.3. Current and Future Market Size Value (US$ million) & Volume (MT) Analysis and Forecast By Type, 2023 to 2033 5.3.1. Bed Milling 5.3.2. Turret Milling 5.3.3. Mill Drills 5.4. Y-o-Y Growth Trend Analysis By Type, 2018 to 2022 5.5. Absolute $ Opportunity Analysis By Type, 2023 to 2033 6. Global Market Analysis 2018 to 2022 and Forecast 2023 to 2033, By Material 6.1. Introduction / Key Findings 6.2. Historical Market Size Value (US$ million) & Volume (MT) Analysis By Material, 2018 to 2022 6.3. Current and Future Market Size Value (US$ million) & Volume (MT) Analysis and Forecast By Material, 2023 to 2033 6.3.1. Plastic 6.3.2. Wood 6.4. Y-o-Y Growth Trend Analysis By Material, 2018 to 2022 6.5. Absolute $ Opportunity Analysis By Material, 2023 to 2033 7. Global Market Analysis 2018 to 2022 and Forecast 2023 to 2033, By Application 7.1. Introduction / Key Findings 7.2. Historical Market Size Value (US$ million) & Volume (MT) Analysis By Application, 2018 to 2022 7.3. Current and Future Market Size Value (US$ million) & Volume (MT) Analysis and Forecast By Application, 2023 to 2033 7.3.1. Food & Beverage 7.3.2. Drilling/Boring 7.3.3. Milling 7.3.4. Slotting/Keyways 7.4. Y-o-Y Growth Trend Analysis By Application, 2018 to 2022 7.5. Absolute $ Opportunity Analysis By Application, 2023 to 2033 8. Global Market Analysis 2018 to 2022 and Forecast 2023 to 2033, By Sales Channel 8.1. Introduction / Key Findings 8.2. Historical Market Size Value (US$ million) & Volume (MT) Analysis By Sales Channel, 2018 to 2022 8.3. Current and Future Market Size Value (US$ million) & Volume (MT) Analysis and Forecast By Sales Channel, 2023 to 2033 8.3.1. Online 8.3.2. Offline 8.4. Y-o-Y Growth Trend Analysis By Sales Channel, 2018 to 2022 8.5. Absolute $ Opportunity Analysis By Sales Channel, 2023 to 2033 9. Global Market Analysis 2018 to 2022 and Forecast 2023 to 2033, By Region 9.1. Introduction 9.2. Historical Market Size Value (US$ million) & Volume (MT) Analysis By Region, 2018 to 2022 9.3. Current Market Size Value (US$ million) & Volume (MT) Analysis and Forecast By Region, 2023 to 2033 9.3.1. North America 9.3.2. Latin America 9.3.3. Europe 9.3.4. East Asia 9.3.5. South Asia 9.3.6. Oceania 9.3.7. MEA 9.4. Market Attractiveness Analysis By Region 10. North America Market Analysis 2018 to 2022 and Forecast 2023 to 2033, By Country 10.1. Historical Market Size Value (US$ million) & Volume (MT) Trend Analysis By Market Taxonomy, 2018 to 2022 10.2. Market Size Value (US$ million) & Volume (MT) Forecast By Market Taxonomy, 2023 to 2033 10.2.1. By Country 10.2.1.1. USA 10.2.1.2. Canada 10.2.2. By Type 10.2.3. By Material 10.2.4. By Application 10.2.5. By Sales Channel 10.3. Market Attractiveness Analysis 10.3.1. By Country 10.3.2. By Type 10.3.3. By Material 10.3.4. By Application 10.3.5. By Sales Channel 10.4. Key Takeaways 11. Latin America Market Analysis 2018 to 2022 and Forecast 2023 to 2033, By Country 11.1. Historical Market Size Value (US$ million) & Volume (MT) Trend Analysis By Market Taxonomy, 2018 to 2022 11.2. Market Size Value (US$ million) & Volume (MT) Forecast By Market Taxonomy, 2023 to 2033 11.2.1. By Country 11.2.1.1. Brazil 11.2.1.2. Mexico 11.2.1.3. Argentina 11.2.1.4. Chile 11.2.1.5. Peru 11.2.1.6. Rest of Latin America 11.2.2. By Type 11.2.3. By Material 11.2.4. By Application 11.2.5. By Sales Channel 11.3. Market Attractiveness Analysis 11.3.1. By Country 11.3.2. By Type 11.3.3. By Material 11.3.4. By Application 11.3.5. By Sales Channel 11.4. Key Takeaways 12. Europe Market Analysis 2018 to 2022 and Forecast 2023 to 2033, By Country 12.1. Historical Market Size Value (US$ million) & Volume (MT) Trend Analysis By Market Taxonomy, 2018 to 2022 12.2. Market Size Value (US$ million) & Volume (MT) Forecast By Market Taxonomy, 2023 to 2033 12.2.1. By Country 12.2.1.1. Germany 12.2.1.2. Italy 12.2.1.3. France 12.2.1.4. United Kingdom 12.2.1.5. Spain 12.2.1.6. Russia 12.2.1.7. BENELUX 12.2.1.8. Poland 12.2.1.9. Nordic Countries 12.2.1.10. Rest of Europe 12.2.2. By Type 12.2.3. By Material 12.2.4. By Application 12.2.5. By Sales Channel 12.3. Market Attractiveness Analysis 12.3.1. By Country 12.3.2. By Type 12.3.3. By Material 12.3.4. By Application 12.3.5. By Sales Channel 12.4. Key Takeaways 13. East Asia Market Analysis 2018 to 2022 and Forecast 2023 to 2033, By Country 13.1. Historical Market Size Value (US$ million) & Volume (MT) Trend Analysis By Market Taxonomy, 2018 to 2022 13.2. Market Size Value (US$ million) & Volume (MT) Forecast By Market Taxonomy, 2023 to 2033 13.2.1. By Country 13.2.1.1. China 13.2.1.2. Japan 13.2.1.3. South Korea 13.2.2. By Type 13.2.3. By Material 13.2.4. By Application 13.2.5. By Sales Channel 13.3. Market Attractiveness Analysis 13.3.1. By Country 13.3.2. By Type 13.3.3. By Material 13.3.4. By Application 13.3.5. By Sales Channel 13.4. Key Takeaways 14. South Asia Market Analysis 2018 to 2022 and Forecast 2023 to 2033, By Country 14.1. Historical Market Size Value (US$ million) & Volume (MT) Trend Analysis By Market Taxonomy, 2018 to 2022 14.2. Market Size Value (US$ million) & Volume (MT) Forecast By Market Taxonomy, 2023 to 2033 14.2.1. By Country 14.2.1.1. India 14.2.1.2. Thailand 14.2.1.3. Malaysia 14.2.1.4. Indonesia 14.2.1.5. Singapore 14.2.1.6. Rest of South Asia 14.2.2. By Type 14.2.3. By Material 14.2.4. By Application 14.2.5. By Sales Channel 14.3. Market Attractiveness Analysis 14.3.1. By Country 14.3.2. By Type 14.3.3. By Material 14.3.4. By Application 14.3.5. By Sales Channel 14.4. Key Takeaways 15. Oceania Market Analysis 2018 to 2022 and Forecast 2023 to 2033, By Country 15.1. Historical Market Size Value (US$ million) & Volume (MT) Trend Analysis By Market Taxonomy, 2018 to 2022 15.2. Market Size Value (US$ million) & Volume (MT) Forecast By Market Taxonomy, 2023 to 2033 15.2.1. By Country 15.2.1.1. Australia 15.2.1.2. New Zealand 15.2.2. By Type 15.2.3. By Material 15.2.4. By Application 15.2.5. By Sales Channel 15.3. Market Attractiveness Analysis 15.3.1. By Country 15.3.2. By Type 15.3.3. By Material 15.3.4. By Application 15.3.5. By Sales Channel 15.4. Key Takeaways 16. Middle East & Africa Market Analysis 2018 to 2022 and Forecast 2023 to 2033, By Country 16.1. Historical Market Size Value (US$ million) & Volume (MT) Trend Analysis By Market Taxonomy, 2018 to 2022 16.2. Market Size Value (US$ million) & Volume (MT) Forecast By Market Taxonomy, 2023 to 2033 16.2.1. By Country 16.2.1.1. GCC Countries 16.2.1.2. South Africa 16.2.1.3. Central Africa 16.2.1.4. North Africa 16.2.2. By Type 16.2.3. By Material 16.2.4. By Application 16.2.5. By Sales Channel 16.3. Market Attractiveness Analysis 16.3.1. By Country 16.3.2. By Type 16.3.3. By Material 16.3.4. By Application 16.3.5. By Sales Channel 16.4. Key Takeaways 17. Key Countries Market Analysis 17.1. USA 17.1.1. Pricing Analysis 17.1.2. Market Share Analysis, 2022 17.1.2.1. By Type 17.1.2.2. By Material 17.1.2.3. By Application 17.1.2.4. By Sales Channel 17.2. Canada 17.2.1. Pricing Analysis 17.2.2. Market Share Analysis, 2022 17.2.2.1. By Type 17.2.2.2. By Material 17.2.2.3. By Application 17.2.2.4. By Sales Channel 17.3. Brazil 17.3.1. Pricing Analysis 17.3.2. Market Share Analysis, 2022 17.3.2.1. By Type 17.3.2.2. By Material 17.3.2.3. By Application 17.3.2.4. By Sales Channel 17.4. Mexico 17.4.1. Pricing Analysis 17.4.2. Market Share Analysis, 2022 17.4.2.1. By Type 17.4.2.2. By Material 17.4.2.3. By Application 17.4.2.4. By Sales Channel 17.5. Argentina 17.5.1. Pricing Analysis 17.5.2. Market Share Analysis, 2022 17.5.2.1. By Type 17.5.2.2. By Material 17.5.2.3. By Application 17.5.2.4. By Sales Channel 17.6. Chile 17.6.1. Pricing Analysis 17.6.2. Market Share Analysis, 2022 17.6.2.1. By Type 17.6.2.2. By Material 17.6.2.3. By Application 17.6.2.4. By Sales Channel 17.7. Peru 17.7.1. Pricing Analysis 17.7.2. Market Share Analysis, 2022 17.7.2.1. By Type 17.7.2.2. By Material 17.7.2.3. By Application 17.7.2.4. By Sales Channel 17.8. Germany 17.8.1. Pricing Analysis 17.8.2. Market Share Analysis, 2022 17.8.2.1. By Type 17.8.2.2. By Material 17.8.2.3. By Application 17.8.2.4. By Sales Channel 17.9. Italy 17.9.1. Pricing Analysis 17.9.2. Market Share Analysis, 2022 17.9.2.1. By Type 17.9.2.2. By Material 17.9.2.3. By Application 17.9.2.4. By Sales Channel 17.10. France 17.10.1. Pricing Analysis 17.10.2. Market Share Analysis, 2022 17.10.2.1. By Type 17.10.2.2. By Material 17.10.2.3. By Application 17.10.2.4. By Sales Channel 17.11. Spain 17.11.1. Pricing Analysis 17.11.2. Market Share Analysis, 2022 17.11.2.1. By Type 17.11.2.2. By Material 17.11.2.3. By Application 17.11.2.4. By Sales Channel 17.12. United Kingdom 17.12.1. Pricing Analysis 17.12.2. Market Share Analysis, 2022 17.12.2.1. By Type 17.12.2.2. By Material 17.12.2.3. By Application 17.12.2.4. By Sales Channel 17.13. Russia 17.13.1. Pricing Analysis 17.13.2. Market Share Analysis, 2022 17.13.2.1. By Type 17.13.2.2. By Material 17.13.2.3. By Application 17.13.2.4. By Sales Channel 17.14. Poland 17.14.1. Pricing Analysis 17.14.2. Market Share Analysis, 2022 17.14.2.1. By Type 17.14.2.2. By Material 17.14.2.3. By Application 17.14.2.4. By Sales Channel 17.15. BENELUX 17.15.1. Pricing Analysis 17.15.2. Market Share Analysis, 2022 17.15.2.1. By Type 17.15.2.2. By Material 17.15.2.3. By Application 17.15.2.4. By Sales Channel 17.16. Nordic Countries 17.16.1. Pricing Analysis 17.16.2. Market Share Analysis, 2022 17.16.2.1. By Type 17.16.2.2. By Material 17.16.2.3. By Application 17.16.2.4. By Sales Channel 17.17. China 17.17.1. Pricing Analysis 17.17.2. Market Share Analysis, 2022 17.17.2.1. By Type 17.17.2.2. By Material 17.17.2.3. By Application 17.17.2.4. By Sales Channel 17.18. Japan 17.18.1. Pricing Analysis 17.18.2. Market Share Analysis, 2022 17.18.2.1. By Type 17.18.2.2. By Material 17.18.2.3. By Application 17.18.2.4. By Sales Channel 17.19. South Korea 17.19.1. Pricing Analysis 17.19.2. Market Share Analysis, 2022 17.19.2.1. By Type 17.19.2.2. By Material 17.19.2.3. By Application 17.19.2.4. By Sales Channel 17.20. India 17.20.1. Pricing Analysis 17.20.2. Market Share Analysis, 2022 17.20.2.1. By Type 17.20.2.2. By Material 17.20.2.3. By Application 17.20.2.4. By Sales Channel 17.21. Thailand 17.21.1. Pricing Analysis 17.21.2. Market Share Analysis, 2022 17.21.2.1. By Type 17.21.2.2. By Material 17.21.2.3. By Application 17.21.2.4. By Sales Channel 17.22. Indonesia 17.22.1. Pricing Analysis 17.22.2. Market Share Analysis, 2022 17.22.2.1. By Type 17.22.2.2. By Material 17.22.2.3. By Application 17.22.2.4. By Sales Channel 17.23. Malaysia 17.23.1. Pricing Analysis 17.23.2. Market Share Analysis, 2022 17.23.2.1. By Type 17.23.2.2. By Material 17.23.2.3. By Application 17.23.2.4. By Sales Channel 17.24. Singapore 17.24.1. Pricing Analysis 17.24.2. Market Share Analysis, 2022 17.24.2.1. By Type 17.24.2.2. By Material 17.24.2.3. By Application 17.24.2.4. By Sales Channel 17.25. Australia 17.25.1. Pricing Analysis 17.25.2. Market Share Analysis, 2022 17.25.2.1. By Type 17.25.2.2. By Material 17.25.2.3. By Application 17.25.2.4. By Sales Channel 17.26. New Zealand 17.26.1. Pricing Analysis 17.26.2. Market Share Analysis, 2022 17.26.2.1. By Type 17.26.2.2. By Material 17.26.2.3. By Application 17.26.2.4. By Sales Channel 17.27. GCC Countries 17.27.1. Pricing Analysis 17.27.2. Market Share Analysis, 2022 17.27.2.1. By Type 17.27.2.2. By Material 17.27.2.3. By Application 17.27.2.4. By Sales Channel 17.28. South Africa 17.28.1. Pricing Analysis 17.28.2. Market Share Analysis, 2022 17.28.2.1. By Type 17.28.2.2. By Material 17.28.2.3. By Application 17.28.2.4. By Sales Channel 17.29. North Africa 17.29.1. Pricing Analysis 17.29.2. Market Share Analysis, 2022 17.29.2.1. By Type 17.29.2.2. By Material 17.29.2.3. By Application 17.29.2.4. By Sales Channel 17.30. Central Africa 17.30.1. Pricing Analysis 17.30.2. Market Share Analysis, 2022 17.30.2.1. By Type 17.30.2.2. By Material 17.30.2.3. By Application 17.30.2.4. By Sales Channel 18. Market Structure Analysis 18.1. Competition Dashboard 18.2. Competition Benchmarking 18.3. Market Share Analysis of Top Players 18.3.1. By Regional 18.3.2. By Type 18.3.3. By Material 18.3.4. By Application 18.3.5. By Sales Channel 19. Competition Analysis 19.1. Competition Deep Dive 19.1.1. Doosan Heavy Industries & Machinery Ltd. 19.1.1.1. Overview 19.1.1.2. Product Portfolio 19.1.1.3. Profitability by Market Segments (Type /Material/Application/Sales Channel/Region) 19.1.1.4. Sales Footprint 19.1.1.5. Strategy Overview 19.1.1.5.1. Marketing Strategy 19.1.1.5.2. Product Strategy 19.1.1.5.3. Channel Strategy 19.1.2. Pfeiffer SE 19.1.2.1. Overview 19.1.2.2. Product Portfolio 19.1.2.3. Profitability by Market Segments (Type /Material/Application/Sales Channel/Region) 19.1.2.4. Sales Footprint 19.1.2.5. Strategy Overview 19.1.2.5.1. Marketing Strategy 19.1.2.5.2. Product Strategy 19.1.2.5.3. Channel Strategy 19.1.3. Mitsubishi Heavy Industries Ltd. 19.1.3.1. Overview 19.1.3.2. Product Portfolio 19.1.3.3. Profitability by Market Segments (Type /Material/Application/Sales Channel/Region) 19.1.3.4. Sales Footprint 19.1.3.5. Strategy Overview 19.1.3.5.1. Marketing Strategy 19.1.3.5.2. Product Strategy 19.1.3.5.3. Channel Strategy 19.1.4. FLSmidth & Co. A/S 19.1.4.1. Overview 19.1.4.2. Product Portfolio 19.1.4.3. Profitability by Market Segments (Type /Material/Application/Sales Channel/Region) 19.1.4.4. Sales Footprint 19.1.4.5. Strategy Overview 19.1.4.5.1. Marketing Strategy 19.1.4.5.2. Product Strategy 19.1.4.5.3. Channel Strategy 19.1.5. CITIC Heavy Industries Co. Ltd. 19.1.5.1. Overview 19.1.5.2. Product Portfolio 19.1.5.3. Profitability by Market Segments (Type /Material/Application/Sales Channel/Region) 19.1.5.4. Sales Footprint 19.1.5.5. Strategy Overview 19.1.5.5.1. Marketing Strategy 19.1.5.5.2. Product Strategy 19.1.5.5.3. Channel Strategy 19.1.6. Lincoln Electric 19.1.6.1. Overview 19.1.6.2. Product Portfolio 19.1.6.3. Profitability by Market Segments (Type /Material/Application/Sales Channel/Region) 19.1.6.4. Sales Footprint 19.1.6.5. Strategy Overview 19.1.6.5.1. Marketing Strategy 19.1.6.5.2. Product Strategy 19.1.6.5.3. Channel Strategy 19.1.7. Haas Automation. 19.1.7.1. Overview 19.1.7.2. Product Portfolio 19.1.7.3. Profitability by Market Segments (Type /Material/Application/Sales Channel/Region) 19.1.7.4. Sales Footprint 19.1.7.5. Strategy Overview 19.1.7.5.1. Marketing Strategy 19.1.7.5.2. Product Strategy 19.1.7.5.3. Channel Strategy 19.1.8. Hurco 19.1.8.1. Overview 19.1.8.2. Product Portfolio 19.1.8.3. Profitability by Market Segments (Type /Material/Application/Sales Channel/Region) 19.1.8.4. Sales Footprint 19.1.8.5. Strategy Overview 19.1.8.5.1. Marketing Strategy 19.1.8.5.2. Product Strategy 19.1.8.5.3. Channel Strategy 19.1.9. Okuma Corporation 19.1.9.1. Overview 19.1.9.2. Product Portfolio 19.1.9.3. Profitability by Market Segments (Type /Material/Application/Sales Channel/Region) 19.1.9.4. Sales Footprint 19.1.9.5. Strategy Overview 19.1.9.5.1. Marketing Strategy 19.1.9.5.2. Product Strategy 19.1.9.5.3. Channel Strategy 19.1.10. Datron AG 19.1.10.1. Overview 19.1.10.2. Product Portfolio 19.1.10.3. Profitability by Market Segments (Type /Material/Application/Sales Channel/Region) 19.1.10.4. Sales Footprint 19.1.10.5. Strategy Overview 19.1.10.5.1. Marketing Strategy 19.1.10.5.2. Product Strategy 19.1.10.5.3. Channel Strategy 19.1.11. Maschinenfabrik Berthold Hermle AG 19.1.11.1. Overview 19.1.11.2. Product Portfolio 19.1.11.3. Profitability by Market Segments (Type /Material/Application/Sales Channel/Region) 19.1.11.4. Sales Footprint 19.1.11.5. Strategy Overview 19.1.11.5.1. Marketing Strategy 19.1.11.5.2. Product Strategy 19.1.11.5.3. Channel Strategy 19.1.12. FANUC CORPORATION 19.1.12.1. Overview 19.1.12.2. Product Portfolio 19.1.12.3. Profitability by Market Segments (Type /Material/Application/Sales Channel/Region) 19.1.12.4. Sales Footprint 19.1.12.5. Strategy Overview 19.1.12.5.1. Marketing Strategy 19.1.12.5.2. Product Strategy 19.1.12.5.3. Channel Strategy 19.1.13. Dalian Machine Tool Group Corporation 19.1.13.1. Overview 19.1.13.2. Product Portfolio 19.1.13.3. Profitability by Market Segments (Type /Material/Application/Sales Channel/Region) 19.1.13.4. Sales Footprint 19.1.13.5. Strategy Overview 19.1.13.5.1. Marketing Strategy 19.1.13.5.2. Product Strategy 19.1.13.5.3. Channel Strategy 19.1.14. AMADA CO., LTD. 19.1.14.1. Overview 19.1.14.2. Product Portfolio 19.1.14.3. Profitability by Market Segments (Type /Material/Application/Sales Channel/Region) 19.1.14.4. Sales Footprint 19.1.14.5. Strategy Overview 19.1.14.5.1. Marketing Strategy 19.1.14.5.2. Product Strategy 19.1.14.5.3. Channel Strategy 19.1.15. Yamazaki Mazak Corporation 19.1.15.1. Overview 19.1.15.2. Product Portfolio 19.1.15.3. Profitability by Market Segments (Type /Material/Application/Sales Channel/Region) 19.1.15.4. Sales Footprint 19.1.15.5. Strategy Overview 19.1.15.5.1. Marketing Strategy 19.1.15.5.2. Product Strategy 19.1.15.5.3. Channel Strategy 20. Assumptions & Acronyms Used 21. Research Methodology
Let us know your requirement to get
100% FREE customization
List of Tables
Table 1: Global Market Value (US$ Million) Forecast by Region, 2018 to 2033 Table 2: Global Market Volume (MT) Forecast by Region, 2018 to 2033 Table 3: Global Market Value (US$ Million) Forecast by Type, 2018 to 2033 Table 4: Global Market Volume (MT) Forecast by Type, 2018 to 2033 Table 5: Global Market Value (US$ Million) Forecast by Material, 2018 to 2033 Table 6: Global Market Volume (MT) Forecast by Material, 2018 to 2033 Table 7: Global Market Value (US$ Million) Forecast by Application, 2018 to 2033 Table 8: Global Market Volume (MT) Forecast by Application, 2018 to 2033 Table 9: Global Market Value (US$ Million) Forecast by Sales Channel, 2018 to 2033 Table 10: Global Market Volume (MT) Forecast by Sales Channel, 2018 to 2033 Table 11: North America Market Value (US$ Million) Forecast by Country, 2018 to 2033 Table 12: North America Market Volume (MT) Forecast by Country, 2018 to 2033 Table 13: North America Market Value (US$ Million) Forecast by Type, 2018 to 2033 Table 14: North America Market Volume (MT) Forecast by Type, 2018 to 2033 Table 15: North America Market Value (US$ Million) Forecast by Material, 2018 to 2033 Table 16: North America Market Volume (MT) Forecast by Material, 2018 to 2033 Table 17: North America Market Value (US$ Million) Forecast by Application, 2018 to 2033 Table 18: North America Market Volume (MT) Forecast by Application, 2018 to 2033 Table 19: North America Market Value (US$ Million) Forecast by Sales Channel, 2018 to 2033 Table 20: North America Market Volume (MT) Forecast by Sales Channel, 2018 to 2033 Table 21: Latin America Market Value (US$ Million) Forecast by Country, 2018 to 2033 Table 22: Latin America Market Volume (MT) Forecast by Country, 2018 to 2033 Table 23: Latin America Market Value (US$ Million) Forecast by Type, 2018 to 2033 Table 24: Latin America Market Volume (MT) Forecast by Type, 2018 to 2033 Table 25: Latin America Market Value (US$ Million) Forecast by Material, 2018 to 2033 Table 26: Latin America Market Volume (MT) Forecast by Material, 2018 to 2033 Table 27: Latin America Market Value (US$ Million) Forecast by Application, 2018 to 2033 Table 28: Latin America Market Volume (MT) Forecast by Application, 2018 to 2033 Table 29: Latin America Market Value (US$ Million) Forecast by Sales Channel, 2018 to 2033 Table 30: Latin America Market Volume (MT) Forecast by Sales Channel, 2018 to 2033 Table 31: Europe Market Value (US$ Million) Forecast by Country, 2018 to 2033 Table 32: Europe Market Volume (MT) Forecast by Country, 2018 to 2033 Table 33: Europe Market Value (US$ Million) Forecast by Type, 2018 to 2033 Table 34: Europe Market Volume (MT) Forecast by Type, 2018 to 2033 Table 35: Europe Market Value (US$ Million) Forecast by Material, 2018 to 2033 Table 36: Europe Market Volume (MT) Forecast by Material, 2018 to 2033 Table 37: Europe Market Value (US$ Million) Forecast by Application, 2018 to 2033 Table 38: Europe Market Volume (MT) Forecast by Application, 2018 to 2033 Table 39: Europe Market Value (US$ Million) Forecast by Sales Channel, 2018 to 2033 Table 40: Europe Market Volume (MT) Forecast by Sales Channel, 2018 to 2033 Table 41: East Asia Market Value (US$ Million) Forecast by Country, 2018 to 2033 Table 42: East Asia Market Volume (MT) Forecast by Country, 2018 to 2033 Table 43: East Asia Market Value (US$ Million) Forecast by Type, 2018 to 2033 Table 44: East Asia Market Volume (MT) Forecast by Type, 2018 to 2033 Table 45: East Asia Market Value (US$ Million) Forecast by Material, 2018 to 2033 Table 46: East Asia Market Volume (MT) Forecast by Material, 2018 to 2033 Table 47: East Asia Market Value (US$ Million) Forecast by Application, 2018 to 2033 Table 48: East Asia Market Volume (MT) Forecast by Application, 2018 to 2033 Table 49: East Asia Market Value (US$ Million) Forecast by Sales Channel, 2018 to 2033 Table 50: East Asia Market Volume (MT) Forecast by Sales Channel, 2018 to 2033 Table 51: South Asia Market Value (US$ Million) Forecast by Country, 2018 to 2033 Table 52: South Asia Market Volume (MT) Forecast by Country, 2018 to 2033 Table 53: South Asia Market Value (US$ Million) Forecast by Type, 2018 to 2033 Table 54: South Asia Market Volume (MT) Forecast by Type, 2018 to 2033 Table 55: South Asia Market Value (US$ Million) Forecast by Material, 2018 to 2033 Table 56: South Asia Market Volume (MT) Forecast by Material, 2018 to 2033 Table 57: South Asia Market Value (US$ Million) Forecast by Application, 2018 to 2033 Table 58: South Asia Market Volume (MT) Forecast by Application, 2018 to 2033 Table 59: South Asia Market Value (US$ Million) Forecast by Sales Channel, 2018 to 2033 Table 60: South Asia Market Volume (MT) Forecast by Sales Channel, 2018 to 2033 Table 61: Oceania Market Value (US$ Million) Forecast by Country, 2018 to 2033 Table 62: Oceania Market Volume (MT) Forecast by Country, 2018 to 2033 Table 63: Oceania Market Value (US$ Million) Forecast by Type, 2018 to 2033 Table 64: Oceania Market Volume (MT) Forecast by Type, 2018 to 2033 Table 65: Oceania Market Value (US$ Million) Forecast by Material, 2018 to 2033 Table 66: Oceania Market Volume (MT) Forecast by Material, 2018 to 2033 Table 67: Oceania Market Value (US$ Million) Forecast by Application, 2018 to 2033 Table 68: Oceania Market Volume (MT) Forecast by Application, 2018 to 2033 Table 69: Oceania Market Value (US$ Million) Forecast by Sales Channel, 2018 to 2033 Table 70: Oceania Market Volume (MT) Forecast by Sales Channel, 2018 to 2033 Table 71: MEA Market Value (US$ Million) Forecast by Country, 2018 to 2033 Table 72: MEA Market Volume (MT) Forecast by Country, 2018 to 2033 Table 73: MEA Market Value (US$ Million) Forecast by Type, 2018 to 2033 Table 74: MEA Market Volume (MT) Forecast by Type, 2018 to 2033 Table 75: MEA Market Value (US$ Million) Forecast by Material, 2018 to 2033 Table 76: MEA Market Volume (MT) Forecast by Material, 2018 to 2033 Table 77: MEA Market Value (US$ Million) Forecast by Application, 2018 to 2033 Table 78: MEA Market Volume (MT) Forecast by Application, 2018 to 2033 Table 79: MEA Market Value (US$ Million) Forecast by Sales Channel, 2018 to 2033 Table 80: MEA Market Volume (MT) Forecast by Sales Channel, 2018 to 2033
Find your sweet spots for generating winning opportunities in this market.
Talk to AnalystList of Charts
Figure 1: Global Market Value (US$ Million) by Type, 2023 to 2033 Figure 2: Global Market Value (US$ Million) by Material, 2023 to 2033 Figure 3: Global Market Value (US$ Million) by Application, 2023 to 2033 Figure 4: Global Market Value (US$ Million) by Sales Channel, 2023 to 2033 Figure 5: Global Market Value (US$ Million) by Region, 2023 to 2033 Figure 6: Global Market Value (US$ Million) Analysis by Region, 2018 to 2033 Figure 7: Global Market Volume (MT) Analysis by Region, 2018 to 2033 Figure 8: Global Market Value Share (%) and BPS Analysis by Region, 2023 to 2033 Figure 9: Global Market Y-o-Y Growth (%) Projections by Region, 2023 to 2033 Figure 10: Global Market Value (US$ Million) Analysis by Type, 2018 to 2033 Figure 11: Global Market Volume (MT) Analysis by Type, 2018 to 2033 Figure 12: Global Market Value Share (%) and BPS Analysis by Type, 2023 to 2033 Figure 13: Global Market Y-o-Y Growth (%) Projections by Type, 2023 to 2033 Figure 14: Global Market Value (US$ Million) Analysis by Material, 2018 to 2033 Figure 15: Global Market Volume (MT) Analysis by Material, 2018 to 2033 Figure 16: Global Market Value Share (%) and BPS Analysis by Material, 2023 to 2033 Figure 17: Global Market Y-o-Y Growth (%) Projections by Material, 2023 to 2033 Figure 18: Global Market Value (US$ Million) Analysis by Application, 2018 to 2033 Figure 19: Global Market Volume (MT) Analysis by Application, 2018 to 2033 Figure 20: Global Market Value Share (%) and BPS Analysis by Application, 2023 to 2033 Figure 21: Global Market Y-o-Y Growth (%) Projections by Application, 2023 to 2033 Figure 22: Global Market Value (US$ Million) Analysis by Sales Channel, 2018 to 2033 Figure 23: Global Market Volume (MT) Analysis by Sales Channel, 2018 to 2033 Figure 24: Global Market Value Share (%) and BPS Analysis by Sales Channel, 2023 to 2033 Figure 25: Global Market Y-o-Y Growth (%) Projections by Sales Channel, 2023 to 2033 Figure 26: Global Market Attractiveness by Type, 2023 to 2033 Figure 27: Global Market Attractiveness by Material, 2023 to 2033 Figure 28: Global Market Attractiveness by Application, 2023 to 2033 Figure 29: Global Market Attractiveness by Sales Channel, 2023 to 2033 Figure 30: Global Market Attractiveness by Region, 2023 to 2033 Figure 31: North America Market Value (US$ Million) by Type, 2023 to 2033 Figure 32: North America Market Value (US$ Million) by Material, 2023 to 2033 Figure 33: North America Market Value (US$ Million) by Application, 2023 to 2033 Figure 34: North America Market Value (US$ Million) by Sales Channel, 2023 to 2033 Figure 35: North America Market Value (US$ Million) by Country, 2023 to 2033 Figure 36: North America Market Value (US$ Million) Analysis by Country, 2018 to 2033 Figure 37: North America Market Volume (MT) Analysis by Country, 2018 to 2033 Figure 38: North America Market Value Share (%) and BPS Analysis by Country, 2023 to 2033 Figure 39: North America Market Y-o-Y Growth (%) Projections by Country, 2023 to 2033 Figure 40: North America Market Value (US$ Million) Analysis by Type, 2018 to 2033 Figure 41: North America Market Volume (MT) Analysis by Type, 2018 to 2033 Figure 42: North America Market Value Share (%) and BPS Analysis by Type, 2023 to 2033 Figure 43: North America Market Y-o-Y Growth (%) Projections by Type, 2023 to 2033 Figure 44: North America Market Value (US$ Million) Analysis by Material, 2018 to 2033 Figure 45: North America Market Volume (MT) Analysis by Material, 2018 to 2033 Figure 46: North America Market Value Share (%) and BPS Analysis by Material, 2023 to 2033 Figure 47: North America Market Y-o-Y Growth (%) Projections by Material, 2023 to 2033 Figure 48: North America Market Value (US$ Million) Analysis by Application, 2018 to 2033 Figure 49: North America Market Volume (MT) Analysis by Application, 2018 to 2033 Figure 50: North America Market Value Share (%) and BPS Analysis by Application, 2023 to 2033 Figure 51: North America Market Y-o-Y Growth (%) Projections by Application, 2023 to 2033 Figure 52: North America Market Value (US$ Million) Analysis by Sales Channel, 2018 to 2033 Figure 53: North America Market Volume (MT) Analysis by Sales Channel, 2018 to 2033 Figure 54: North America Market Value Share (%) and BPS Analysis by Sales Channel, 2023 to 2033 Figure 55: North America Market Y-o-Y Growth (%) Projections by Sales Channel, 2023 to 2033 Figure 56: North America Market Attractiveness by Type, 2023 to 2033 Figure 57: North America Market Attractiveness by Material, 2023 to 2033 Figure 58: North America Market Attractiveness by Application, 2023 to 2033 Figure 59: North America Market Attractiveness by Sales Channel, 2023 to 2033 Figure 60: North America Market Attractiveness by Country, 2023 to 2033 Figure 61: Latin America Market Value (US$ Million) by Type, 2023 to 2033 Figure 62: Latin America Market Value (US$ Million) by Material, 2023 to 2033 Figure 63: Latin America Market Value (US$ Million) by Application, 2023 to 2033 Figure 64: Latin America Market Value (US$ Million) by Sales Channel, 2023 to 2033 Figure 65: Latin America Market Value (US$ Million) by Country, 2023 to 2033 Figure 66: Latin America Market Value (US$ Million) Analysis by Country, 2018 to 2033 Figure 67: Latin America Market Volume (MT) Analysis by Country, 2018 to 2033 Figure 68: Latin America Market Value Share (%) and BPS Analysis by Country, 2023 to 2033 Figure 69: Latin America Market Y-o-Y Growth (%) Projections by Country, 2023 to 2033 Figure 70: Latin America Market Value (US$ Million) Analysis by Type, 2018 to 2033 Figure 71: Latin America Market Volume (MT) Analysis by Type, 2018 to 2033 Figure 72: Latin America Market Value Share (%) and BPS Analysis by Type, 2023 to 2033 Figure 73: Latin America Market Y-o-Y Growth (%) Projections by Type, 2023 to 2033 Figure 74: Latin America Market Value (US$ Million) Analysis by Material, 2018 to 2033 Figure 75: Latin America Market Volume (MT) Analysis by Material, 2018 to 2033 Figure 76: Latin America Market Value Share (%) and BPS Analysis by Material, 2023 to 2033 Figure 77: Latin America Market Y-o-Y Growth (%) Projections by Material, 2023 to 2033 Figure 78: Latin America Market Value (US$ Million) Analysis by Application, 2018 to 2033 Figure 79: Latin America Market Volume (MT) Analysis by Application, 2018 to 2033 Figure 80: Latin America Market Value Share (%) and BPS Analysis by Application, 2023 to 2033 Figure 81: Latin America Market Y-o-Y Growth (%) Projections by Application, 2023 to 2033 Figure 82: Latin America Market Value (US$ Million) Analysis by Sales Channel, 2018 to 2033 Figure 83: Latin America Market Volume (MT) Analysis by Sales Channel, 2018 to 2033 Figure 84: Latin America Market Value Share (%) and BPS Analysis by Sales Channel, 2023 to 2033 Figure 85: Latin America Market Y-o-Y Growth (%) Projections by Sales Channel, 2023 to 2033 Figure 86: Latin America Market Attractiveness by Type, 2023 to 2033 Figure 87: Latin America Market Attractiveness by Material, 2023 to 2033 Figure 88: Latin America Market Attractiveness by Application, 2023 to 2033 Figure 89: Latin America Market Attractiveness by Sales Channel, 2023 to 2033 Figure 90: Latin America Market Attractiveness by Country, 2023 to 2033 Figure 91: Europe Market Value (US$ Million) by Type, 2023 to 2033 Figure 92: Europe Market Value (US$ Million) by Material, 2023 to 2033 Figure 93: Europe Market Value (US$ Million) by Application, 2023 to 2033 Figure 94: Europe Market Value (US$ Million) by Sales Channel, 2023 to 2033 Figure 95: Europe Market Value (US$ Million) by Country, 2023 to 2033 Figure 96: Europe Market Value (US$ Million) Analysis by Country, 2018 to 2033 Figure 97: Europe Market Volume (MT) Analysis by Country, 2018 to 2033 Figure 98: Europe Market Value Share (%) and BPS Analysis by Country, 2023 to 2033 Figure 99: Europe Market Y-o-Y Growth (%) Projections by Country, 2023 to 2033 Figure 100: Europe Market Value (US$ Million) Analysis by Type, 2018 to 2033 Figure 101: Europe Market Volume (MT) Analysis by Type, 2018 to 2033 Figure 102: Europe Market Value Share (%) and BPS Analysis by Type, 2023 to 2033 Figure 103: Europe Market Y-o-Y Growth (%) Projections by Type, 2023 to 2033 Figure 104: Europe Market Value (US$ Million) Analysis by Material, 2018 to 2033 Figure 105: Europe Market Volume (MT) Analysis by Material, 2018 to 2033 Figure 106: Europe Market Value Share (%) and BPS Analysis by Material, 2023 to 2033 Figure 107: Europe Market Y-o-Y Growth (%) Projections by Material, 2023 to 2033 Figure 108: Europe Market Value (US$ Million) Analysis by Application, 2018 to 2033 Figure 109: Europe Market Volume (MT) Analysis by Application, 2018 to 2033 Figure 110: Europe Market Value Share (%) and BPS Analysis by Application, 2023 to 2033 Figure 111: Europe Market Y-o-Y Growth (%) Projections by Application, 2023 to 2033 Figure 112: Europe Market Value (US$ Million) Analysis by Sales Channel, 2018 to 2033 Figure 113: Europe Market Volume (MT) Analysis by Sales Channel, 2018 to 2033 Figure 114: Europe Market Value Share (%) and BPS Analysis by Sales Channel, 2023 to 2033 Figure 115: Europe Market Y-o-Y Growth (%) Projections by Sales Channel, 2023 to 2033 Figure 116: Europe Market Attractiveness by Type, 2023 to 2033 Figure 117: Europe Market Attractiveness by Material, 2023 to 2033 Figure 118: Europe Market Attractiveness by Application, 2023 to 2033 Figure 119: Europe Market Attractiveness by Sales Channel, 2023 to 2033 Figure 120: Europe Market Attractiveness by Country, 2023 to 2033 Figure 121: East Asia Market Value (US$ Million) by Type, 2023 to 2033 Figure 122: East Asia Market Value (US$ Million) by Material, 2023 to 2033 Figure 123: East Asia Market Value (US$ Million) by Application, 2023 to 2033 Figure 124: East Asia Market Value (US$ Million) by Sales Channel, 2023 to 2033 Figure 125: East Asia Market Value (US$ Million) by Country, 2023 to 2033 Figure 126: East Asia Market Value (US$ Million) Analysis by Country, 2018 to 2033 Figure 127: East Asia Market Volume (MT) Analysis by Country, 2018 to 2033 Figure 128: East Asia Market Value Share (%) and BPS Analysis by Country, 2023 to 2033 Figure 129: East Asia Market Y-o-Y Growth (%) Projections by Country, 2023 to 2033 Figure 130: East Asia Market Value (US$ Million) Analysis by Type, 2018 to 2033 Figure 131: East Asia Market Volume (MT) Analysis by Type, 2018 to 2033 Figure 132: East Asia Market Value Share (%) and BPS Analysis by Type, 2023 to 2033 Figure 133: East Asia Market Y-o-Y Growth (%) Projections by Type, 2023 to 2033 Figure 134: East Asia Market Value (US$ Million) Analysis by Material, 2018 to 2033 Figure 135: East Asia Market Volume (MT) Analysis by Material, 2018 to 2033 Figure 136: East Asia Market Value Share (%) and BPS Analysis by Material, 2023 to 2033 Figure 137: East Asia Market Y-o-Y Growth (%) Projections by Material, 2023 to 2033 Figure 138: East Asia Market Value (US$ Million) Analysis by Application, 2018 to 2033 Figure 139: East Asia Market Volume (MT) Analysis by Application, 2018 to 2033 Figure 140: East Asia Market Value Share (%) and BPS Analysis by Application, 2023 to 2033 Figure 141: East Asia Market Y-o-Y Growth (%) Projections by Application, 2023 to 2033 Figure 142: East Asia Market Value (US$ Million) Analysis by Sales Channel, 2018 to 2033 Figure 143: East Asia Market Volume (MT) Analysis by Sales Channel, 2018 to 2033 Figure 144: East Asia Market Value Share (%) and BPS Analysis by Sales Channel, 2023 to 2033 Figure 145: East Asia Market Y-o-Y Growth (%) Projections by Sales Channel, 2023 to 2033 Figure 146: East Asia Market Attractiveness by Type, 2023 to 2033 Figure 147: East Asia Market Attractiveness by Material, 2023 to 2033 Figure 148: East Asia Market Attractiveness by Application, 2023 to 2033 Figure 149: East Asia Market Attractiveness by Sales Channel, 2023 to 2033 Figure 150: East Asia Market Attractiveness by Country, 2023 to 2033 Figure 151: South Asia Market Value (US$ Million) by Type, 2023 to 2033 Figure 152: South Asia Market Value (US$ Million) by Material, 2023 to 2033 Figure 153: South Asia Market Value (US$ Million) by Application, 2023 to 2033 Figure 154: South Asia Market Value (US$ Million) by Sales Channel, 2023 to 2033 Figure 155: South Asia Market Value (US$ Million) by Country, 2023 to 2033 Figure 156: South Asia Market Value (US$ Million) Analysis by Country, 2018 to 2033 Figure 157: South Asia Market Volume (MT) Analysis by Country, 2018 to 2033 Figure 158: South Asia Market Value Share (%) and BPS Analysis by Country, 2023 to 2033 Figure 159: South Asia Market Y-o-Y Growth (%) Projections by Country, 2023 to 2033 Figure 160: South Asia Market Value (US$ Million) Analysis by Type, 2018 to 2033 Figure 161: South Asia Market Volume (MT) Analysis by Type, 2018 to 2033 Figure 162: South Asia Market Value Share (%) and BPS Analysis by Type, 2023 to 2033 Figure 163: South Asia Market Y-o-Y Growth (%) Projections by Type, 2023 to 2033 Figure 164: South Asia Market Value (US$ Million) Analysis by Material, 2018 to 2033 Figure 165: South Asia Market Volume (MT) Analysis by Material, 2018 to 2033 Figure 166: South Asia Market Value Share (%) and BPS Analysis by Material, 2023 to 2033 Figure 167: South Asia Market Y-o-Y Growth (%) Projections by Material, 2023 to 2033 Figure 168: South Asia Market Value (US$ Million) Analysis by Application, 2018 to 2033 Figure 169: South Asia Market Volume (MT) Analysis by Application, 2018 to 2033 Figure 170: South Asia Market Value Share (%) and BPS Analysis by Application, 2023 to 2033 Figure 171: South Asia Market Y-o-Y Growth (%) Projections by Application, 2023 to 2033 Figure 172: South Asia Market Value (US$ Million) Analysis by Sales Channel, 2018 to 2033 Figure 173: South Asia Market Volume (MT) Analysis by Sales Channel, 2018 to 2033 Figure 174: South Asia Market Value Share (%) and BPS Analysis by Sales Channel, 2023 to 2033 Figure 175: South Asia Market Y-o-Y Growth (%) Projections by Sales Channel, 2023 to 2033 Figure 176: South Asia Market Attractiveness by Type, 2023 to 2033 Figure 177: South Asia Market Attractiveness by Material, 2023 to 2033 Figure 178: South Asia Market Attractiveness by Application, 2023 to 2033 Figure 179: South Asia Market Attractiveness by Sales Channel, 2023 to 2033 Figure 180: South Asia Market Attractiveness by Country, 2023 to 2033 Figure 181: Oceania Market Value (US$ Million) by Type, 2023 to 2033 Figure 182: Oceania Market Value (US$ Million) by Material, 2023 to 2033 Figure 183: Oceania Market Value (US$ Million) by Application, 2023 to 2033 Figure 184: Oceania Market Value (US$ Million) by Sales Channel, 2023 to 2033 Figure 185: Oceania Market Value (US$ Million) by Country, 2023 to 2033 Figure 186: Oceania Market Value (US$ Million) Analysis by Country, 2018 to 2033 Figure 187: Oceania Market Volume (MT) Analysis by Country, 2018 to 2033 Figure 188: Oceania Market Value Share (%) and BPS Analysis by Country, 2023 to 2033 Figure 189: Oceania Market Y-o-Y Growth (%) Projections by Country, 2023 to 2033 Figure 190: Oceania Market Value (US$ Million) Analysis by Type, 2018 to 2033 Figure 191: Oceania Market Volume (MT) Analysis by Type, 2018 to 2033 Figure 192: Oceania Market Value Share (%) and BPS Analysis by Type, 2023 to 2033 Figure 193: Oceania Market Y-o-Y Growth (%) Projections by Type, 2023 to 2033 Figure 194: Oceania Market Value (US$ Million) Analysis by Material, 2018 to 2033 Figure 195: Oceania Market Volume (MT) Analysis by Material, 2018 to 2033 Figure 196: Oceania Market Value Share (%) and BPS Analysis by Material, 2023 to 2033 Figure 197: Oceania Market Y-o-Y Growth (%) Projections by Material, 2023 to 2033 Figure 198: Oceania Market Value (US$ Million) Analysis by Application, 2018 to 2033 Figure 199: Oceania Market Volume (MT) Analysis by Application, 2018 to 2033 Figure 200: Oceania Market Value Share (%) and BPS Analysis by Application, 2023 to 2033 Figure 201: Oceania Market Y-o-Y Growth (%) Projections by Application, 2023 to 2033 Figure 202: Oceania Market Value (US$ Million) Analysis by Sales Channel, 2018 to 2033 Figure 203: Oceania Market Volume (MT) Analysis by Sales Channel, 2018 to 2033 Figure 204: Oceania Market Value Share (%) and BPS Analysis by Sales Channel, 2023 to 2033 Figure 205: Oceania Market Y-o-Y Growth (%) Projections by Sales Channel, 2023 to 2033 Figure 206: Oceania Market Attractiveness by Type, 2023 to 2033 Figure 207: Oceania Market Attractiveness by Material, 2023 to 2033 Figure 208: Oceania Market Attractiveness by Application, 2023 to 2033 Figure 209: Oceania Market Attractiveness by Sales Channel, 2023 to 2033 Figure 210: Oceania Market Attractiveness by Country, 2023 to 2033 Figure 211: Middle East & Africa Market Value (US$ Million) by Type, 2023 to 2033 Figure 212: Middle East & Africa Market Value (US$ Million) by Material, 2023 to 2033 Figure 213: Middle East & Africa Market Value (US$ Million) by Application, 2023 to 2033 Figure 214: Middle East & Africa Market Value (US$ Million) by Sales Channel, 2023 to 2033 Figure 215: Middle East & Africa Market Value (US$ Million) by Country, 2023 to 2033 Figure 216: Middle East & Africa Market Value (US$ Million) Analysis by Country, 2018 to 2033 Figure 217: Middle East & Africa Market Volume (MT) Analysis by Country, 2018 to 2033 Figure 218: Middle East & Africa Market Value Share (%) and BPS Analysis by Country, 2023 to 2033 Figure 219: Middle East & Africa Market Y-o-Y Growth (%) Projections by Country, 2023 to 2033 Figure 220: Middle East & Africa Market Value (US$ Million) Analysis by Type, 2018 to 2033 Figure 221: Middle East & Africa Market Volume (MT) Analysis by Type, 2018 to 2033 Figure 222: Middle East & Africa Market Value Share (%) and BPS Analysis by Type, 2023 to 2033 Figure 223: Middle East & Africa Market Y-o-Y Growth (%) Projections by Type, 2023 to 2033 Figure 224: Middle East & Africa Market Value (US$ Million) Analysis by Material, 2018 to 2033 Figure 225: Middle East & Africa Market Volume (MT) Analysis by Material, 2018 to 2033 Figure 226: Middle East & Africa Market Value Share (%) and BPS Analysis by Material, 2023 to 2033 Figure 227: Middle East & Africa Market Y-o-Y Growth (%) Projections by Material, 2023 to 2033 Figure 228: Middle East & Africa Market Value (US$ Million) Analysis by Application, 2018 to 2033 Figure 229: Middle East & Africa Market Volume (MT) Analysis by Application, 2018 to 2033 Figure 230: Middle East & Africa Market Value Share (%) and BPS Analysis by Application, 2023 to 2033 Figure 231: Middle East & Africa Market Y-o-Y Growth (%) Projections by Application, 2023 to 2033 Figure 232: Middle East & Africa Market Value (US$ Million) Analysis by Sales Channel, 2018 to 2033 Figure 233: Middle East & Africa Market Volume (MT) Analysis by Sales Channel, 2018 to 2033 Figure 234: Middle East & Africa Market Value Share (%) and BPS Analysis by Sales Channel, 2023 to 2033 Figure 235: Middle East & Africa Market Y-o-Y Growth (%) Projections by Sales Channel, 2023 to 2033 Figure 236: Middle East & Africa Market Attractiveness by Type, 2023 to 2033 Figure 237: Middle East & Africa Market Attractiveness by Material, 2023 to 2033 Figure 238: Middle East & Africa Market Attractiveness by Application, 2023 to 2033 Figure 239: Middle East & Africa Market Attractiveness by Sales Channel, 2023 to 2033 Figure 240: Middle East & Africa Market Attractiveness by Country, 2023 to 2033
Need specific information?
Request CustomizationExplore Process Automation Insights
View Reports