Dal Mill Machine Market Outlook (2023 to 2033)

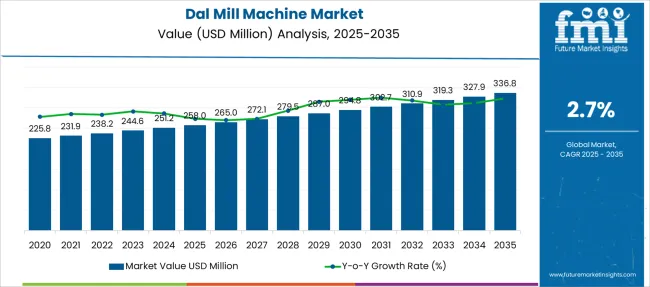
The global dal mill machine market is expected to be valued at US$ 238.2 million in 2023 and further grow at 2.7% CAGR between 2023 and 2033, surpassing a valuation of US$ 310.9 Million by 2033. Rising production and consumption of lentils across the world is a key factors pushing demand for dal mill machines in the market.

A dal mill machine is a food processing machine that is designed to split and hull lentils. These machines have gained immense popularity across high-lentil-consuming countries during the last few years and the trend is likely to continue during the forecast period. They have become an integral part of commercial kitchens and can be used to process and grind various types of lentils, beans, and other legumes into a fine paste or powder.

Lentils are an important food crop in many parts of the world, but they are especially prevalent in countries like India, Pakistan, and China. In India, dal mills are used to process both food and animal feed. The machines are designed to remove the husk from the lentil, split it into smaller pieces, and then polish it to remove any remaining husks. They help end users improve productivity and reduce costs and labor.

Rising consumption of legumes across the globe due to their various health benefits is expected to generate high demand for dal mill machines during the forecast period. Legumes are typically low in fat and contain no cholesterol. They contain high amounts of fiber, protein, vitamins, and minerals. Hence, their consumption is growing rapidly worldwide.

Similarly, increasing usage of lentils, peas, and beans across the food processing industry and growing demand for packaged and ready-to-eat foods are expected to propel sales of dal mill machines during the forecast period.

In recent years, the popularity of dal mill machines has grown exponentially. One of the main reasons for this is the rise of online sales channels. Online sales channels have made it easier than ever for people to purchase dal mill machines.

There are a few reasons why online sales channels are so popular. First, they offer a wide variety of products. Second, they provide customers with an easy way to compare and find the best deals. Finally, online sales channels offer a convenient way for customers to purchase products.

The popularity of online sales channels has had a major impact on the sales of dal mill machines. In fact, many manufacturers have started selling their products exclusively through online channels. This trend is likely to continue as more people learn about the benefits of buying dal mill machines online.

Attribute Key Insights
Dal Mill Machine Market Estimated Value (2023) US$ 238.2 Million
Projected Market Value (2033) US$ 310.9 Million
Value-based CAGR (2023 to 2033) 2.7%
Market Share of US 32.7%

Don't pay for what you don't need

Customize your report by selecting specific countries or regions and save 30%!

2018 to 2022 Global Dal Mill Machine Market Outlook Compared to 2023 to 2033 Forecast

The global dal mill machine market is forecast to grow at a CAGR of over 2.7% between 2023 and 2033 in comparison to the 1.9% CAGR registered during the historical period from 2018 to 2022.

Growing demand for dal, particularly in developing countries, increasing use of dal in various dishes, and rising popularity of packaged and ready-to-eat foods are some of the key factors driving the global dal mill machine market.

Similarly, the growing adoption of mini dal mill machines across households and the integration of advanced technologies in dal processing equipment are expected to boost the market during the next ten years.

Market-o-Nomics - Highlighting the Key Trends

A number of influential factors have been identified that are expected to spur growth in the global industrial dal mill machine market during the projection period (2023 to 2033). Besides the proliferating aspects prevailing in the market, the analysts at FMI have also analyzed the restraining elements, lucrative opportunities, and upcoming threats that can somehow influence industrial dal mill machine sales.

The drivers, restraints, opportunities, and threats (DROTs) identified are as follows:

DRIVERS

  • Rising production and consumption of legumes across the world is a key factors driving the global market forward.
  • The growing adoption of mini dal machines is expected to boost sales in the market during the forecast period. 

RESTRAINTS

  • The high cost of dal mill machines is restraining the growth of the global market, particularly in low-income regions.

OPPORTUNITIES

  • The booming export of pulse worldwide is expected to generate lucrative opportunities for the growth of the dal mill machine market over the next decade.
  • The development of compact, user-friendly, and energy-efficient machines is likely to create growth prospects for the market.

THREATS

  • Rising energy concerns are likely to inhibit growth of the market during the forecast period.
  • Fluctuations in raw material prices and restrictions on trade due to various reasons are also expected to negatively influence the sales of dal mill machines.
Nandini Roy Choudhury

Principal Consultant

Talk to Analyst

Find your sweet spots for generating winning opportunities in this market.

Country-wise Insights

How Will the US Dal Mill Machine Market Fare?

“Growing Consumption of Legumes Driving the Dal Mill Machine Market in the US”

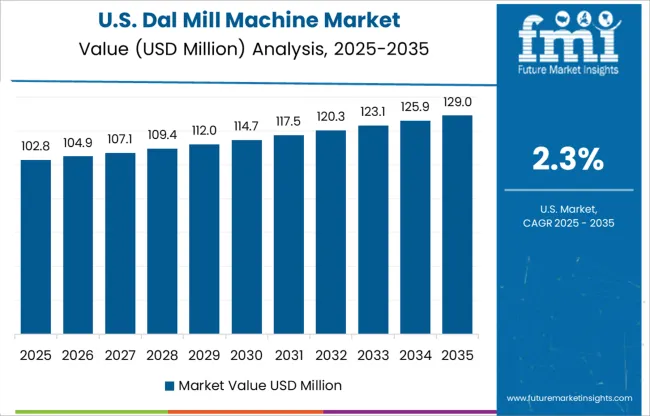
The US dal mill machine market is anticipated to grow at a moderate pace during the forecast period, owing to the rapid growth of the food processing industry, growing demand for high nutritional products, and increasing consumption of legumes.

Dal mill machines are used to process various lentils and beans across North American countries like the US and Canada. These machines are designed to remove the husk and split the lentils or beans into two parts. They can also be used to grind the pulses into a powder form.

The rise in the consumption of natural and healthy food products like beans and lentils across the US is expected to boost the sales of dal mill machines in the country during the forecast period.

In recent years, there has been a sharp rise in the consumption of legumes, including beans, peas, lentils, and chickpeas, as they are naturally gluten-free, contain high fiber, and are a good source of protein. According to the US Department of Agriculture (USDA), the US consumption of legumes reached 11.7 pounds per person in 2017, up from 8.0 pounds per person in 2017. This number is further expected to rise during the coming years amid the rising prevalence of various lifestyle and deficiency diseases.

Why is India Becoming a Hotspot for Dal Mill Machine Manufacturers?

“Growing Popularity of Mini Dal Milling Machines Boosting sales in India”

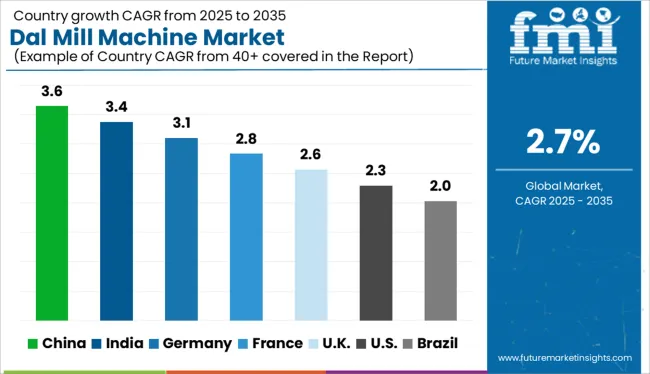
As per FMI, India is expected to remain one of the lucrative markets for dal mill machines during the forecast period owing to the burgeoning production and consumption of pulses, increasing prevalence of malnourishment, and growing adoption of mini dal milling machines across households.

Similarly, an increasing number of start-ups offering food processing equipment like mini dal milling machines and favorable government support will boost the market for dal mill machines in India during the projection period.

There are many opportunities for those who want to start a dal mill machine business in India. The country is home to a large number of consumers who appreciate the benefits of this nutritious pulse. Dal is a staple food in many homes and is often used in curries, stews, and other dishes.

India has a large population of undernourished people who suffer from calorie, protein, and micronutrient deficiency. In order to tackle this burden, people are consuming large amounts of nutritional food products like pulses. This is creating a conducive environment for the growth of the dal mill machine market in the country and the trend is likely to continue during the forecast period.

Why is China Emerging as a High-Potential Dal Mill Machine Market?

“Rising Export of Food Processing Equipment Boosting Market in China”

According to FMI, demand for dal mill machines across China is poised to grow at a significant pace during the forecast period of 2023 to 2033. This can be attributed to the increasing usage of lentils, availability of cheaper products, and rising export of food processing machines.

Dal mill machines are used to process various types of lentils and beans in order to make dal, a popular dish in many parts of China. While dal has traditionally been made in homes, there is a growing demand for commercially-prepared dal, especially in urban areas. This has facilitated the expansion of dal mill machines across the country.

China is one of the world's leading manufacturers of food processing equipment, and Chinese companies have been quick to seize on the opportunity to produce dal mill machines. They are introducing various types of dal mill machines at affordable rates to increase their sales. This will bode well for the market during the forecast period.

Category-wise Insights

Why is Demand for Mini Dal Milling Machine Rising in the Market?

“Easy to Use Nature of Mini Dal Mill Machines Making Them Highly Popular”

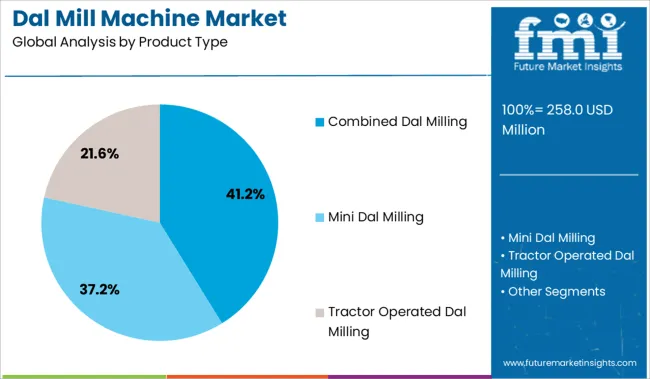
As per FMI, the mini dal milling segment is expected to generate significant revenues in the global dal mill machine market in 2023 & beyond. This can be attributed to the rising adoption of mini dal milling machines across residential and commercial sectors due to their low cost and easy-to-use nature.

Mini dal milling machines are especially becoming popular across countries like India and China where people consume large amounts of lentils daily. These machines are compact and user-friendly and can be easily installed in residential kitchens.

Will Automated Dal Mill Machine Sales Outpace its Counterpart?

“Attractive Features of Automated Machines to Encourage Their Adoption”

based on the mode of operation, the global dal mill machine market is segmented into semi-automated and automated. Among these, the automated segment is likely to grow at a higher CAGR during the forecast period. This can be attributed to the rising end-user preference for automated dal mill machines due to their various attractive features.

Automated dal mill machines work faster, reduce labor requirements, minimize chances of error, and significantly improve overall productivity. With the rapid penetration of automation and digitalization, demand for automated dal mill machines will further surge during the projection period, generating lucrative revenues.
Get the data you need at a Fraction of the cost

Personalize your report by choosing insights you need
and save 40%!

Competitive Landscape

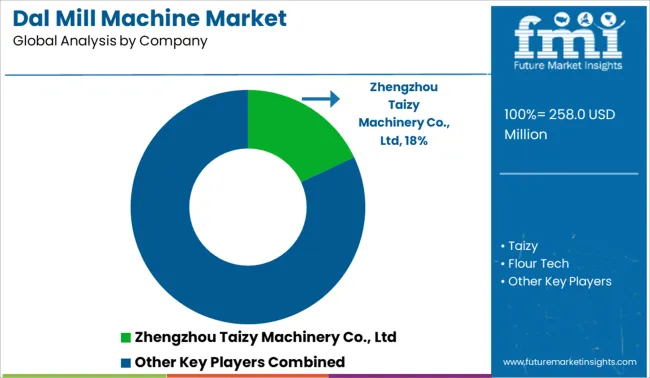
Key providers of dal mill machines include Zhengzhou Taizy Machinery Co., Ltd, HiTech Taizy, Flour Tech, Rising industries, Mill Master Machinery Private Limited, SATAKE, Alvan Blanch Development Company, Savco Sales, Pushpak, Deccan Farm Equipment.

These players are leveraging strategies such as new product launches, mergers, acquisitions, partnerships, and collaborations to increase their sales and stay relevant in the global space. For instance,

  • In August 2022, Satake announced the opening of a new office in the Middle East region to further accelerate sales growth.

Dal Mill Machine Market Report Scope

Attribute Details
Estimated Market Size (2023) US$ 238.2 Million
Projected Market Size (2033) US$ 310.9 Million
Anticipated Growth Rate (2023 to 2033) 2.7% CAGR
Forecast Period 2023 to 2033
Historical Data Available for 2018 to 2022
Market Analysis US$ Million for Value and Units for Volume
Key Regions Covered
  • North America
  • Latin America
  • Europe
  • Asia Pacific
  • Oceania
  • Middle East & Africa (MEA)
Key Countries Covered
  • The USA
  • Canada
  • Mexico
  • Germany
  • The UK
  • France
  • Italy
  • Spain
  • China
  • Japan
  • India
  • South Korea
  • Australia
  • Brazil
  • Argentina
  • South Africa
  • UAE
Key Segments Covered
  • Product Type
  • Mode of Operation
  • Motor power
  • Application
  • Region
Key Companies Profiled
  • Zhengzhou Taizy Machinery Co., Ltd
  • Taizy
  • HiTech
  • Rising industries
  • Mill Master Machinery Private Limited
  • SATAKE
  • Deccan Farm Equipments
  • Alvan Blanch Development Company
  • Savco Sales
  • Puspak
Report Coverage Market Forecast, Company Share Analysis, Competitive Landscape, DROT Analysis, Market Dynamics and Challenges, and Strategic Growth Initiatives

Dal Mill Machine Market by Category

By Product Type:

  • Mini Dal Milling
  • Tractor Operated Dal Milling
  • Combined Dal Milling

By Motor Power:

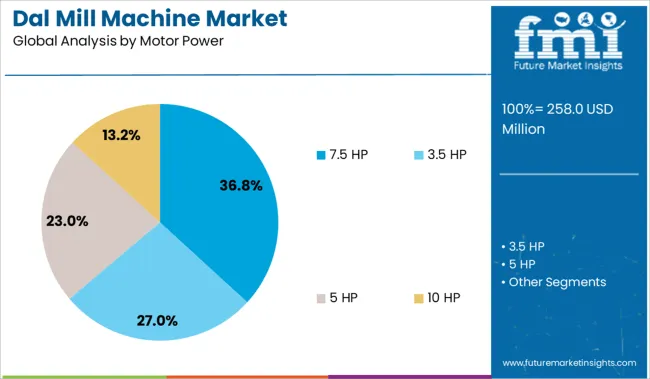
  • 3.5 HP
  • 5 HP
  • 7.5 HP
  • 10 HP

By Application:

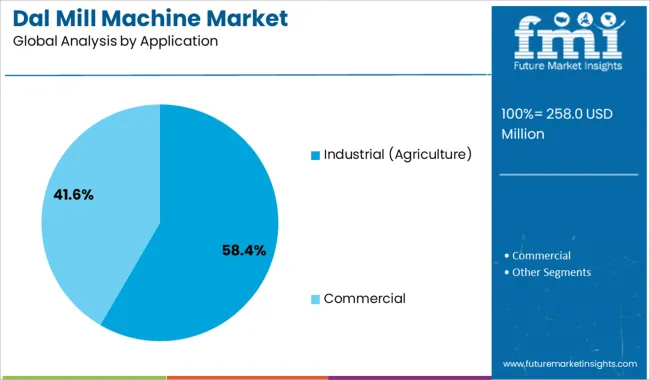
  • Commercial,
  • Industrial (Agriculture)

By Mode of Operation:

  • Semi-Automated
  • Automated

By Region:

  • North America
  • Latin America
  • Europe
  • East Asia
  • South Asia
  • Oceania
  • Middle East & Africa (MEA)

Frequently Asked Questions

How big is the global dal mill machine market?

The global dal mill machine market size is expected to reach US$ 238.2 Million in 2023.

At what rate will the dal mill machine market grow during the forecast period?

As per FMI, the dal mill machine market is expected to grow at a CAGR of 2.7% during the forecast period.

What is the projected valuation for dal mill machine market in 2033?

The global dal mill machine market is anticipated to surpass a valuation of US$ 310.9 Million by 2033.

Which are the major countries driving demand for dal mill machines?

The US, China, Canada, Germany, and Mexico are the major countries driving demand for dal mill machines.

At what rate will the China dal mill machine market grow?

The market for dal mill machines in China is projected to grow at 5.7% CAGR through 2033.

How will market fare in the UK?

The UK dal mill machine market is projected to grow at a CAGR of 5.3% between 2023 and 2033.

At what rate will the India dal mill machine market grow over the forecast period?

The India dal mill machine market is projected to grow at a robust CAGR of 6.3% during the assessment period.

What is the demand outlook for the Australia dal mill machine market?

Demand for dal mill machines in Australia is expected to grow at 2.7% in 2023 & beyond.

Table of Content
1. Executive Summary | Dal Mill Machine Market

    1.1. Global Market Outlook

    1.2. Demand-side Trends

    1.3. Supply-side Trends

    1.4. Technology Roadmap Analysis

    1.5. Analysis and Recommendations

2. Market Overview

    2.1. Market Coverage / Taxonomy

    2.2. Market Definition / Scope / Limitations

3. Market Background

    3.1. Market Dynamics

        3.1.1. Drivers

        3.1.2. Restraints

        3.1.3. Opportunity

        3.1.4. Trends

    3.2. Scenario Forecast

        3.2.1. Demand in Optimistic Scenario

        3.2.2. Demand in Likely Scenario

        3.2.3. Demand in Conservative Scenario

    3.3. Product launches & Recent Developments

    3.4. Product Life Cycle Analysis

    3.5. Value Chain Analysis

        3.5.1. Supply Side Participants and their Roles

            3.5.1.1. Producers

            3.5.1.2. Mid-Level Participants (Traders / Agents / Brokers)

            3.5.1.3. Wholesalers and Distributors

        3.5.2. % of Operating Margin Analysis

        3.5.3. List of Raw Material Suppliers

        3.5.4. List of Existing and Potential Buyers

    3.6. Global Market - Pricing Analysis

        3.6.1. PDal Point Assessment by Region

        3.6.2. PDal Point Assessment by Product Type

        3.6.3. PDal Forecast till 2033

        3.6.4. Factors affecting pricing

    3.7. Forecast Factors - Relevance & Impact

    3.8. PESTLE and Porter’s Analysis

    3.9. Regulatory Landscape

        3.9.1. Packaging & Labelling Regulations

        3.9.2. Certifications and Certifying Agency Overview

        3.9.3. Import/Export Policies

    3.10. Regional Parent Market Outlook

    3.11. Production and Consumption Statistics

    3.12. Import and Export Statistics

    3.13. Consumers Survey Analysis

    3.14. Macro-Economic Factors

    3.15. Product Claims & Nutritional Information scanned by Buyers

4. Global Analysis 2018 to 2022 and Forecast, 2023 to 2033

    4.1. Historical Market Size Value (US$ Million) & Volume (MT) Analysis, 2018 to 2022

    4.2. Current and Future Market Size Value (US$ Million) & Volume (MT) Projections, 2023 to 2033

        4.2.1. Y-o-Y Growth Trend Analysis

        4.2.2. Absolute $ Opportunity Analysis

5. Global Analysis 2018 to 2022 and Forecast 2023 to 2033, By Product Type

    5.1. Introduction / Key Findings

    5.2. Historical Market Size Value (US$ Million) & Volume (MT) Analysis By Product Type, 2018 to 2022

    5.3. Current and Future Market Size Value (US$ Million) & Volume (MT) Analysis and Forecast By Product Type, 2023 to 2033

        5.3.1. Mini Dal Milling

        5.3.2. Tractor Operated Dal Milling

        5.3.3. Combined Dal Milling

    5.4. Y-o-Y Growth Trend Analysis By Product Type, 2018 to 2022

    5.5. Absolute $ Opportunity Analysis By Product Type, 2023 to 2033

6. Global Analysis 2018 to 2022 and Forecast 2023 to 2033, By Application

    6.1. Introduction / Key Findings

    6.2. Historical Market Size Value (US$ Million) & Volume (MT) Analysis By Application, 2018 to 2022

    6.3. Current and Future Market Size Value (US$ Million) & Volume (MT) Analysis and Forecast By Application, 2023 to 2033

        6.3.1. Commercial

        6.3.2. Industrial (Agriculture)

    6.4. Y-o-Y Growth Trend Analysis By Application, 2018 to 2022

    6.5. Absolute $ Opportunity Analysis By Application, 2023 to 2033

7. Global Analysis 2018 to 2022 and Forecast 2023 to 2033, By Mode of Operation

    7.1. Introduction / Key Findings

    7.2. Historical Market Size Value (US$ Million) & Volume (MT) Analysis By Mode of operation, 2018 to 2022

    7.3. Current and Future Market Size Value (US$ Million) & Volume (MT) Analysis and Forecast By Mode of operation, 2023 to 2033

        7.3.1. Semi-Automated

        7.3.2. Automated

    7.4. Y-o-Y Growth Trend Analysis By Mode of operation, 2018 to 2022

    7.5. Absolute $ Opportunity Analysis By Mode of operation, 2023 to 2033

8. Global Analysis 2018 to 2022 and Forecast 2023 to 2033, By Motor Power

    8.1. Introduction / Key Findings

    8.2. Historical Market Size Value (US$ Million) & Volume (MT) Analysis By Motor Power, 2018 to 2022

    8.3. Current and Future Market Size Value (US$ Million) & Volume (MT) Analysis and Forecast By Motor Power, 2023 to 2033

        8.3.1. 3.5 HP

        8.3.2. 5 HP

        8.3.3. 7.5HP

        8.3.4. 10HP

    8.4. Y-o-Y Growth Trend Analysis By Motor Power, 2018 to 2022

    8.5. Absolute $ Opportunity Analysis By Motor Power, 2023 to 2033

9. Global Analysis 2018 to 2022 and Forecast 2023 to 2033, By Region

    9.1. Introduction

    9.2. Historical Market Size Value (US$ Million) & Volume (MT) Analysis By Region, 2018 to 2022

    9.3. Current Market Size Value (US$ Million) & Volume (MT) Analysis and Forecast By Region, 2023 to 2033

        9.3.1. North America

        9.3.2. Latin America

        9.3.3. Europe

        9.3.4. East Asia

        9.3.5. South Asia

        9.3.6. Oceania

        9.3.7. Middle East & Africa (MEA)

    9.4. Market Attractiveness Analysis By Region

10. North America Analysis 2018 to 2022 and Forecast 2023 to 2033, By Country

    10.1. Historical Market Size Value (US$ Million) & Volume (MT) Trend Analysis By Market Taxonomy, 2018 to 2022

    10.2. Market Size Value (US$ Million) & Volume (MT) Forecast By Market Taxonomy, 2023 to 2033

        10.2.1. By Country

            10.2.1.1. The US

            10.2.1.2. Canada

        10.2.2. By Product Type

        10.2.3. By Application

        10.2.4. By Mode of operation

        10.2.5. By Motor Power

    10.3. Market Attractiveness Analysis

        10.3.1. By Country

        10.3.2. By Product Type

        10.3.3. By Application

        10.3.4. By Mode of operation

        10.3.5. By Motor Power

    10.4. Key Takeaways

11. Latin America Analysis 2018 to 2022 and Forecast 2023 to 2033, By Country

    11.1. Historical Market Size Value (US$ Million) & Volume (MT) Trend Analysis By Market Taxonomy, 2018 to 2022

    11.2. Market Size Value (US$ Million) & Volume (MT) Forecast By Market Taxonomy, 2023 to 2033

        11.2.1. By Country

            11.2.1.1. Brazil

            11.2.1.2. Mexico

            11.2.1.3. Argentina

            11.2.1.4. Chile

            11.2.1.5. Peru

            11.2.1.6. Rest of Latin America

        11.2.2. By Product Type

        11.2.3. By Application

        11.2.4. By Mode of operation

        11.2.5. By Motor Power

    11.3. Market Attractiveness Analysis

        11.3.1. By Country

        11.3.2. By Product Type

        11.3.3. By Application

        11.3.4. By Mode of operation

        11.3.5. By Motor Power

    11.4. Key Takeaways

12. Europe Analysis 2018 to 2022 and Forecast 2023 to 2033, By Country

    12.1. Historical Market Size Value (US$ Million) & Volume (MT) Trend Analysis By Market Taxonomy, 2018 to 2022

    12.2. Market Size Value (US$ Million) & Volume (MT) Forecast By Market Taxonomy, 2023 to 2033

        12.2.1. By Country

            12.2.1.1. Germany

            12.2.1.2. Italy

            12.2.1.3. France

            12.2.1.4. The UK

            12.2.1.5. Spain

            12.2.1.6. Russia

            12.2.1.7. BENELUX

            12.2.1.8. Poland

            12.2.1.9. Nordic Countries

            12.2.1.10. Rest of Europe

        12.2.2. By Product Type

        12.2.3. By Application

        12.2.4. By Mode of operation

        12.2.5. By Motor Power

    12.3. Market Attractiveness Analysis

        12.3.1. By Country

        12.3.2. By Product Type

        12.3.3. By Application

        12.3.4. By Mode of operation

        12.3.5. By Motor Power

    12.4. Key Takeaways

13. East Asia Analysis 2018 to 2022 and Forecast 2023 to 2033, By Country

    13.1. Historical Market Size Value (US$ Million) & Volume (MT) Trend Analysis By Market Taxonomy, 2018 to 2022

    13.2. Market Size Value (US$ Million) & Volume (MT) Forecast By Market Taxonomy, 2023 to 2033

        13.2.1. By Country

            13.2.1.1. China

            13.2.1.2. Japan

            13.2.1.3. South Korea

        13.2.2. By Product Type

        13.2.3. By Application

        13.2.4. By Mode of operation

        13.2.5. By Motor Power

    13.3. Market Attractiveness Analysis

        13.3.1. By Country

        13.3.2. By Product Type

        13.3.3. By Application

        13.3.4. By Mode of operation

        13.3.5. By Motor Power

    13.4. Key Takeaways

14. South Asia Analysis 2018 to 2022 and Forecast 2023 to 2033, By Country

    14.1. Historical Market Size Value (US$ Million) & Volume (MT) Trend Analysis By Market Taxonomy, 2018 to 2022

    14.2. Market Size Value (US$ Million) & Volume (MT) Forecast By Market Taxonomy, 2023 to 2033

        14.2.1. By Country

            14.2.1.1. India

            14.2.1.2. Thailand

            14.2.1.3. Malaysia

            14.2.1.4. Indonesia

            14.2.1.5. Singapore

            14.2.1.6. Rest of South Asia

        14.2.2. By Product Type

        14.2.3. By Application

        14.2.4. By Mode of operation

        14.2.5. By Motor Power

    14.3. Market Attractiveness Analysis

        14.3.1. By Country

        14.3.2. By Product Type

        14.3.3. By Application

        14.3.4. By Mode of operation

        14.3.5. By Motor Power

    14.4. Key Takeaways

15. Oceania Analysis 2018 to 2022 and Forecast 2023 to 2033, By Country

    15.1. Historical Market Size Value (US$ Million) & Volume (MT) Trend Analysis By Market Taxonomy, 2018 to 2022

    15.2. Market Size Value (US$ Million) & Volume (MT) Forecast By Market Taxonomy, 2023 to 2033

        15.2.1. By Country

            15.2.1.1. Australia

            15.2.1.2. New Zealand

        15.2.2. By Product Type

        15.2.3. By Application

        15.2.4. By Mode of operation

        15.2.5. By Motor Power

    15.3. Market Attractiveness Analysis

        15.3.1. By Country

        15.3.2. By Product Type

        15.3.3. By Application

        15.3.4. By Mode of operation

        15.3.5. By Motor Power

    15.4. Key Takeaways

16. MEA Analysis 2018 to 2022 and Forecast 2023 to 2033, By Country

    16.1. Historical Market Size Value (US$ Million) & Volume (MT) Trend Analysis By Market Taxonomy, 2018 to 2022

    16.2. Market Size Value (US$ Million) & Volume (MT) Forecast By Market Taxonomy, 2023 to 2033

        16.2.1. By Country

            16.2.1.1. GCC Countries

            16.2.1.2. South Africa

            16.2.1.3. Central Africa

            16.2.1.4. North Africa

        16.2.2. By Product Type

        16.2.3. By Application

        16.2.4. By Mode of operation

        16.2.5. By Motor Power

    16.3. Market Attractiveness Analysis

        16.3.1. By Country

        16.3.2. By Product Type

        16.3.3. By Application

        16.3.4. By Mode of operation

        16.3.5. By Motor Power

    16.4. Key Takeaways

17. Key Countries Analysis

    17.1. The US

        17.1.1. Pricing Analysis

        17.1.2. Market Share Analysis, 2023

            17.1.2.1. By Product Type

            17.1.2.2. By Application

            17.1.2.3. By Mode of operation

            17.1.2.4. By Motor Power

    17.2. Canada

        17.2.1. Pricing Analysis

        17.2.2. Market Share Analysis, 2023

            17.2.2.1. By Product Type

            17.2.2.2. By Application

            17.2.2.3. By Mode of operation

            17.2.2.4. By Motor Power

    17.3. Brazil

        17.3.1. Pricing Analysis

        17.3.2. Market Share Analysis, 2023

            17.3.2.1. By Product Type

            17.3.2.2. By Application

            17.3.2.3. By Mode of operation

            17.3.2.4. By Motor Power

    17.4. Mexico

        17.4.1. Pricing Analysis

        17.4.2. Market Share Analysis, 2023

            17.4.2.1. By Product Type

            17.4.2.2. By Application

            17.4.2.3. By Mode of operation

            17.4.2.4. By Motor Power

    17.5. Argentina

        17.5.1. Pricing Analysis

        17.5.2. Market Share Analysis, 2023

            17.5.2.1. By Product Type

            17.5.2.2. By Application

            17.5.2.3. By Mode of operation

            17.5.2.4. By Motor Power

    17.6. Chile

        17.6.1. Pricing Analysis

        17.6.2. Market Share Analysis, 2023

            17.6.2.1. By Product Type

            17.6.2.2. By Application

            17.6.2.3. By Mode of operation

            17.6.2.4. By Motor Power

    17.7. Peru

        17.7.1. Pricing Analysis

        17.7.2. Market Share Analysis, 2023

            17.7.2.1. By Product Type

            17.7.2.2. By Application

            17.7.2.3. By Mode of operation

            17.7.2.4. By Motor Power

    17.8. Germany

        17.8.1. Pricing Analysis

        17.8.2. Market Share Analysis, 2023

            17.8.2.1. By Product Type

            17.8.2.2. By Application

            17.8.2.3. By Mode of operation

            17.8.2.4. By Motor Power

    17.9. Italy

        17.9.1. Pricing Analysis

        17.9.2. Market Share Analysis, 2023

            17.9.2.1. By Product Type

            17.9.2.2. By Application

            17.9.2.3. By Mode of operation

            17.9.2.4. By Motor Power

    17.10. France

        17.10.1. Pricing Analysis

        17.10.2. Market Share Analysis, 2023

            17.10.2.1. By Product Type

            17.10.2.2. By Application

            17.10.2.3. By Mode of operation

            17.10.2.4. By Motor Power

    17.11. Spain

        17.11.1. Pricing Analysis

        17.11.2. Market Share Analysis, 2023

            17.11.2.1. By Product Type

            17.11.2.2. By Application

            17.11.2.3. By Mode of operation

            17.11.2.4. By Motor Power

    17.12. The UK

        17.12.1. Pricing Analysis

        17.12.2. Market Share Analysis, 2023

            17.12.2.1. By Product Type

            17.12.2.2. By Application

            17.12.2.3. By Mode of operation

            17.12.2.4. By Motor Power

    17.13. Russia

        17.13.1. Pricing Analysis

        17.13.2. Market Share Analysis, 2023

            17.13.2.1. By Product Type

            17.13.2.2. By Application

            17.13.2.3. By Mode of operation

            17.13.2.4. By Motor Power

    17.14. Poland

        17.14.1. Pricing Analysis

        17.14.2. Market Share Analysis, 2023

            17.14.2.1. By Product Type

            17.14.2.2. By Application

            17.14.2.3. By Mode of operation

            17.14.2.4. By Motor Power

    17.15. BENELUX

        17.15.1. Pricing Analysis

        17.15.2. Market Share Analysis, 2023

            17.15.2.1. By Product Type

            17.15.2.2. By Application

            17.15.2.3. By Mode of operation

            17.15.2.4. By Motor Power

    17.16. Nordic Countries

        17.16.1. Pricing Analysis

        17.16.2. Market Share Analysis, 2023

            17.16.2.1. By Product Type

            17.16.2.2. By Application

            17.16.2.3. By Mode of operation

            17.16.2.4. By Motor Power

    17.17. China

        17.17.1. Pricing Analysis

        17.17.2. Market Share Analysis, 2023

            17.17.2.1. By Product Type

            17.17.2.2. By Application

            17.17.2.3. By Mode of operation

            17.17.2.4. By Motor Power

    17.18. Japan

        17.18.1. Pricing Analysis

        17.18.2. Market Share Analysis, 2023

            17.18.2.1. By Product Type

            17.18.2.2. By Application

            17.18.2.3. By Mode of operation

            17.18.2.4. By Motor Power

    17.19. South Korea

        17.19.1. Pricing Analysis

        17.19.2. Market Share Analysis, 2023

            17.19.2.1. By Product Type

            17.19.2.2. By Application

            17.19.2.3. By Mode of operation

            17.19.2.4. By Motor Power

    17.20. India

        17.20.1. Pricing Analysis

        17.20.2. Market Share Analysis, 2023

            17.20.2.1. By Product Type

            17.20.2.2. By Application

            17.20.2.3. By Mode of operation

            17.20.2.4. By Motor Power

    17.21. Thailand

        17.21.1. Pricing Analysis

        17.21.2. Market Share Analysis, 2023

            17.21.2.1. By Product Type

            17.21.2.2. By Application

            17.21.2.3. By Mode of operation

            17.21.2.4. By Motor Power

    17.22. Indonesia

        17.22.1. Pricing Analysis

        17.22.2. Market Share Analysis, 2023

            17.22.2.1. By Product Type

            17.22.2.2. By Application

            17.22.2.3. By Mode of operation

            17.22.2.4. By Motor Power

    17.23. Malaysia

        17.23.1. Pricing Analysis

        17.23.2. Market Share Analysis, 2023

            17.23.2.1. By Product Type

            17.23.2.2. By Application

            17.23.2.3. By Mode of operation

            17.23.2.4. By Motor Power

    17.24. Singapore

        17.24.1. Pricing Analysis

        17.24.2. Market Share Analysis, 2023

            17.24.2.1. By Product Type

            17.24.2.2. By Application

            17.24.2.3. By Mode of operation

            17.24.2.4. By Motor Power

    17.25. Australia

        17.25.1. Pricing Analysis

        17.25.2. Market Share Analysis, 2023

            17.25.2.1. By Product Type

            17.25.2.2. By Application

            17.25.2.3. By Mode of operation

            17.25.2.4. By Motor Power

    17.26. New Zealand

        17.26.1. Pricing Analysis

        17.26.2. Market Share Analysis, 2023

            17.26.2.1. By Product Type

            17.26.2.2. By Application

            17.26.2.3. By Mode of operation

            17.26.2.4. By Motor Power

    17.27. GCC Countries

        17.27.1. Pricing Analysis

        17.27.2. Market Share Analysis, 2023

            17.27.2.1. By Product Type

            17.27.2.2. By Application

            17.27.2.3. By Mode of operation

            17.27.2.4. By Motor Power

    17.28. South Africa

        17.28.1. Pricing Analysis

        17.28.2. Market Share Analysis, 2023

            17.28.2.1. By Product Type

            17.28.2.2. By Application

            17.28.2.3. By Mode of operation

            17.28.2.4. By Motor Power

    17.29. North Africa

        17.29.1. Pricing Analysis

        17.29.2. Market Share Analysis, 2023

            17.29.2.1. By Product Type

            17.29.2.2. By Application

            17.29.2.3. By Mode of operation

            17.29.2.4. By Motor Power

    17.30. Central Africa

        17.30.1. Pricing Analysis

        17.30.2. Market Share Analysis, 2023

            17.30.2.1. By Product Type

            17.30.2.2. By Application

            17.30.2.3. By Mode of operation

            17.30.2.4. By Motor Power

18. Market Structure Analysis

    18.1. Competition Dashboard

    18.2. Competition Benchmarking

    18.3. Market Share Analysis of Top Players

        18.3.1. By Regional

        18.3.2. By Product Type

        18.3.3. By Application

        18.3.4. By Mode of operation

        18.3.5. By Motor Power

19. Competition Analysis

    19.1. Competition Deep Dive

        19.1.1. Zhengzhou Taizy Machinery Co.,Ltd

            19.1.1.1. Overview

            19.1.1.2. Product Portfolio

            19.1.1.3. Profitability by Market Segments (Product / Age / Sales Channel / Region)

            19.1.1.4. Sales Footprint

            19.1.1.5. Strategy Overview

                19.1.1.5.1. Marketing Strategy

                19.1.1.5.2. Product Strategy

                19.1.1.5.3. Channel Strategy

        19.1.2. Taizy

            19.1.2.1. Overview

            19.1.2.2. Product Portfolio

            19.1.2.3. Profitability by Market Segments (Product / Age / Sales Channel / Region)

            19.1.2.4. Sales Footprint

            19.1.2.5. Strategy Overview

                19.1.2.5.1. Marketing Strategy

                19.1.2.5.2. Product Strategy

                19.1.2.5.3. Channel Strategy

        19.1.3. Flour Tech

            19.1.3.1. Overview

            19.1.3.2. Product Portfolio

            19.1.3.3. Profitability by Market Segments (Product / Age / Sales Channel / Region)

            19.1.3.4. Sales Footprint

            19.1.3.5. Strategy Overview

                19.1.3.5.1. Marketing Strategy

                19.1.3.5.2. Product Strategy

                19.1.3.5.3. Channel Strategy

        19.1.4. Rising industries

            19.1.4.1. Overview

            19.1.4.2. Product Portfolio

            19.1.4.3. Profitability by Market Segments (Product / Age / Sales Channel / Region)

            19.1.4.4. Sales Footprint

            19.1.4.5. Strategy Overview

                19.1.4.5.1. Marketing Strategy

                19.1.4.5.2. Product Strategy

                19.1.4.5.3. Channel Strategy

        19.1.5. Mill Master Machinery Private Limited

            19.1.5.1. Overview

            19.1.5.2. Product Portfolio

            19.1.5.3. Profitability by Market Segments (Product / Age / Sales Channel / Region)

            19.1.5.4. Sales Footprint

            19.1.5.5. Strategy Overview

                19.1.5.5.1. Marketing Strategy

                19.1.5.5.2. Product Strategy

                19.1.5.5.3. Channel Strategy

        19.1.6. SATAKE

            19.1.6.1. Overview

            19.1.6.2. Product Portfolio

            19.1.6.3. Profitability by Market Segments (Product / Age / Sales Channel / Region)

            19.1.6.4. Sales Footprint

            19.1.6.5. Strategy Overview

                19.1.6.5.1. Marketing Strategy

                19.1.6.5.2. Product Strategy

                19.1.6.5.3. Channel Strategy

        19.1.7. Alvan Blanch Development Company

            19.1.7.1. Overview

            19.1.7.2. Product Portfolio

            19.1.7.3. Profitability by Market Segments (Product / Age / Sales Channel / Region)

            19.1.7.4. Sales Footprint

            19.1.7.5. Strategy Overview

                19.1.7.5.1. Marketing Strategy

                19.1.7.5.2. Product Strategy

                19.1.7.5.3. Channel Strategy

        19.1.8. Savco Sales

            19.1.8.1. Overview

            19.1.8.2. Product Portfolio

            19.1.8.3. Profitability by Market Segments (Product / Age / Sales Channel / Region)

            19.1.8.4. Sales Footprint

            19.1.8.5. Strategy Overview

                19.1.8.5.1. Marketing Strategy

                19.1.8.5.2. Product Strategy

                19.1.8.5.3. Channel Strategy

20. Assumptions & Acronyms Used

21. Research Methodology

Explore Process Automation Insights

View Reports