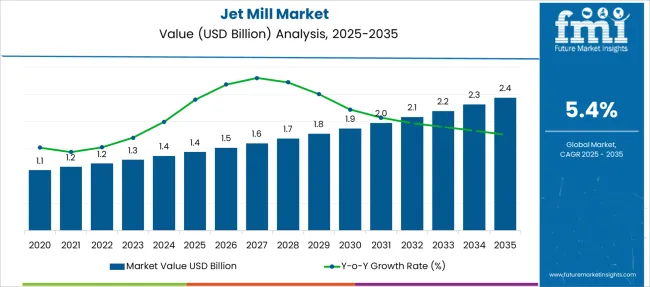
The worldwide jet mill market reached a valuation of USD 1,230.8 Million in 2022 and it is likely to register a year-on-year (Y-o-Y) growth rate of 5.3% in 2023. The market valuation of jet mills worldwide is slated to grow from USD 1,297.3 Million in 2023 to USD 2,195.1 million at the end of 2033. Furthermore, overall jet mill sales are slated to surge at 5.4% CAGR over the projection period (2023 to 2033).
The term "jet mill" describes a piece of pulverizing machinery used to grind and reduce particles to extremely small sizes. It is used to reduce the particle size of brittle and friable substances like polymers, pharmaceuticals, organic and inorganic pigments, synthetic dyes, alumina, and agrochemicals. High pressure, compressed air, gas, or steam are used in jet mills to create a high-speed collision between the material's particles.
They are frequently used for mixing fine particles and come in spiral and fluidized bed varieties. Jet mills have become ideal tools for milling or micronizing a wide range of products. They offer numerous advantages, including producing very small particle sizes, easy component cleaning, and little to no moving mechanical parts.
Growing usage of jet mills in a variety of industries, including agriculture, chemistry, pharmaceuticals, and food & beverage is a key factor expected to drive the global jet mill industry during the assessment period.
Similarly, the robust growth of pharmaceutical and biotechnology industries along with increasing spending on medications is likely to generate high demand for jet mills during the forecast period. Jet mills are being extensively used during the manufacturing of a variety of pharmaceuticals and pigments.
Jet mills are being used for micronizing drugs to enhance their bioavailability and efficacy. They have become ideal milling solutions to reduce the particle size of numerous drugs which aids ineffective delivery.
Increasing demand for premium cosmetic and skin care products across the world is another factor expected to fuel jet mill sales during the assessment period. Furthermore, widening applications in the food and beverage and mineral industries will bode well for the market.
Attributes | Key Insights |
---|---|
Jet Mill Market Estimated Value (2023) | USD 1,297.3 Million |
Projected Market Value (2033) | USD 2,195.1 Million |
Value-based CAGR (2023 to 2033) | 5.4% |
USA market share of Jet Mill | 32.1% |
As per FMI, the worldwide market for jet mills expanded from USD 1,001.1 Million in 2018 to USD 1,230.8 Million in 2022. The market observed a CAGR of 5.3% during the historical period (2018 to 2022).
However, with a growing end-user preference for jet mills over other traditional grinding solutions, the overall jet mill demand is slated to grow at 5.4% CAGR throughout the assessment period (2023 to 2033).
One of the main reasons influencing the market's expansion is the rising demand for high-end skin care and cosmetic goods among the general public. To give cosmetic items a fine and smooth texture, manufacturers of products crush crystalline and thermal ingredients in jet mills.
Similarly, the pharmaceutical sector's widespread product usage is boosting the market's expansion. To increase the potency and bioavailability of pharmaceutical components, jet mills are often employed for processing pigments and micronizing pharmaceuticals. Accordingly, the market is expanding due to the growing use of fluidized bed jet mills for the vertical and cylindrical milling of hard materials.
Several key factors have been identified by FMI that is likely to aid in the expansion of the global market for jet mills during the assessment period (2023 to 2033). Further, FMI analysts have also analyzed the restraining elements, upcoming threats, and lucrative opportunities that can somehow influence the sales of jet mills.
The drivers, restraints, opportunities, and threats (DROTs) identified are as follows:
DRIVERS
RESTRAINTS
OPPORTUNITIES
THREATS
The usage of alternative milling technologies may hamper the growth in the global market.
Booming Pharmaceutical Industry Propelling Jet Mill Demand in the USA
The jet mill industry in North America is developing rapidly with the US leading at the forefront. This is attributed to the rapid growth of the pharmaceutical industry, advancements in nanotechnology, and the growing adoption of highly efficient grinding technologies.
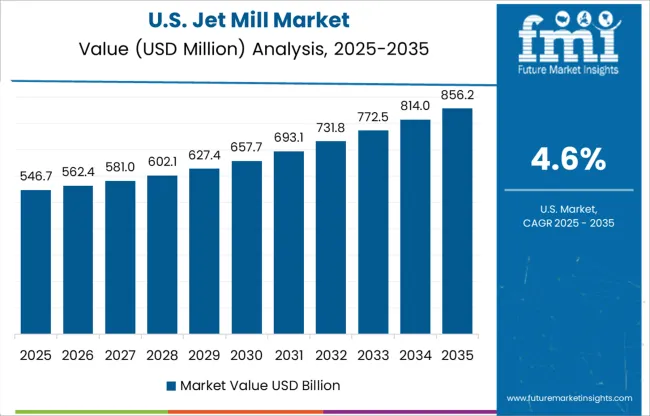
As per FMI, the worldwide jet mill market receives 32.1% of its total income from the United States. The country’s thriving pharmaceutical industry plays a key role in driving demand for jet mills.
Similarly, the number of companies manufacturing and selling jet mills is increasing every year. The competition among these companies is also increasing. This is leading to a decrease in the prices of jet mills.
The quality of jet mills is also improving. The new models are more efficient and have better performance than the older ones. This is attracting more customers to buy jet mills, which in turn will eventually fuel jet mill sales in the US during the forecast period.
Rising End User Preference Towards Better Grinding Technologies Boosting Market in Europe
There are several reasons for the growing demand for jet mills in Europe. First, the continent has a large manufacturing base that is constantly looking for ways to improve its competitiveness. Second, jet mills offer several advantages over traditional grinding methods, including higher productivity and lower energy consumption.
Third, European countries like Germany and the UK are increasingly investing in research and development activities related to jet mills. This is resulting in the development of new and improved jet milling technologies that are being commercialized by leading companies in the region.
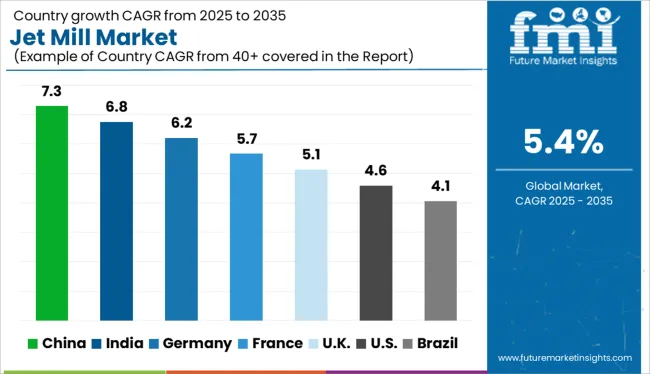
Thanks to these aforementioned factors, Germany holds around 25.1% of the global Jet Mill market, while the UK market is projected to expand at 6.0% CAGR over the projection period.
Rapid Growth of End-Use Industries Fostering Jet Mill Sales Across China and India
The market for jet mills is expanding rapidly in the Asia Pacific. This is due to the increasing demand for jet mills from various industries including chemical, pharmaceuticals, food processing, and cosmetics. Jet mills are also being used increasingly in the manufacturing of nanomaterials.
Asia Pacific is home to some of the world’s largest jet mill manufacturers, such as China, Japan, and South Korea. The market for jet mills is predicted to grow even further in the coming years, due to the increasing demand from countries like China and India. Jet mills are very efficient and provide a high-quality product. They are also easy to operate and maintain.
India and China are the market leaders in the Asia Pacific owing to the rapid expansion of pharmaceutical, chemical, and cosmetics industries in these countries. FMI has predicted CAGRs of 5.9% and 6.1% for the Indian and China markets respectively.
Various Advantages Offered by Fluidized Bed Jet Mills Making Them Highly SoughtAfter Types
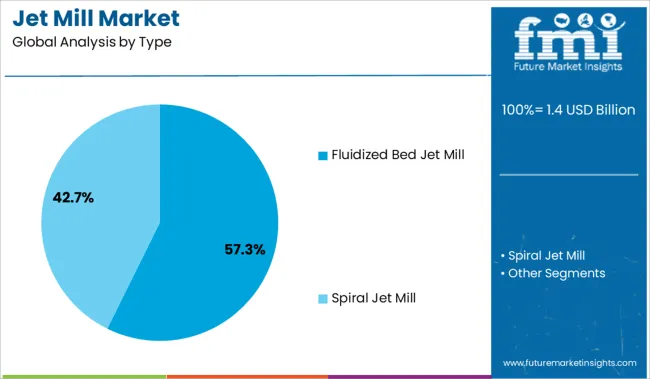
Based on type, demand is expected to remain high for fluidized bed jet mills due to their ability to achieve smaller particle sizes and reduce material loss.
A fluidized bed jet mill is a type of mill that uses a fluidized bed to pulverize material. The material is placed in a chamber and then injected with a gas or air stream. The material is then ground by the force of the fluidized bed.
Fluidized bed jet mills are used for a variety of applications, including the grinding of pharmaceuticals, chemicals, and minerals. They can be used to grind both dry and wet materials. The mills are also capable of grinding materials to very fine particle sizes.
Furthermore, these mills possess features like low energy consumption, less pollution, uniform distribution, etc., making them highly sought-after jet mill types.
Pharmaceutical and Chemical Industries to Generate Maximum Revenues Through 2033
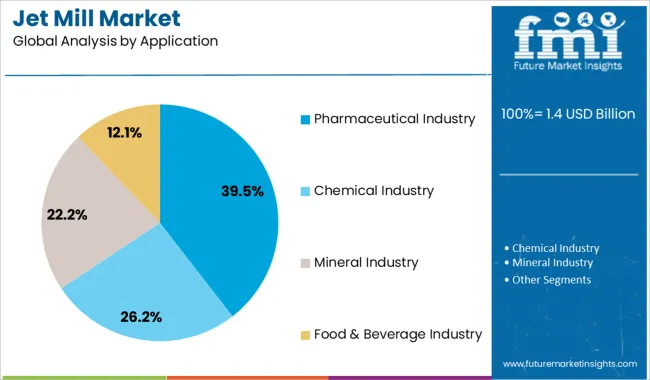
Based on application, the pharmaceutical industry, and chemical industry segments together hold the largest share of the global jet mill industry, and the trend is expected to continue over the projection period. This is attributed to the rising usage of jet mills across these target industries coupled with the growing demand for chemicals and pharmaceuticals worldwide.
Jet mills have been used in the pharmaceutical industry for decades and are increasingly being used in the industry as new drugs are developed. These mills work by using high-pressure air to grind particles down to a size that can be easily inhaled.
The mills can be used to create both dry and wet powders, which makes them versatile for use in different manufacturing processes. Jet mills are also very efficient, meaning that they use less energy and produce less waste than other types of grinding machines.
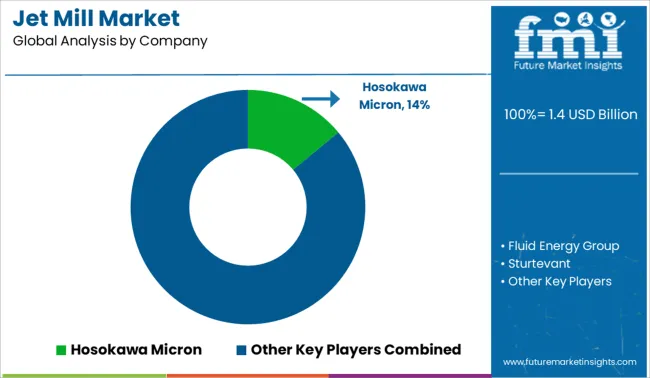
The jet mill market is highly competitive with the presence of several large and small vendors. Key manufacturers of jet mills are focused on expanding their product portfolios and geographical footprints to gain a larger share of the market.
Fluid Energy Group, Hosokawa Micron, Sturtevant, British Rema, and Continental Biomass Industries are some of the leading players in this market space. These companies hold a significant share of the jet mill industry due to their strong product portfolio and brand recognition.
Recent Developments:
Attribute | Details |
---|---|
Estimated Market Size (2023) | USD 1,297.3 Million |
Projected Market Size (2033) | USD 2,195.1 Million |
Anticipated Growth Rate (2023 to 2033) | 5.4% CAGR |
Forecast Period | 2023 to 2033 |
Historical Data Available for | 2018 to 2022 |
Market Analysis | USD Million for Value and Units for Volume |
Key Regions Covered | North America; Europe; Asia Pacific; Latin America; Middle East & Africa (MEA); RoW |
Key Countries Covered | The USA, Canada, Mexico, Germany, The UK, France, Russia, Brazil, Argentina, Japan, Australia, China, India, Indonesia, South Korea |
Key Segments Covered | Type, Capacity, Application, Sales Channel, Region |
Key Companies Profiled | Fluid Energy Group; Midas Microtech Engineering Private Limited; Hosokawa Micron; Sturtevant; British Rema; Continental Biomass Industries; FREUND Corporation; Erich NETZSCH GmbH & Co.; Loesche GmbH; Kunshan Unique Machinery Co. Ltd.; Kurimoto Ltd.; The Jet Pulverizer Co. Inc.; Tecnologia Meccanica; Promas Engineers Private Limited |
Report Coverage | DROT Analysis, Market Forecast, Company Share Analysis, Market Dynamics and Challenges, Competitive Landscape, and Strategic Growth Initiatives |
Table 1: Global Market Value (US$ Million) Forecast by Region, 2018 to 2033
Table 2: Global Market Volume (MT) Forecast by Region, 2018 to 2033
Table 3: Global Market Value (US$ Million) Forecast by Type, 2018 to 2033
Table 4: Global Market Volume (MT) Forecast by Type, 2018 to 2033
Table 5: Global Market Value (US$ Million) Forecast by Capacity, 2018 to 2033
Table 6: Global Market Volume (MT) Forecast by Capacity, 2018 to 2033
Table 7: Global Market Value (US$ Million) Forecast by Application, 2018 to 2033
Table 8: Global Market Volume (MT) Forecast by Application, 2018 to 2033
Table 9: Global Market Value (US$ Million) Forecast by Sales Channel, 2018 to 2033
Table 10: Global Market Volume (MT) Forecast by Sales Channel, 2018 to 2033
Table 11: North America Market Value (US$ Million) Forecast by Country, 2018 to 2033
Table 12: North America Market Volume (MT) Forecast by Country, 2018 to 2033
Table 13: North America Market Value (US$ Million) Forecast by Type, 2018 to 2033
Table 14: North America Market Volume (MT) Forecast by Type, 2018 to 2033
Table 15: North America Market Value (US$ Million) Forecast by Capacity, 2018 to 2033
Table 16: North America Market Volume (MT) Forecast by Capacity, 2018 to 2033
Table 17: North America Market Value (US$ Million) Forecast by Application, 2018 to 2033
Table 18: North America Market Volume (MT) Forecast by Application, 2018 to 2033
Table 19: North America Market Value (US$ Million) Forecast by Sales Channel, 2018 to 2033
Table 20: North America Market Volume (MT) Forecast by Sales Channel, 2018 to 2033
Table 21: Latin America Market Value (US$ Million) Forecast by Country, 2018 to 2033
Table 22: Latin America Market Volume (MT) Forecast by Country, 2018 to 2033
Table 23: Latin America Market Value (US$ Million) Forecast by Type, 2018 to 2033
Table 24: Latin America Market Volume (MT) Forecast by Type, 2018 to 2033
Table 25: Latin America Market Value (US$ Million) Forecast by Capacity, 2018 to 2033
Table 26: Latin America Market Volume (MT) Forecast by Capacity, 2018 to 2033
Table 27: Latin America Market Value (US$ Million) Forecast by Application, 2018 to 2033
Table 28: Latin America Market Volume (MT) Forecast by Application, 2018 to 2033
Table 29: Latin America Market Value (US$ Million) Forecast by Sales Channel, 2018 to 2033
Table 30: Latin America Market Volume (MT) Forecast by Sales Channel, 2018 to 2033
Table 31: Europe Market Value (US$ Million) Forecast by Country, 2018 to 2033
Table 32: Europe Market Volume (MT) Forecast by Country, 2018 to 2033
Table 33: Europe Market Value (US$ Million) Forecast by Type, 2018 to 2033
Table 34: Europe Market Volume (MT) Forecast by Type, 2018 to 2033
Table 35: Europe Market Value (US$ Million) Forecast by Capacity, 2018 to 2033
Table 36: Europe Market Volume (MT) Forecast by Capacity, 2018 to 2033
Table 37: Europe Market Value (US$ Million) Forecast by Application, 2018 to 2033
Table 38: Europe Market Volume (MT) Forecast by Application, 2018 to 2033
Table 39: Europe Market Value (US$ Million) Forecast by Sales Channel, 2018 to 2033
Table 40: Europe Market Volume (MT) Forecast by Sales Channel, 2018 to 2033
Table 41: East Asia Market Value (US$ Million) Forecast by Country, 2018 to 2033
Table 42: East Asia Market Volume (MT) Forecast by Country, 2018 to 2033
Table 43: East Asia Market Value (US$ Million) Forecast by Type, 2018 to 2033
Table 44: East Asia Market Volume (MT) Forecast by Type, 2018 to 2033
Table 45: East Asia Market Value (US$ Million) Forecast by Capacity, 2018 to 2033
Table 46: East Asia Market Volume (MT) Forecast by Capacity, 2018 to 2033
Table 47: East Asia Market Value (US$ Million) Forecast by Application, 2018 to 2033
Table 48: East Asia Market Volume (MT) Forecast by Application, 2018 to 2033
Table 49: East Asia Market Value (US$ Million) Forecast by Sales Channel, 2018 to 2033
Table 50: East Asia Market Volume (MT) Forecast by Sales Channel, 2018 to 2033
Table 51: South Asia Market Value (US$ Million) Forecast by Country, 2018 to 2033
Table 52: South Asia Market Volume (MT) Forecast by Country, 2018 to 2033
Table 53: South Asia Market Value (US$ Million) Forecast by Type, 2018 to 2033
Table 54: South Asia Market Volume (MT) Forecast by Type, 2018 to 2033
Table 55: South Asia Market Value (US$ Million) Forecast by Capacity, 2018 to 2033
Table 56: South Asia Market Volume (MT) Forecast by Capacity, 2018 to 2033
Table 57: South Asia Market Value (US$ Million) Forecast by Application, 2018 to 2033
Table 58: South Asia Market Volume (MT) Forecast by Application, 2018 to 2033
Table 59: South Asia Market Value (US$ Million) Forecast by Sales Channel, 2018 to 2033
Table 60: South Asia Market Volume (MT) Forecast by Sales Channel, 2018 to 2033
Table 61: Oceania Market Value (US$ Million) Forecast by Country, 2018 to 2033
Table 62: Oceania Market Volume (MT) Forecast by Country, 2018 to 2033
Table 63: Oceania Market Value (US$ Million) Forecast by Type, 2018 to 2033
Table 64: Oceania Market Volume (MT) Forecast by Type, 2018 to 2033
Table 65: Oceania Market Value (US$ Million) Forecast by Capacity, 2018 to 2033
Table 66: Oceania Market Volume (MT) Forecast by Capacity, 2018 to 2033
Table 67: Oceania Market Value (US$ Million) Forecast by Application, 2018 to 2033
Table 68: Oceania Market Volume (MT) Forecast by Application, 2018 to 2033
Table 69: Oceania Market Value (US$ Million) Forecast by Sales Channel, 2018 to 2033
Table 70: Oceania Market Volume (MT) Forecast by Sales Channel, 2018 to 2033
Table 71: MEA Market Value (US$ Million) Forecast by Country, 2018 to 2033
Table 72: MEA Market Volume (MT) Forecast by Country, 2018 to 2033
Table 73: MEA Market Value (US$ Million) Forecast by Type, 2018 to 2033
Table 74: MEA Market Volume (MT) Forecast by Type, 2018 to 2033
Table 75: MEA Market Value (US$ Million) Forecast by Capacity, 2018 to 2033
Table 76: MEA Market Volume (MT) Forecast by Capacity, 2018 to 2033
Table 77: MEA Market Value (US$ Million) Forecast by Application, 2018 to 2033
Table 78: MEA Market Volume (MT) Forecast by Application, 2018 to 2033
Table 79: MEA Market Value (US$ Million) Forecast by Sales Channel, 2018 to 2033
Table 80: MEA Market Volume (MT) Forecast by Sales Channel, 2018 to 2033
Figure 1: Global Market Value (US$ Million) by Type, 2023 to 2033
Figure 2: Global Market Value (US$ Million) by Capacity, 2023 to 2033
Figure 3: Global Market Value (US$ Million) by Application, 2023 to 2033
Figure 4: Global Market Value (US$ Million) by Sales Channel, 2023 to 2033
Figure 5: Global Market Value (US$ Million) by Region, 2023 to 2033
Figure 6: Global Market Value (US$ Million) Analysis by Region, 2018 to 2033
Figure 7: Global Market Volume (MT) Analysis by Region, 2018 to 2033
Figure 8: Global Market Value Share (%) and BPS Analysis by Region, 2023 to 2033
Figure 9: Global Market Y-o-Y Growth (%) Projections by Region, 2023 to 2033
Figure 10: Global Market Value (US$ Million) Analysis by Type, 2018 to 2033
Figure 11: Global Market Volume (MT) Analysis by Type, 2018 to 2033
Figure 12: Global Market Value Share (%) and BPS Analysis by Type, 2023 to 2033
Figure 13: Global Market Y-o-Y Growth (%) Projections by Type, 2023 to 2033
Figure 14: Global Market Value (US$ Million) Analysis by Capacity, 2018 to 2033
Figure 15: Global Market Volume (MT) Analysis by Capacity, 2018 to 2033
Figure 16: Global Market Value Share (%) and BPS Analysis by Capacity, 2023 to 2033
Figure 17: Global Market Y-o-Y Growth (%) Projections by Capacity, 2023 to 2033
Figure 18: Global Market Value (US$ Million) Analysis by Application, 2018 to 2033
Figure 19: Global Market Volume (MT) Analysis by Application, 2018 to 2033
Figure 20: Global Market Value Share (%) and BPS Analysis by Application, 2023 to 2033
Figure 21: Global Market Y-o-Y Growth (%) Projections by Application, 2023 to 2033
Figure 22: Global Market Value (US$ Million) Analysis by Sales Channel, 2018 to 2033
Figure 23: Global Market Volume (MT) Analysis by Sales Channel, 2018 to 2033
Figure 24: Global Market Value Share (%) and BPS Analysis by Sales Channel, 2023 to 2033
Figure 25: Global Market Y-o-Y Growth (%) Projections by Sales Channel, 2023 to 2033
Figure 26: Global Market Attractiveness by Type, 2023 to 2033
Figure 27: Global Market Attractiveness by Capacity, 2023 to 2033
Figure 28: Global Market Attractiveness by Application, 2023 to 2033
Figure 29: Global Market Attractiveness by Sales Channel, 2023 to 2033
Figure 30: Global Market Attractiveness by Region, 2023 to 2033
Figure 31: North America Market Value (US$ Million) by Type, 2023 to 2033
Figure 32: North America Market Value (US$ Million) by Capacity, 2023 to 2033
Figure 33: North America Market Value (US$ Million) by Application, 2023 to 2033
Figure 34: North America Market Value (US$ Million) by Sales Channel, 2023 to 2033
Figure 35: North America Market Value (US$ Million) by Country, 2023 to 2033
Figure 36: North America Market Value (US$ Million) Analysis by Country, 2018 to 2033
Figure 37: North America Market Volume (MT) Analysis by Country, 2018 to 2033
Figure 38: North America Market Value Share (%) and BPS Analysis by Country, 2023 to 2033
Figure 39: North America Market Y-o-Y Growth (%) Projections by Country, 2023 to 2033
Figure 40: North America Market Value (US$ Million) Analysis by Type, 2018 to 2033
Figure 41: North America Market Volume (MT) Analysis by Type, 2018 to 2033
Figure 42: North America Market Value Share (%) and BPS Analysis by Type, 2023 to 2033
Figure 43: North America Market Y-o-Y Growth (%) Projections by Type, 2023 to 2033
Figure 44: North America Market Value (US$ Million) Analysis by Capacity, 2018 to 2033
Figure 45: North America Market Volume (MT) Analysis by Capacity, 2018 to 2033
Figure 46: North America Market Value Share (%) and BPS Analysis by Capacity, 2023 to 2033
Figure 47: North America Market Y-o-Y Growth (%) Projections by Capacity, 2023 to 2033
Figure 48: North America Market Value (US$ Million) Analysis by Application, 2018 to 2033
Figure 49: North America Market Volume (MT) Analysis by Application, 2018 to 2033
Figure 50: North America Market Value Share (%) and BPS Analysis by Application, 2023 to 2033
Figure 51: North America Market Y-o-Y Growth (%) Projections by Application, 2023 to 2033
Figure 52: North America Market Value (US$ Million) Analysis by Sales Channel, 2018 to 2033
Figure 53: North America Market Volume (MT) Analysis by Sales Channel, 2018 to 2033
Figure 54: North America Market Value Share (%) and BPS Analysis by Sales Channel, 2023 to 2033
Figure 55: North America Market Y-o-Y Growth (%) Projections by Sales Channel, 2023 to 2033
Figure 56: North America Market Attractiveness by Type, 2023 to 2033
Figure 57: North America Market Attractiveness by Capacity, 2023 to 2033
Figure 58: North America Market Attractiveness by Application, 2023 to 2033
Figure 59: North America Market Attractiveness by Sales Channel, 2023 to 2033
Figure 60: North America Market Attractiveness by Country, 2023 to 2033
Figure 61: Latin America Market Value (US$ Million) by Type, 2023 to 2033
Figure 62: Latin America Market Value (US$ Million) by Capacity, 2023 to 2033
Figure 63: Latin America Market Value (US$ Million) by Application, 2023 to 2033
Figure 64: Latin America Market Value (US$ Million) by Sales Channel, 2023 to 2033
Figure 65: Latin America Market Value (US$ Million) by Country, 2023 to 2033
Figure 66: Latin America Market Value (US$ Million) Analysis by Country, 2018 to 2033
Figure 67: Latin America Market Volume (MT) Analysis by Country, 2018 to 2033
Figure 68: Latin America Market Value Share (%) and BPS Analysis by Country, 2023 to 2033
Figure 69: Latin America Market Y-o-Y Growth (%) Projections by Country, 2023 to 2033
Figure 70: Latin America Market Value (US$ Million) Analysis by Type, 2018 to 2033
Figure 71: Latin America Market Volume (MT) Analysis by Type, 2018 to 2033
Figure 72: Latin America Market Value Share (%) and BPS Analysis by Type, 2023 to 2033
Figure 73: Latin America Market Y-o-Y Growth (%) Projections by Type, 2023 to 2033
Figure 74: Latin America Market Value (US$ Million) Analysis by Capacity, 2018 to 2033
Figure 75: Latin America Market Volume (MT) Analysis by Capacity, 2018 to 2033
Figure 76: Latin America Market Value Share (%) and BPS Analysis by Capacity, 2023 to 2033
Figure 77: Latin America Market Y-o-Y Growth (%) Projections by Capacity, 2023 to 2033
Figure 78: Latin America Market Value (US$ Million) Analysis by Application, 2018 to 2033
Figure 79: Latin America Market Volume (MT) Analysis by Application, 2018 to 2033
Figure 80: Latin America Market Value Share (%) and BPS Analysis by Application, 2023 to 2033
Figure 81: Latin America Market Y-o-Y Growth (%) Projections by Application, 2023 to 2033
Figure 82: Latin America Market Value (US$ Million) Analysis by Sales Channel, 2018 to 2033
Figure 83: Latin America Market Volume (MT) Analysis by Sales Channel, 2018 to 2033
Figure 84: Latin America Market Value Share (%) and BPS Analysis by Sales Channel, 2023 to 2033
Figure 85: Latin America Market Y-o-Y Growth (%) Projections by Sales Channel, 2023 to 2033
Figure 86: Latin America Market Attractiveness by Type, 2023 to 2033
Figure 87: Latin America Market Attractiveness by Capacity, 2023 to 2033
Figure 88: Latin America Market Attractiveness by Application, 2023 to 2033
Figure 89: Latin America Market Attractiveness by Sales Channel, 2023 to 2033
Figure 90: Latin America Market Attractiveness by Country, 2023 to 2033
Figure 91: Europe Market Value (US$ Million) by Type, 2023 to 2033
Figure 92: Europe Market Value (US$ Million) by Capacity, 2023 to 2033
Figure 93: Europe Market Value (US$ Million) by Application, 2023 to 2033
Figure 94: Europe Market Value (US$ Million) by Sales Channel, 2023 to 2033
Figure 95: Europe Market Value (US$ Million) by Country, 2023 to 2033
Figure 96: Europe Market Value (US$ Million) Analysis by Country, 2018 to 2033
Figure 97: Europe Market Volume (MT) Analysis by Country, 2018 to 2033
Figure 98: Europe Market Value Share (%) and BPS Analysis by Country, 2023 to 2033
Figure 99: Europe Market Y-o-Y Growth (%) Projections by Country, 2023 to 2033
Figure 100: Europe Market Value (US$ Million) Analysis by Type, 2018 to 2033
Figure 101: Europe Market Volume (MT) Analysis by Type, 2018 to 2033
Figure 102: Europe Market Value Share (%) and BPS Analysis by Type, 2023 to 2033
Figure 103: Europe Market Y-o-Y Growth (%) Projections by Type, 2023 to 2033
Figure 104: Europe Market Value (US$ Million) Analysis by Capacity, 2018 to 2033
Figure 105: Europe Market Volume (MT) Analysis by Capacity, 2018 to 2033
Figure 106: Europe Market Value Share (%) and BPS Analysis by Capacity, 2023 to 2033
Figure 107: Europe Market Y-o-Y Growth (%) Projections by Capacity, 2023 to 2033
Figure 108: Europe Market Value (US$ Million) Analysis by Application, 2018 to 2033
Figure 109: Europe Market Volume (MT) Analysis by Application, 2018 to 2033
Figure 110: Europe Market Value Share (%) and BPS Analysis by Application, 2023 to 2033
Figure 111: Europe Market Y-o-Y Growth (%) Projections by Application, 2023 to 2033
Figure 112: Europe Market Value (US$ Million) Analysis by Sales Channel, 2018 to 2033
Figure 113: Europe Market Volume (MT) Analysis by Sales Channel, 2018 to 2033
Figure 114: Europe Market Value Share (%) and BPS Analysis by Sales Channel, 2023 to 2033
Figure 115: Europe Market Y-o-Y Growth (%) Projections by Sales Channel, 2023 to 2033
Figure 116: Europe Market Attractiveness by Type, 2023 to 2033
Figure 117: Europe Market Attractiveness by Capacity, 2023 to 2033
Figure 118: Europe Market Attractiveness by Application, 2023 to 2033
Figure 119: Europe Market Attractiveness by Sales Channel, 2023 to 2033
Figure 120: Europe Market Attractiveness by Country, 2023 to 2033
Figure 121: East Asia Market Value (US$ Million) by Type, 2023 to 2033
Figure 122: East Asia Market Value (US$ Million) by Capacity, 2023 to 2033
Figure 123: East Asia Market Value (US$ Million) by Application, 2023 to 2033
Figure 124: East Asia Market Value (US$ Million) by Sales Channel, 2023 to 2033
Figure 125: East Asia Market Value (US$ Million) by Country, 2023 to 2033
Figure 126: East Asia Market Value (US$ Million) Analysis by Country, 2018 to 2033
Figure 127: East Asia Market Volume (MT) Analysis by Country, 2018 to 2033
Figure 128: East Asia Market Value Share (%) and BPS Analysis by Country, 2023 to 2033
Figure 129: East Asia Market Y-o-Y Growth (%) Projections by Country, 2023 to 2033
Figure 130: East Asia Market Value (US$ Million) Analysis by Type, 2018 to 2033
Figure 131: East Asia Market Volume (MT) Analysis by Type, 2018 to 2033
Figure 132: East Asia Market Value Share (%) and BPS Analysis by Type, 2023 to 2033
Figure 133: East Asia Market Y-o-Y Growth (%) Projections by Type, 2023 to 2033
Figure 134: East Asia Market Value (US$ Million) Analysis by Capacity, 2018 to 2033
Figure 135: East Asia Market Volume (MT) Analysis by Capacity, 2018 to 2033
Figure 136: East Asia Market Value Share (%) and BPS Analysis by Capacity, 2023 to 2033
Figure 137: East Asia Market Y-o-Y Growth (%) Projections by Capacity, 2023 to 2033
Figure 138: East Asia Market Value (US$ Million) Analysis by Application, 2018 to 2033
Figure 139: East Asia Market Volume (MT) Analysis by Application, 2018 to 2033
Figure 140: East Asia Market Value Share (%) and BPS Analysis by Application, 2023 to 2033
Figure 141: East Asia Market Y-o-Y Growth (%) Projections by Application, 2023 to 2033
Figure 142: East Asia Market Value (US$ Million) Analysis by Sales Channel, 2018 to 2033
Figure 143: East Asia Market Volume (MT) Analysis by Sales Channel, 2018 to 2033
Figure 144: East Asia Market Value Share (%) and BPS Analysis by Sales Channel, 2023 to 2033
Figure 145: East Asia Market Y-o-Y Growth (%) Projections by Sales Channel, 2023 to 2033
Figure 146: East Asia Market Attractiveness by Type, 2023 to 2033
Figure 147: East Asia Market Attractiveness by Capacity, 2023 to 2033
Figure 148: East Asia Market Attractiveness by Application, 2023 to 2033
Figure 149: East Asia Market Attractiveness by Sales Channel, 2023 to 2033
Figure 150: East Asia Market Attractiveness by Country, 2023 to 2033
Figure 151: South Asia Market Value (US$ Million) by Type, 2023 to 2033
Figure 152: South Asia Market Value (US$ Million) by Capacity, 2023 to 2033
Figure 153: South Asia Market Value (US$ Million) by Application, 2023 to 2033
Figure 154: South Asia Market Value (US$ Million) by Sales Channel, 2023 to 2033
Figure 155: South Asia Market Value (US$ Million) by Country, 2023 to 2033
Figure 156: South Asia Market Value (US$ Million) Analysis by Country, 2018 to 2033
Figure 157: South Asia Market Volume (MT) Analysis by Country, 2018 to 2033
Figure 158: South Asia Market Value Share (%) and BPS Analysis by Country, 2023 to 2033
Figure 159: South Asia Market Y-o-Y Growth (%) Projections by Country, 2023 to 2033
Figure 160: South Asia Market Value (US$ Million) Analysis by Type, 2018 to 2033
Figure 161: South Asia Market Volume (MT) Analysis by Type, 2018 to 2033
Figure 162: South Asia Market Value Share (%) and BPS Analysis by Type, 2023 to 2033
Figure 163: South Asia Market Y-o-Y Growth (%) Projections by Type, 2023 to 2033
Figure 164: South Asia Market Value (US$ Million) Analysis by Capacity, 2018 to 2033
Figure 165: South Asia Market Volume (MT) Analysis by Capacity, 2018 to 2033
Figure 166: South Asia Market Value Share (%) and BPS Analysis by Capacity, 2023 to 2033
Figure 167: South Asia Market Y-o-Y Growth (%) Projections by Capacity, 2023 to 2033
Figure 168: South Asia Market Value (US$ Million) Analysis by Application, 2018 to 2033
Figure 169: South Asia Market Volume (MT) Analysis by Application, 2018 to 2033
Figure 170: South Asia Market Value Share (%) and BPS Analysis by Application, 2023 to 2033
Figure 171: South Asia Market Y-o-Y Growth (%) Projections by Application, 2023 to 2033
Figure 172: South Asia Market Value (US$ Million) Analysis by Sales Channel, 2018 to 2033
Figure 173: South Asia Market Volume (MT) Analysis by Sales Channel, 2018 to 2033
Figure 174: South Asia Market Value Share (%) and BPS Analysis by Sales Channel, 2023 to 2033
Figure 175: South Asia Market Y-o-Y Growth (%) Projections by Sales Channel, 2023 to 2033
Figure 176: South Asia Market Attractiveness by Type, 2023 to 2033
Figure 177: South Asia Market Attractiveness by Capacity, 2023 to 2033
Figure 178: South Asia Market Attractiveness by Application, 2023 to 2033
Figure 179: South Asia Market Attractiveness by Sales Channel, 2023 to 2033
Figure 180: South Asia Market Attractiveness by Country, 2023 to 2033
Figure 181: Oceania Market Value (US$ Million) by Type, 2023 to 2033
Figure 182: Oceania Market Value (US$ Million) by Capacity, 2023 to 2033
Figure 183: Oceania Market Value (US$ Million) by Application, 2023 to 2033
Figure 184: Oceania Market Value (US$ Million) by Sales Channel, 2023 to 2033
Figure 185: Oceania Market Value (US$ Million) by Country, 2023 to 2033
Figure 186: Oceania Market Value (US$ Million) Analysis by Country, 2018 to 2033
Figure 187: Oceania Market Volume (MT) Analysis by Country, 2018 to 2033
Figure 188: Oceania Market Value Share (%) and BPS Analysis by Country, 2023 to 2033
Figure 189: Oceania Market Y-o-Y Growth (%) Projections by Country, 2023 to 2033
Figure 190: Oceania Market Value (US$ Million) Analysis by Type, 2018 to 2033
Figure 191: Oceania Market Volume (MT) Analysis by Type, 2018 to 2033
Figure 192: Oceania Market Value Share (%) and BPS Analysis by Type, 2023 to 2033
Figure 193: Oceania Market Y-o-Y Growth (%) Projections by Type, 2023 to 2033
Figure 194: Oceania Market Value (US$ Million) Analysis by Capacity, 2018 to 2033
Figure 195: Oceania Market Volume (MT) Analysis by Capacity, 2018 to 2033
Figure 196: Oceania Market Value Share (%) and BPS Analysis by Capacity, 2023 to 2033
Figure 197: Oceania Market Y-o-Y Growth (%) Projections by Capacity, 2023 to 2033
Figure 198: Oceania Market Value (US$ Million) Analysis by Application, 2018 to 2033
Figure 199: Oceania Market Volume (MT) Analysis by Application, 2018 to 2033
Figure 200: Oceania Market Value Share (%) and BPS Analysis by Application, 2023 to 2033
Figure 201: Oceania Market Y-o-Y Growth (%) Projections by Application, 2023 to 2033
Figure 202: Oceania Market Value (US$ Million) Analysis by Sales Channel, 2018 to 2033
Figure 203: Oceania Market Volume (MT) Analysis by Sales Channel, 2018 to 2033
Figure 204: Oceania Market Value Share (%) and BPS Analysis by Sales Channel, 2023 to 2033
Figure 205: Oceania Market Y-o-Y Growth (%) Projections by Sales Channel, 2023 to 2033
Figure 206: Oceania Market Attractiveness by Type, 2023 to 2033
Figure 207: Oceania Market Attractiveness by Capacity, 2023 to 2033
Figure 208: Oceania Market Attractiveness by Application, 2023 to 2033
Figure 209: Oceania Market Attractiveness by Sales Channel, 2023 to 2033
Figure 210: Oceania Market Attractiveness by Country, 2023 to 2033
Figure 211: MEA Market Value (US$ Million) by Type, 2023 to 2033
Figure 212: MEA Market Value (US$ Million) by Capacity, 2023 to 2033
Figure 213: MEA Market Value (US$ Million) by Application, 2023 to 2033
Figure 214: MEA Market Value (US$ Million) by Sales Channel, 2023 to 2033
Figure 215: MEA Market Value (US$ Million) by Country, 2023 to 2033
Figure 216: MEA Market Value (US$ Million) Analysis by Country, 2018 to 2033
Figure 217: MEA Market Volume (MT) Analysis by Country, 2018 to 2033
Figure 218: MEA Market Value Share (%) and BPS Analysis by Country, 2023 to 2033
Figure 219: MEA Market Y-o-Y Growth (%) Projections by Country, 2023 to 2033
Figure 220: MEA Market Value (US$ Million) Analysis by Type, 2018 to 2033
Figure 221: MEA Market Volume (MT) Analysis by Type, 2018 to 2033
Figure 222: MEA Market Value Share (%) and BPS Analysis by Type, 2023 to 2033
Figure 223: MEA Market Y-o-Y Growth (%) Projections by Type, 2023 to 2033
Figure 224: MEA Market Value (US$ Million) Analysis by Capacity, 2018 to 2033
Figure 225: MEA Market Volume (MT) Analysis by Capacity, 2018 to 2033
Figure 226: MEA Market Value Share (%) and BPS Analysis by Capacity, 2023 to 2033
Figure 227: MEA Market Y-o-Y Growth (%) Projections by Capacity, 2023 to 2033
Figure 228: MEA Market Value (US$ Million) Analysis by Application, 2018 to 2033
Figure 229: MEA Market Volume (MT) Analysis by Application, 2018 to 2033
Figure 230: MEA Market Value Share (%) and BPS Analysis by Application, 2023 to 2033
Figure 231: MEA Market Y-o-Y Growth (%) Projections by Application, 2023 to 2033
Figure 232: MEA Market Value (US$ Million) Analysis by Sales Channel, 2018 to 2033
Figure 233: MEA Market Volume (MT) Analysis by Sales Channel, 2018 to 2033
Figure 234: MEA Market Value Share (%) and BPS Analysis by Sales Channel, 2023 to 2033
Figure 235: MEA Market Y-o-Y Growth (%) Projections by Sales Channel, 2023 to 2033
Figure 236: MEA Market Attractiveness by Type, 2023 to 2033
Figure 237: MEA Market Attractiveness by Capacity, 2023 to 2033
Figure 238: MEA Market Attractiveness by Application, 2023 to 2033
Figure 239: MEA Market Attractiveness by Sales Channel, 2023 to 2033
Figure 240: MEA Market Attractiveness by Country, 2023 to 2033
The global jet mill market size is expected to reach a valuation of USD 1,297.3 Million in 2023.
Jet mills demand is anticipated to increase at 5.4% CAGR between 2023 and 2033.
The global jet mill industry is projected to surpass a valuation of USD 2,195.1 Million by the end of 2033.
The US holds around 32.1% of the total market share which is valued at around USD 416.4 Million.
The US, Canada, Mexico, Argentina, Brazil, Germany, the UK, France, Italy, Russia, Spain, China, Japan, India, Indonesia, South Korea, and Australia are the major countries driving demand for jet mills.
Germany accounts for around 25.1% of the total market share in the global market which values at USD 325.6 Million.
Fluid Energy Group, Hosokawa Micron, Sturtevant, British Rema, and Continental Biomass Industries are the top 5 market players in the jet mill industry.
Japan holds approximately 5.2% of the total market share in the global industry.
The overall market for jet mills in India is poised to grow at 5.9% CAGR between 2023 and 2033.
Explore Milling and Grinding Equipment Insights
Thank you!
You will receive an email from our Business Development Manager. Please be sure to check your SPAM/JUNK folder too.