

- Market Size (2026)
- USD 3.7 Bn
- Forecast (2036)
- USD 15.5 Bn
- CAGR (2026 to 2036)
- 15.4%
How big is the Virtual Production Market in 2026?
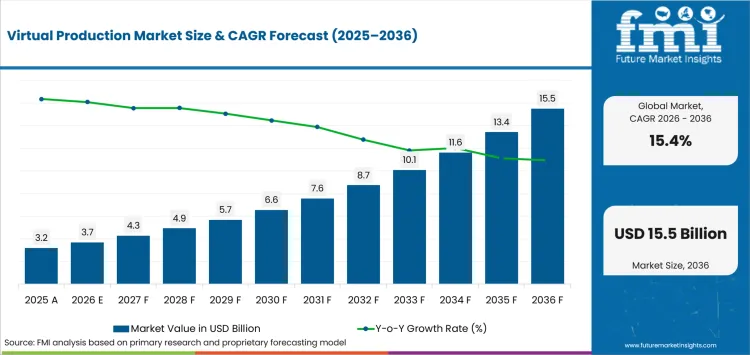
USD 3.7 billion in 2026 and USD 15.5 billion by 2036 at a 15.4% CAGR.
Demand for virtual production systems is projected to expand at 15.4% CAGR between 2026 and 2036, increasing valuation from USD 3.7 billion in 2026 to USD 15.5 billion by 2036. Virtual production allows studios to visualize and refine digital environments during filming, reducing the need for costly revisions during post-production and improving overall workflow efficiency.
The ability to reuse virtual production stages across multiple projects helps studios recover infrastructure investments while maintaining consistent production quality. Demand is rising as adoption increases for reliable LED display walls and camera-tracking systems that support repeatable production environments. Reflecting this trend, the Saudi Film Commission opened the JAX Virtual Production Studio in November 2025, featuring 2,720 Sony VERONA LED panels with integrated tracking capabilities. The permanent facility provides regional filmmakers with a controlled environment for camera testing and recurring studio bookings.
Key Takeaways of Virtual Production Market
- Production teams evaluate digital environments during capture instead of postponing every visual decision to later post-production work.
- Hardware is projected to hold 42.0% share in 2026 mainly because displays and tracking establish each camera-ready stage.
- Production is anticipated at 52.0% share in 2026 as real-time systems operate during principal photography.
- LED volume and in-camera VFX is estimated at 39.0% in 2026 due to camera-ready background capture.
- High stage costs and incomplete calibration restrain adoption by exposing recorded footage to avoidable technical failure.
- Epic Games, Foundry, Sony, NVIDIA, Disguise, Mo-Sys, ARRI, ROE Visual, Dimension Studio and Lux Machina serve the market.
Analyst Perspective
"Camera tests using the final lens package reveal whether tracking, color and digital assets support each planned shot. Studios should budget preparation and technical supervision with stage time to prevent expensive corrective post-production."
- Sudip saha, Principal Consultant for Technology, Future Market Insights
How is the Virtual Production Market segmented?
The Virtual Production Market is segmented by component, production stage, application, end use, technology and region.
The virtual production industry is segmented by component, production stage, application, end use, technology and region. Component covers hardware, software and services, while production stage includes production, pre-production and post-production workflows. Applications cover movies, television and streaming, commercial advertising, gaming and esports, while end uses include film studios, broadcasters, streaming platforms, agencies and game producers. Technology covers LED volume and in-camera VFX, real-time engines, motion capture and tracking, and extended reality or virtual sets across content creation workflows.
Why do movies lead demand within the application category?
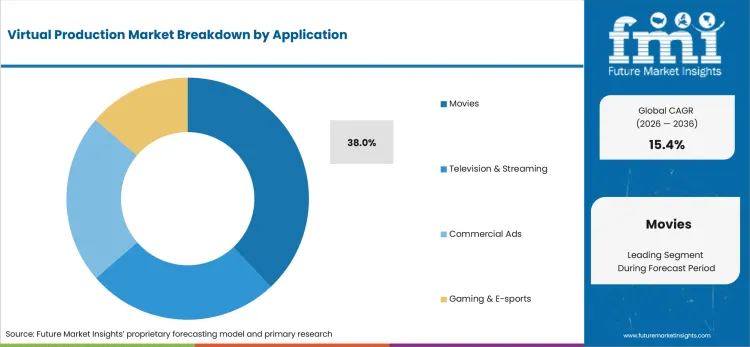
Movies reuse digital environments across sequences requiring controlled weather and repeatable lighting, allowing feature productions to spread asset preparation across schedules with AI-enabled media tools for tasks.
- In 2026, movies are expected to lead the application category with 38.0% share because prepared environments support repeated use across technically demanding sequences.
- Film producers compare stage days against travel costs and visual-effects correction during approval of complex sequences. In August 2025, Sony reported that a PXO AKIRA short film combined VERONA displays with VENICE 2 and BURANO cameras plus OCELLUS tracking. The configuration supports vehicle sequences requiring controlled reflections and repeatable camera motion across successive takes.
Why does hardware lead demand within the component category?
Hardware determines whether rendered scenery reaches the camera with stable color and perspective, requiring displays and tracking devices to operate as one capture layer during technical rehearsal.
- Hardware is set to lead the component category with 42.0% share in 2026 due to the physical display and tracking stack required for camera-ready production.
- Stage teams test video wall systems with planned lenses so moiré and latency surface during rehearsal. ROE Visual reported a third NIPA studio expansion in June 2025 using a 24-meter LED wall that links scalable displays with 3D motion capture for hybrid production workflows.
Why does production lead demand within the production stage category?
Production exposes technical errors during each take as camera movement and digital scenery must remain aligned, while render performance stays stable across the approved camera package.
- By production stage, production is estimated to hold 52.0% in 2026 owing to in-camera visual effects that place real-time decisions inside principal photography.
- Operators use animation software to rehearse final assets at the intended frame rate and protect the capture window. In March 2025, TRG Multimedia expanded through an 8,000-square-foot facility with a 50-by-16-foot LED volume powered by Disguise Studio Pro. Installation support and technical training help the stage maintain repeatable performance across scheduled commercial shoots.
Why does LED volume and in-camera VFX lead demand within the technology category?
LED volume workflows surround physical sets with rendered environments that update perspective as a tracked camera changes position, providing reflections and interactive light through advanced visualization systems.
- The technology category is forecast to be led by LED volume and in-camera VFX at 39.0% share in 2026 due to camera-ready background capture.
- Stage engineers qualify exposure and synchronization under intended camera settings during technical rehearsals for each planned sequence. In In June 2025, Dimension Studio introduced the ViV system, with ROE Visual supplying synchronized robotic camera and LED-wall panel technology. Its compact arrangement extends motion beyond fixed-volume geometry and supports faster setup for selected sequences.
What are the drivers, restraints and opportunities in the Virtual Production Market?
Driver: Real-time rehearsals support final-image decisions. Restraint: Calibration failures consume stage time. Opportunity: Managed stages provide qualified access.
- Driver: Real-time rendering brings framing and lighting decisions into rehearsals that use the final camera package.
- Restraint: Calibration or tracking failures consume booked stage time and can embed defects inside recorded footage.
- Opportunity: Managed stages combine equipment, qualified operators and camera testing for productions without permanent infrastructure.
Real-time engines and 3D display technologies let cinematographers judge perspective and interactive lighting during scheduled camera rehearsals. Earlier correction reduces later visual-effects work and protects the planned shooting window from technical revisions.
Tracking errors and inconsistent color management can make a capable stage unreliable during principal photography. A faulty lens profile or synchronization gap consumes booked time and can leave unusable imagery inside recorded footage.
Managed stages let smaller productions rent integrated equipment and trained crews without financing permanent infrastructure. Camera tests covering lenses, frame rate, lighting and final content support recurring service revenue across suitable projects using portable video walls.
Which country CAGRs are profiled in the Virtual Production Market?
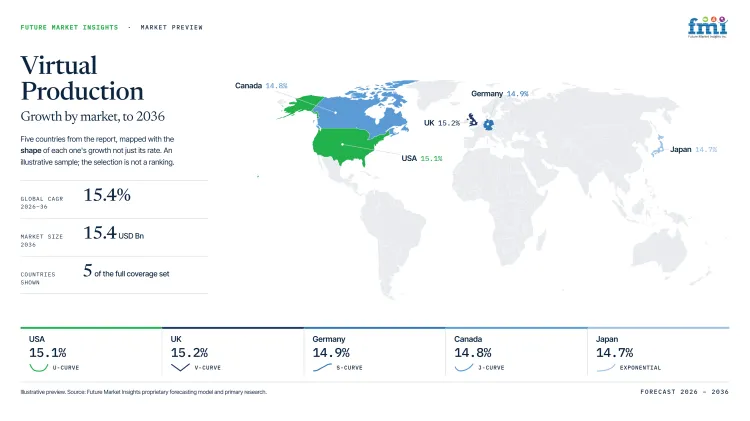
| Country | CAGR |
|---|---|
| South Korea | 16.3% |
| United Kingdom | 15.2% |
| United States | 15.1% |
| Australia | 15.0% |
| Germany | 14.9% |
| Canada | 14.8% |
| Japan | 14.7% |
How do country-level CAGRs compare in the Virtual Production Market?
Country CAGRs span 1.6 percentage points through 2036, describing forecast pace rather than current revenue or installed stage capacity.
- South Korea's forecast rate exceeds the United Kingdom by 1.1 percentage points as public-stage access supports wider trial activity.
- The United Kingdom and United States differ by 0.1 percentage point despite distinct tax structures and service arrangements.
- Australia and Germany differ by 0.1 percentage point under separate production models and technical-support distances.
- Canada and Japan differ by 0.1 percentage point although studio concentration shapes distinct purchasing conditions.
Comparable CAGRs produce different entry conditions as studio capacity and service routes vary between production centers. The full report covers North America, Latin America, Europe, East Asia, South Asia and Pacific, and the Middle East and Africa.
Country-wise Analysis
- South Korean producers can test camera-ready workflows at Studio Cube without financing permanent infrastructure, giving smaller projects controlled access to a large technical stage and practical training. Adoption of virtual production in South Korea is estimated to expand at 16.3% CAGR through 2036, supported by public studio access and domestic content production. The operating route gained depth in December 2025 as the culture ministry opened a 60-meter LED studio with pilot access and operator training for content teams. Regional maintenance and calibration support remains concentrated around established production centers, so repeated use depends on early technical booking and available specialists.
- United Kingdom producers can connect virtual stages with established visual-effects teams across London and regional studio centers, supporting continuity from on-set capture through final delivery. United Kingdom’s virtual production outlook is anticipated to advance at 15.2% CAGR over the assessment period, reinforced by established production services and a mature screen workforce. Government research published in July 2025 described virtual production as film and television process innovation that can reduce later visual-effects adjustment. Smaller studios face financing limits and uneven access to experienced operators outside the largest production clusters, which can restrict repeat stage bookings and regional project continuity nationwide.
- United States production capacity spans major studio centers and regional soundstages with different labor models, offering large projects several technical routes but uneven support outside established hubs. Virtual production sales in the United States are forecast to expand at 15.1% CAGR by 2036, driven by production scale and deep visual-effects capacity. California’s Program 4.0 guidelines took effect in January 2026 with USD 750 million available each fiscal year and a definition that includes filming inside a virtual production volume for eligible visual-effects work. Irregular stage utilization can weaken returns for facilities that lack recurring film or television bookings.
- Australian productions can use Docklands Studios Melbourne for LED-volume shoots that combine live performance with camera-ready environments, giving complex sequences a controlled domestic stage. In Australia, virtual production demand is predicted to advance at 15.0% CAGR through 2036, aided by established screen services and permanent volume infrastructure. The commercial route was demonstrated in June 2025 as Victoria confirmed Play Dead would use the facility and support 160 crew plus 100 post-production and digital-effects roles. Long travel distances raise specialist support costs for projects operating outside Melbourne’s technical network and established production-service base across the wider country and regional locations.
- German broadcasters can test virtual production inside scheduled studio programs that expose synchronization and operator problems under realistic multicamera conditions, reducing commissioning risk across entertainment and streaming formats. The German virtual production sector is projected to record 14.9% CAGR during the assessment period, shaped by broadcast trials and experienced technical production teams. SWR began a three-month test in September 2025 using a 10-by-4-meter VERONA wall with three tracked cameras and OCELLUS for a live multicamera format. Smaller productions cannot absorb prolonged setup work, so commercial use depends on reusable configurations and available engineering support reliably across scheduled broadcast production.
- Canadian production companies rely on Toronto and Vancouver stage networks that connect soundstages with visual-effects teams, although crews based elsewhere face longer technical-support routes nationally. By 2036, Canada is projected to grow at 14.8% CAGR, influenced by regional production services and established international project pipelines. Dark Slope expanded its Toronto campus to 75,000 square feet in November 2025 with three soundstages and a motion-capture and animation stage, giving producers one site for physical builds and hybrid real-time workflows. Recurring projects must generate enough booked volume to retain consistent calibration across successive production schedules and technical teams working locally.
- Japanese production teams can test virtual production through domestic imaging companies and studios that combine cameras with LED environments, supporting controlled validation for commercial and vehicle sequences. Virtual production demand in Japan is forecast to rise at 14.7% CAGR over the forecast period, attributable to domestic engineering and established content production. Sony introduced PXO AKIRA in January 2025 with a robotic camera crane, motion platform and LED volume linked by digital-twin software. The coordinated system lets vehicle productions test camera movement and reflections without changing physical locations. Smaller projects face limited stage access and concentrated specialist skills, restricting repeat use outside established production centers.
Who are the notable companies in the Virtual Production Market?
Epic Games, Inc., The Foundry Visionmongers Ltd., Sony Corporation, NVIDIA Corporation, Disguise Technologies Ltd., Mo-Sys Engineering Ltd., ARRI AG, ROE Visual Co., Ltd., Dimension Studio and Lux Machina Consulting are the notable companies serving this market.
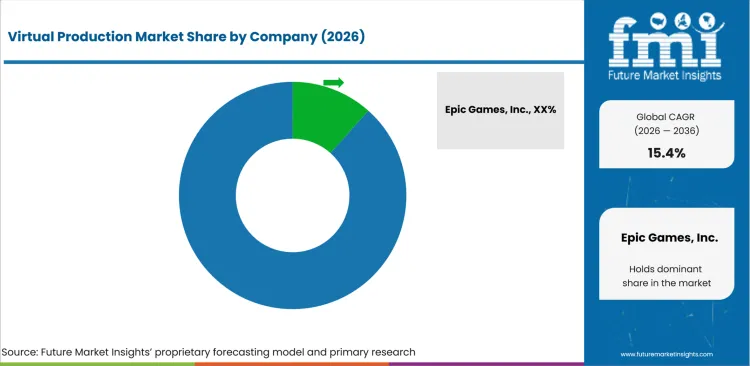
Software engines compete beside camera platforms, LED manufacturers, tracking specialists and stage integrators across distinct workflow layers. Repeat bookings require interoperability that broadcast equipment stacks and light field imaging cannot provide without stage integration.
- Epic Games, Foundry and NVIDIA provide real-time engines, content control and accelerated rendering across stage workflows.
- Sony, Disguise, Mo-Sys, ARRI and ROE Visual cover cameras, LED displays, tracking, media control and technical support.
- Dimension Studio and Lux Machina focus on visualization, stage integration and on-set engineering for filmed projects.
Competitive Benchmarking: Virtual Production Market
| Company | Real-Time Content & Rendering | Stage Hardware & Tracking | Qualification & Service Support | Geographic Reach |
|---|---|---|---|---|
| Epic Games, Inc. | High | Low | Medium | Global |
| The Foundry Visionmongers Ltd. | High | Low | Medium | North America, Europe and Asia-Pacific |
| Sony Corporation | Medium | High | High | Global |
| NVIDIA Corporation | High | Low | Medium | Global |
| Disguise Technologies Ltd. | High | High | High | Global |
| Mo-Sys Engineering Ltd. | Medium | High | High | Europe, North America and Asia-Pacific |
| ARRI AG | Medium | High | High | Global |
| ROE Visual Co., Ltd. | Low | Medium | Medium | Europe, North America and Asia-Pacific |
| Dimension Studio | High | High | High | North America and Europe |
| Lux Machina Consulting | Medium | High | High | North America and Europe with global projects |
Scoring basis: Real-time content and rendering is High for dedicated workflow control, Medium for a focused layer and Low for verified supporting compute. Stage hardware and tracking is High for several physical layers, Medium for one principal layer and Low for verified software connectivity. Qualification and service support is High for broad stage delivery, Medium for two documented functions and Low for standard assistance. Geographic reach records verified service regions, with official announcements and dated project records from 2024 through 2026 supporting every rating.
Key Developments in the Virtual Production Market
- In April 2025, Foundry announced Nuke Stage to connect real-time LED playback with live compositing and open-standard color control.
- In March 2025, Sony Electronics introduced OCELLUS as a marker-free tracking system combining camera position with lens metadata.
- In June 2025, ARRI supported United Illusions through stage design, camera systems, lighting, workflow training and accreditation.
Key Players in the Virtual Production Market
Real-Time Software and Compute Platforms
- Epic Games, Inc.
- The Foundry Visionmongers Ltd.
- NVIDIA Corporation
Display, Camera and Tracking Platforms
- Sony Corporation
- Disguise Technologies Ltd.
- Mo-Sys Engineering Ltd.
- ARRI AG
- ROE Visual Co., Ltd.
Virtual Production Studios and Integrators
- Dimension Studio
- Lux Machina Consulting
Virtual Production Market - Report Scope
| Coverage field | Report scope |
|---|---|
| Market breakdown | By component, production stage, application, end use, technology and region. |
| Quantitative Units | USD billion. |
| Market Definition | Hardware, software and services used to plan, render, display, track and capture digital environments alongside live action. |
| Regions Covered | North America, Latin America, Western Europe, Eastern Europe, East Asia, South Asia and Pacific, and Middle East and Africa. |
| Countries Covered | South Korea, United Kingdom, United States, Australia, Germany, Canada, Japan and 20+ countries included in the full report. |
| Key Companies Profiled | Epic Games, Inc., The Foundry Visionmongers Ltd., Sony Corporation, NVIDIA Corporation, Disguise Technologies Ltd., Mo-Sys Engineering Ltd., ARRI AG, ROE Visual Co., Ltd., Dimension Studio and Lux Machina Consulting. |
| Forecast Period | 2026-2036. |
| Approach | Primary and secondary research with market triangulation. |
Virtual Production Market - Research Methodology
| Method | Approach |
|---|---|
| Primary Research | FMI analysts gathered input from manufacturers, service providers, technology developers, distributors, end users, procurement teams, and subject-matter experts. Interviews examined purchasing decisions, product or service evaluation, adoption barriers, approval requirements, pricing considerations, and expectations for technical or commercial support. Respondents were also asked what evidence is required before a trial, pilot, or initial order develops into regular purchasing. |
| Desk Research | Desk research covered government statistics, regulatory publications, trade data, industry associations, technical literature, standards, company filings, product information, and official corporate announcements. Sources were reviewed for relevance, publication date, geographic coverage, and consistency with the defined market scope. Claims relating to performance, applications, approvals, capacity, investment, and commercial activity were retained only when supported by credible public evidence. |
| Market Sizing and Forecasting | The market model combined the baseline value with historical performance, segment structure, pricing and volume indicators, adoption levels, company participation, and country-level demand conditions. Forecast assumptions considered economic activity, investment trends, regulatory developments, technology adoption, purchasing cycles, supply availability, and barriers to wider market use. Segment and regional estimates were reconciled before the final market total was calculated. |
| Data Validation | Estimates were checked against multiple independent indicators, including public data, company activity, trade patterns, industry developments, and findings from primary interviews. Validation also tested whether products, services, applications, and company revenues fell within the defined market boundaries. Adjacent categories, unsupported claims, overlapping revenues, and activities without direct market relevance were excluded to reduce double counting and maintain consistency across segments and countries. |
Virtual Production Market by Segments
Virtual Production Market segmented by Component:
- Hardware
- LED Video Walls
- Cameras & Motion Capture Systems
- Software
- Real-Time Rendering Software
- 3D Content Creation Software
- Services
- Virtual Production Studio Services
- Consulting & Technical Services
Virtual Production Market segmented by Production Stage:
- Production
- In-Camera Visual Effects
- Live Virtual Sets
- Pre-Production
- Previsualization
- Virtual Scouting
- Post-Production
- Visual Effects
- Virtual Post-Production
Virtual Production Market segmented by Application:
- Movies
- Feature Films
- Blockbuster Productions
- Television & Streaming
- TV Series
- Streaming Original Content
- Commercial Ads
- Brand Advertising
- Product Advertising
- Gaming & E-sports
- E-sports Broadcasting
- Game Cinematics
Virtual Production Market segmented by End Use:
- Film & Cinema
- Film Studios
- Independent Film Production
- Television & Streaming
- Broadcast Networks
- Streaming Platforms
- Advertising & Commercial Production
- Advertising Agencies
- Brand Content Studios
- Gaming & Interactive Media
- Game Developers
- E-sports Producers
Virtual Production Market segmented by Technology:
- LED Volume & In-Camera VFX
- LED Virtual Production Stages
- Real-Time Background Rendering
- Real-Time Rendering & Game Engines
- Unreal Engine
- Real-Time 3D Rendering
- Motion Capture & Tracking
- Performance Capture
- Camera Tracking Systems
- Extended Reality & Virtual Sets
- Virtual Reality Production
- Augmented Reality Production
Virtual Production Market by Region:
- North America
- United States
- Canada
- Mexico
- Latin America
- Brazil
- Chile
- Rest of Latin America
- Western Europe
- Germany
- United Kingdom
- Italy
- Spain
- France
- Nordics
- Benelux
- Rest of Western Europe
- Eastern Europe
- Russia
- Poland
- Hungary
- Balkan and Baltic States
- Rest of Eastern Europe
- East Asia
- China
- Japan
- South Korea
- South Asia and Pacific
- India
- ASEAN
- Australia and New Zealand
- Rest of South Asia and Pacific
- Middle East and Africa
- Kingdom of Saudi Arabia
- Other GCC Countries
- Türkiye
- South Africa
- Other African Union Countries
- Rest of Middle East and Africa
Research Sources and Bibliography
- Future Market Insights. (2026). Virtual Production Market data record.
- Saudi Press Agency. (2025, November 5). Film Commission Announces Opening of Virtual Production Platform at JAX Film Studios in Riyadh in Collaboration with Sony and Dimension Studio.
- Ministry of Culture, Sports and Tourism. (2025, December 3). Korea’s Largest Virtual Studio Opens at Studio Cube, Leading the Next Generation of Media Production Environments.
- Department for Culture, Media and Sport. (2025, July 10). Innovation and productivity in DCMS sectors.
- California Film Commission. (2026, January 1). CA Film and Television Tax Credit Program 4.0 Program Guidelines.
- Premier of Victoria. (2025, June 2). WW2 Thriller Filming At Docklands Studios Giant Screens.
- Südwestrundfunk. (2025, October 10). SWR startet Innovationsprojekt „Virtual Production“.
- Dark Slope. (2025, November 11). Dark Slope Unveils Expanded 75,000 sq. ft. Purpose-Built Soundstage Campus.
- Sony Group Corporation. (2025, January 7). Sony Exhibits at CES® 2025.
- Epic Games. (2025, November 12). Unreal Engine 5.7 is now available.
- Foundry. (2025, April 2). Foundry announces Nuke Stage virtual production product.
- Sony Electronics. (2025, March 18). Sony Electronics Introduces OCELLUS, a New Camera Tracking System for the Creation of Spatial Content in Augmented Reality and Virtual Production.
- NVIDIA Corporation. (2025, March 19). NVIDIA Blackwell Powers Real-Time AI for Entertainment Workflows.
- Disguise. (2025, March 19). TRG Multimedia expands into virtual production with Disguise Studio Pro.
- Mo-Sys Engineering. (2026, February 12). Mo-Sys launches CarRig: Robotics-driven realism for in-studio car shoots.
- ARRI. (2025, June 4). ARRI boosts United Illusions’ world-class film complex in Budapest with solutions, equipment, and stage accreditation.
- ROE Visual. (2025, June 26). UNITED ILLUSIONS STUDIO SELECTS ROE VISUAL LED.
- Lux Machina Consulting. (2024, September 25). 'Behind-the-Tech' with Alex Coppedge and Sky Ferren.
- ROE Visual. (2025, June). ARK Ventures Chooses ROE Visual Once Again to Empower NIPA Studio’s Third Expansion.
- Sony Group Corporation. (2025, August 28). Showcasing Sony’s Creative Entertainment Vision at SIGGRAPH 2025.
- ROE Visual. (2025, June 25). ROE Visual Supports Groundbreaking ViV System.
- Dimension Studio. (2025, May 14). Dimension introduces ViV, the world's-first motion-controlled virtual production environment.
- DNEG / Dimension Studio. (2024, April 30). DNEG Launches DNEG 360, a New Division in Partnership with Dimension Studio — two of the world's largest LED volume stages (London, Rome).
This bibliography is provided for reader reference and is not exhaustive. The full report contains the complete reference list and detailed citations.
This Report Answers
- How large is the virtual production market in 2026 and 2036?
- What supports demand for virtual production systems?
- Which component holds the largest 2026 share?
- Why does production account for 52.0% of stage demand?
- Which technology holds the dominant 2026 share?
- How do profiled country growth rates differ?
- Which companies provide software, hardware and integration?
- What limits adoption across production schedules?
- How should studios compare virtual production systems?
Frequently Asked Questions
How big is the virtual production market in 2026?
The virtual production market is valued at USD 3.7 billion in 2026 across hardware, software and services. Integrated stage workflows are forecast to raise valuation to USD 15.5 billion by 2036.
What is the CAGR of the virtual production market from 2026 to 2036?
The virtual production market is projected to expand at 15.4% CAGR between 2026 and 2036. Growth depends on coordinated digital assets, tracking, cameras and displays supported by experienced technical teams.
Which component segment accounts for 42.0% share in 2026?
Hardware is projected to account for 42.0% of component demand during 2026. Displays, tracking devices and capture equipment provide the physical layer required for repeatable camera-ready production results across production stages.
Which production stage segment accounts for 52.0% share in 2026?
Production is anticipated to represent 52.0% of production-stage demand during 2026. Real-time tracking and display output operate during principal photography, so technical errors directly affect recorded imagery and booked stage time.
Which technology segment accounts for 39.0% share in 2026?
LED volume and in-camera VFX is estimated to hold 39.0% of technology demand during 2026. Camera-ready backgrounds support perspective changes and interactive lighting while reducing later compositing for suitable commercial sequences.
Which profiled country records 16.3% CAGR through 2036?
South Korea is forecast to record 16.3% CAGR through 2036 within the profiled country set. Public stage access supports controlled trials, while calibration skills and maintenance coverage influence recurring commercial use.
How much value is expected to be added between 2026 and 2036?
The virtual production market is expected to add USD 11.7 billion between 2026 and 2036. Expansion reflects wider use across film, television, commercials and interactive content alongside integrated stage workflow spending.
Which companies are active in the virtual production market?
Epic Games, Foundry, Sony, NVIDIA, Disguise, Mo-Sys, ARRI, ROE Visual, Pixomondo and Lux Machina serve documented market roles. Their capabilities cover rendering, stage hardware, tracking, integration and technical on-set support services during production.
Preview the report firsthand - request a free sample
Get SampleGet the brochure for pricing and purchase details.
Get PDFTable of Content
- Key Takeaways
- Market Size and CAGR
- Top Growth Driver
- Fastest Growing Segment
- Leading Region
- Key Companies
- Emerging Opportunities
- Executive Summary
- Global Market Outlook
- Demand-side Trends
- Supply-side Trends
- Technology Roadmap Analysis
- Analysis and Recommendations
- Analyst Perspective (What is happening? Why now? What should investors know?)
- Key Questions Answered
- How large is the market?
- What is the CAGR?
- What are key trends?
- Which region dominates?
- Who are the leaders?
- Market Overview
- Market Coverage / Taxonomy
- Market Definition / Scope / Limitations
- Research Methodology
- Chapter Orientation
- Analytical Lens and Working Hypotheses
- Market Structure, Signals, and Trend Drivers
- Benchmarking and Cross-market Comparability
- Market Sizing, Forecasting, and Opportunity Mapping
- Research Design and Evidence Framework
- Desk Research Programme (Secondary Evidence)
- Expert Input and Fieldwork (Primary Evidence)
- Tooling, Models, and Reference Databases
- Data Engineering and Model Build
- Quality Assurance and Audit Trail
- Market Background
- Market Dynamics (Drivers, Restraints, Opportunity, Trends)
- Scenario Forecast (Optimistic, Likely, Conservative)
- Impact Analysis
- AI Impact
- Sustainability Impact
- Regulatory Impact
- Technology Impact
- Consumer / Buyer Analysis
- Purchase Drivers
- Adoption Barriers
- Buyer Journey
- Opportunity Map Analysis
- Product Life Cycle Analysis
- Supply Chain Analysis
- Investment Feasibility Matrix
- Value Chain Analysis
- PESTLE and Porter's Analysis
- Regulatory Landscape
- Regional Parent Market Outlook
- Production and Consumption Statistics
- Import and Export Statistics
- Global Market Analysis and Forecast, 2021 to 2036
- Historical Market Size Value (USD Billion) Analysis, 2021 to 2025
- Current and Future Market Size Value (USD Billion) Projections, 2026 to 2036
- Y-o-Y Growth Trend Analysis
- Absolute $ Opportunity Analysis
- Global Market Pricing Analysis, 2021 to 2036
- Global Market Analysis and Forecast, By Component, 2021 to 2036
- Introduction / Key Findings
- Historical Market Size Value (USD Billion) Analysis By Component, 2021 to 2025
- Current and Future Market Size Value (USD Billion) Analysis and Forecast By Component, 2026 to 2036
- Hardware
- LED Video Walls
- Cameras & Motion Capture Systems
- Software
- Real-Time Rendering Software
- 3D Content Creation Software
- Services
- Virtual Production Studio Services
- Consulting & Technical Services
- Hardware
- Y-o-Y Growth Trend Analysis By Component, 2021 to 2025
- Absolute $ Opportunity Analysis By Component, 2026 to 2036
- Global Market Analysis and Forecast, By Production Stage, 2021 to 2036
- Introduction / Key Findings
- Historical Market Size Value (USD Billion) Analysis By Production Stage, 2021 to 2025
- Current and Future Market Size Value (USD Billion) Analysis and Forecast By Production Stage, 2026 to 2036
- Production
- In-Camera Visual Effects
- Live Virtual Sets
- Pre-Production
- Previsualization
- Virtual Scouting
- Post-Production
- Visual Effects
- Virtual Post-Production
- Production
- Y-o-Y Growth Trend Analysis By Production Stage, 2021 to 2025
- Absolute $ Opportunity Analysis By Production Stage, 2026 to 2036
- Global Market Analysis and Forecast, By Application, 2021 to 2036
- Introduction / Key Findings
- Historical Market Size Value (USD Billion) Analysis By Application, 2021 to 2025
- Current and Future Market Size Value (USD Billion) Analysis and Forecast By Application, 2026 to 2036
- Movies
- Feature Films
- Blockbuster Productions
- Television & Streaming
- TV Series
- Streaming Original Content
- Commercial Ads
- Brand Advertising
- Product Advertising
- Gaming & E-sports
- E-sports Broadcasting
- Game Cinematics
- Movies
- Y-o-Y Growth Trend Analysis By Application, 2021 to 2025
- Absolute $ Opportunity Analysis By Application, 2026 to 2036
- Global Market Analysis and Forecast, By End Use, 2021 to 2036
- Introduction / Key Findings
- Historical Market Size Value (USD Billion) Analysis By End Use, 2021 to 2025
- Current and Future Market Size Value (USD Billion) Analysis and Forecast By End Use, 2026 to 2036
- Film & Cinema
- Film Studios
- Independent Film Production
- Television & Streaming
- Broadcast Networks
- Streaming Platforms
- Advertising & Commercial Production
- Advertising Agencies
- Brand Content Studios
- Gaming & Interactive Media
- Game Developers
- E-sports Producers
- Film & Cinema
- Y-o-Y Growth Trend Analysis By End Use, 2021 to 2025
- Absolute $ Opportunity Analysis By End Use, 2026 to 2036
- Global Market Analysis and Forecast, By Technology, 2021 to 2036
- Introduction / Key Findings
- Historical Market Size Value (USD Billion) Analysis By Technology, 2021 to 2025
- Current and Future Market Size Value (USD Billion) Analysis and Forecast By Technology, 2026 to 2036
- LED Volume & In-Camera VFX
- LED Virtual Production Stages
- Real-Time Background Rendering
- Real-Time Rendering & Game Engines
- Unreal Engine
- Real-Time 3D Rendering
- Motion Capture & Tracking
- Performance Capture
- Camera Tracking Systems
- Extended Reality & Virtual Sets
- Virtual Reality Production
- Augmented Reality Production
- LED Volume & In-Camera VFX
- Y-o-Y Growth Trend Analysis By Technology, 2021 to 2025
- Absolute $ Opportunity Analysis By Technology, 2026 to 2036
- Global Market Analysis and Forecast, By Region, 2021 to 2036
- Introduction
- Historical Market Size Value (USD Billion) Analysis By Region, 2021 to 2025
- Current Market Size Value (USD Billion) Analysis and Forecast By Region, 2026 to 2036
- North America
- Latin America
- Western Europe
- Eastern Europe
- East Asia
- South Asia and Pacific
- Middle East & Africa
- Market Attractiveness Analysis By Region
- North America Market Analysis and Forecast, By Country, 2021 to 2036
- Historical Market Size Value (USD Billion) Trend Analysis By Market Taxonomy, 2021 to 2025
- Market Size Value (USD Billion) Forecast By Market Taxonomy, 2026 to 2036
- By Country
- USA
- Canada
- By Component
- By Production Stage
- By Application
- By End Use
- By Technology
- By Country
- Market Attractiveness Analysis
- By Country
- By Component
- By Production Stage
- By Application
- By End Use
- By Technology
- Key Takeaways
- Latin America Market Analysis and Forecast, By Country
- Historical Market Size Value (USD Billion) Trend Analysis By Market Taxonomy, 2021 to 2025
- Market Size Value (USD Billion) Forecast By Market Taxonomy, 2026 to 2036
- By Country
- Brazil
- Mexico
- Chile
- Rest of Latin America
- By Component
- By Production Stage
- By Application
- By End Use
- By Technology
- By Country
- Market Attractiveness Analysis
- By Country
- By Component
- By Production Stage
- By Application
- By End Use
- By Technology
- Key Takeaways
- Western Europe Market Analysis and Forecast, By Country
- Historical Market Size Value (USD Billion) Trend Analysis By Market Taxonomy, 2021 to 2025
- Market Size Value (USD Billion) Forecast By Market Taxonomy, 2026 to 2036
- By Country
- Germany
- UK
- Italy
- Spain
- France
- Nordic
- BENELUX
- Rest of Western Europe
- By Component
- By Production Stage
- By Application
- By End Use
- By Technology
- By Country
- Market Attractiveness Analysis
- By Country
- By Component
- By Production Stage
- By Application
- By End Use
- By Technology
- Key Takeaways
- Eastern Europe Market Analysis and Forecast, By Country
- Historical Market Size Value (USD Billion) Trend Analysis By Market Taxonomy, 2021 to 2025
- Market Size Value (USD Billion) Forecast By Market Taxonomy, 2026 to 2036
- By Country
- Russia
- Poland
- Hungary
- Balkan & Baltic
- Rest of Eastern Europe
- By Component
- By Production Stage
- By Application
- By End Use
- By Technology
- By Country
- Market Attractiveness Analysis
- By Country
- By Component
- By Production Stage
- By Application
- By End Use
- By Technology
- Key Takeaways
- East Asia Market Analysis and Forecast, By Country
- Historical Market Size Value (USD Billion) Trend Analysis By Market Taxonomy, 2021 to 2025
- Market Size Value (USD Billion) Forecast By Market Taxonomy, 2026 to 2036
- By Country
- China
- Japan
- South Korea
- By Component
- By Production Stage
- By Application
- By End Use
- By Technology
- By Country
- Market Attractiveness Analysis
- By Country
- By Component
- By Production Stage
- By Application
- By End Use
- By Technology
- Key Takeaways
- South Asia and Pacific Market Analysis and Forecast, By Country
- Historical Market Size Value (USD Billion) Trend Analysis By Market Taxonomy, 2021 to 2025
- Market Size Value (USD Billion) Forecast By Market Taxonomy, 2026 to 2036
- By Country
- India
- ASEAN
- Australia & New Zealand
- Rest of South Asia and Pacific
- By Component
- By Production Stage
- By Application
- By End Use
- By Technology
- By Country
- Market Attractiveness Analysis
- By Country
- By Component
- By Production Stage
- By Application
- By End Use
- By Technology
- Key Takeaways
- Middle East & Africa Market Analysis and Forecast, By Country
- Historical Market Size Value (USD Billion) Trend Analysis By Market Taxonomy, 2021 to 2025
- Market Size Value (USD Billion) Forecast By Market Taxonomy, 2026 to 2036
- By Country
- Kingdom of Saudi Arabia
- Other GCC Countries
- Türkiye
- South Africa
- Other African Union
- Rest of Middle East & Africa
- By Component
- By Production Stage
- By Application
- By End Use
- By Technology
- By Country
- Market Attractiveness Analysis
- By Country
- By Component
- By Production Stage
- By Application
- By End Use
- By Technology
- Key Takeaways
- Key Countries Market Analysis
- USA
- Pricing Analysis
- Market Share Analysis, 2025
- By Component
- By Production Stage
- By Application
- By End Use
- By Technology
- Canada
- Pricing Analysis
- Market Share Analysis, 2025
- By Component
- By Production Stage
- By Application
- By End Use
- By Technology
- Mexico
- Pricing Analysis
- Market Share Analysis, 2025
- By Component
- By Production Stage
- By Application
- By End Use
- By Technology
- Brazil
- Pricing Analysis
- Market Share Analysis, 2025
- By Component
- By Production Stage
- By Application
- By End Use
- By Technology
- Chile
- Pricing Analysis
- Market Share Analysis, 2025
- By Component
- By Production Stage
- By Application
- By End Use
- By Technology
- Germany
- Pricing Analysis
- Market Share Analysis, 2025
- By Component
- By Production Stage
- By Application
- By End Use
- By Technology
- UK
- Pricing Analysis
- Market Share Analysis, 2025
- By Component
- By Production Stage
- By Application
- By End Use
- By Technology
- Italy
- Pricing Analysis
- Market Share Analysis, 2025
- By Component
- By Production Stage
- By Application
- By End Use
- By Technology
- Spain
- Pricing Analysis
- Market Share Analysis, 2025
- By Component
- By Production Stage
- By Application
- By End Use
- By Technology
- France
- Pricing Analysis
- Market Share Analysis, 2025
- By Component
- By Production Stage
- By Application
- By End Use
- By Technology
- India
- Pricing Analysis
- Market Share Analysis, 2025
- By Component
- By Production Stage
- By Application
- By End Use
- By Technology
- ASEAN
- Pricing Analysis
- Market Share Analysis, 2025
- By Component
- By Production Stage
- By Application
- By End Use
- By Technology
- Australia & New Zealand
- Pricing Analysis
- Market Share Analysis, 2025
- By Component
- By Production Stage
- By Application
- By End Use
- By Technology
- China
- Pricing Analysis
- Market Share Analysis, 2025
- By Component
- By Production Stage
- By Application
- By End Use
- By Technology
- Japan
- Pricing Analysis
- Market Share Analysis, 2025
- By Component
- By Production Stage
- By Application
- By End Use
- By Technology
- South Korea
- Pricing Analysis
- Market Share Analysis, 2025
- By Component
- By Production Stage
- By Application
- By End Use
- By Technology
- Russia
- Pricing Analysis
- Market Share Analysis, 2025
- By Component
- By Production Stage
- By Application
- By End Use
- By Technology
- Poland
- Pricing Analysis
- Market Share Analysis, 2025
- By Component
- By Production Stage
- By Application
- By End Use
- By Technology
- Hungary
- Pricing Analysis
- Market Share Analysis, 2025
- By Component
- By Production Stage
- By Application
- By End Use
- By Technology
- Kingdom of Saudi Arabia
- Pricing Analysis
- Market Share Analysis, 2025
- By Component
- By Production Stage
- By Application
- By End Use
- By Technology
- Türkiye
- Pricing Analysis
- Market Share Analysis, 2025
- By Component
- By Production Stage
- By Application
- By End Use
- By Technology
- South Africa
- Pricing Analysis
- Market Share Analysis, 2025
- By Component
- By Production Stage
- By Application
- By End Use
- By Technology
- USA
- Market Structure Analysis
- Competition Dashboard
- Competition Benchmarking
- Market Share Analysis of Top Players
- By Regional
- By Component
- By Production Stage
- By Application
- By End Use
- By Technology
- Emerging Startups
- Innovation Benchmarking
- Competition Analysis
- Competition Deep Dive
- Epic Games, Inc.
- Overview
- Product Portfolio
- Profitability by Market Segments
- Sales Footprint
- Strategy Overview
- Marketing Strategy
- Product Strategy
- Channel Strategy
- The Foundry Visionmongers Ltd.
- Sony Corporation
- NVIDIA Corporation
- Disguise Technologies Ltd.
- Mo-Sys Engineering Ltd.
- ARRI AG
- ROE Visual Co., Ltd.
- Dimension Studio
- Lux Machina Consulting
- Others
- Epic Games, Inc.
- Case Studies
- Success Stories
- Recent Developments
- Competition Deep Dive
- Assumptions & Acronyms Used


