

- Market Size (2026)
- USD 2380.6 Mn
- Forecast (2036)
- USD 4510.9 Mn
- CAGR (2026 to 2036)
- 6.6%
How big is the Water Repellent Textile Finishes Market?
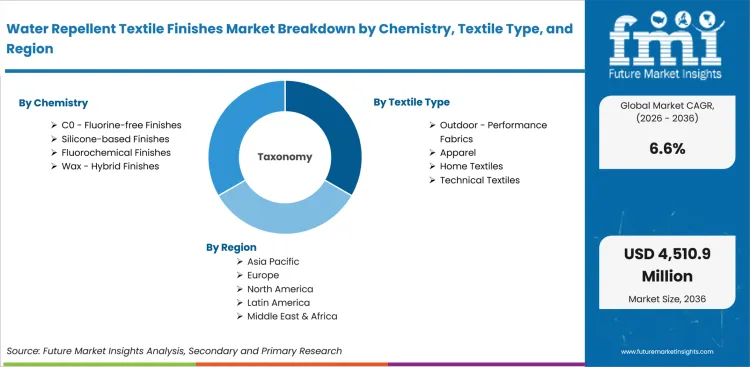
The Water Repellent Textile Finishes Market is projected to grow from USD 2380.6 million in 2026 to USD 4510.9 million by 2036, at a CAGR of 6.6%.
The Water Repellent Textile Finishes Market was valued at USD 2,233.2 million in 2025 and is expected to reach USD 2380.6 million in 2026. Sales are forecast to reach USD 4510.9 million by 2036 at a CAGR of 6.6% from 2026 to 2036. C0 / Fluorine-free Finishes are projected to account for a 47.0% share in 2026 as brands move away from fluorinated treatment chemistry.
The European Environment Agency reported in September 2024 that textiles account for about 35% of total global PFAS demand and noted that feasible alternatives already exist for many textile uses.
This shifts mill selection toward finishes with wash durability, soft hand feel, and proof of restricted-substance compliance.
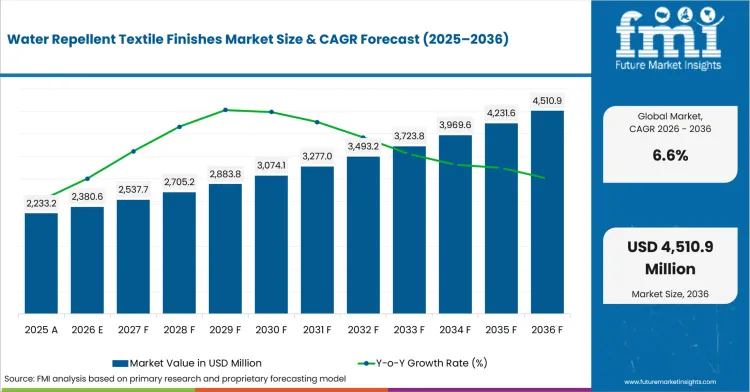
| Metric | Value |
|---|---|
| 2025 Market Size | USD 2,233.2 million |
| 2026 Market Size | USD 2,380.6 million |
| 2036 Market Size | USD 4,510.9 million |
| Forecast CAGR (2026-2036) | 6.6% |
| Leading Chemistry | C0 / Fluorine-free Finishes |
| C0 / Fluorine-free Finishes Share (2026) | 47.0% |
| Leading Textile Type | Outdoor / Performance Fabrics |
| Outdoor / Performance Fabrics Share (2026) | 34.0% |
| Fastest-growing Country | China |
| China CAGR by 2036 | 7.4% |
Summary of the Water Repellent Textile Finishes Market
| Market Signal | Commercial Impact |
|---|---|
| Demand and Growth Drivers | Demand for textile water repellent finishes is increasing as apparel brands and textile manufacturers shift toward PFAS-free chemistries while maintaining durable water repellency, fabric comfort, and regulatory compliance.
|
| Product and Segment View | C0 fluorine-free finishes, outdoor performance fabrics, and sportswear applications continue to represent the leading commercial opportunities across the market.
|
| Geography and Growth Outlook | Asia and Europe continue to shape market development through textile manufacturing capacity, sustainability regulations, and demand for high-performance fabrics.
|
| Competitive Landscape | Competition increasingly focuses on fluorine-free chemistry performance, regulatory compliance, textile application expertise, and mill-level technical support.
|
| Analyst Perspective | Textile water repellent finishes are evolving from conventional fabric treatments into performance and compliance solutions that support sustainable textile manufacturing.
- Nikhil Kaitwade, Principal Consultant at Future Market Insights |
Why is the Water Repellent Textile Finishes Market growing?
PFAS regulation pushes mills toward C0 formulations as brands reduce restricted-substance risk in apparel and home textiles. Sportswear buyers specify water beading on light fabrics since repellency must preserve breathability and hand feel.
- PFAS regulation pushes mills toward C0 formulations as brands reduce restricted-substance risk in apparel and home textiles.
- Sportswear buyers specify water beading on light fabrics since repellency must preserve breathability and hand feel.
- Technical textile producers use durable finishes for awnings and outdoor covers as exposure time affects warranty risk.
Apparel brands are changing finish specifications before all regional rules are fully aligned. The Minnesota Pollution Control Agency said the first prohibitions on intentionally added PFAS took effect on January 1, 2025 across 11 product categories, including fabric treatments and textile furnishings. This makes chemical disclosure part of the supplier shortlisting process. Mills serving United States buyers now compare repellency with compliance documentation before bulk approval. Finish suppliers with C0 portfolios gain from this shift as buyers want fewer regulatory exceptions and less inventory segregation. Performance risk is the second reason buyers are paying for stronger technical support.
How is the Water Repellent Textile Finishes Market segmented?
The Water Repellent Textile Finishes Market is segmented by chemistry, textile type, application, durability, sales channel, and region.
- With an estimated 47.0% share in 2026, C0 / Fluorine-free Finishes are expected to lead the chemistry category as brands reduce PFAS exposure.
- Outdoor / Performance Fabrics are projected to account for a 34.0% share in 2026 since rain protection is a visible consumer promise.
- Sportswear buyers are expected to direct 36.0% of the application category toward finishes that keep fabric light and breathable.
How does C0 / Fluorine-free Finishes contribute to the chemistry category?
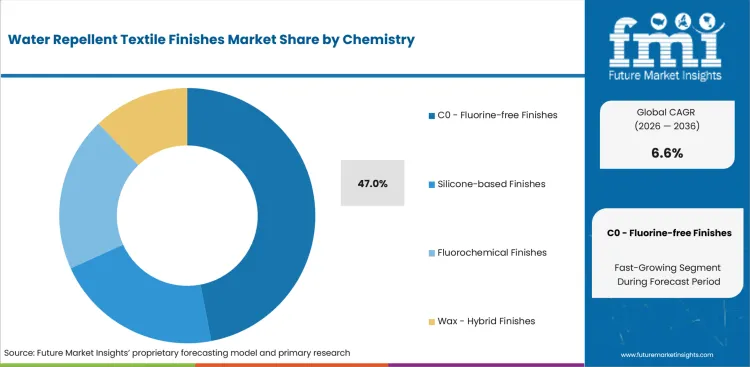
- C0 / Fluorine-free Finishes are projected to account for a 47.0% share in 2026 as apparel brands remove intentional fluorine use from water repellent claims.
- Buyers in this segment compare wash durability and hand feel after finishing since C0 systems can lose performance if curing windows are poorly controlled.
What supports demand for Outdoor / Performance Fabrics?
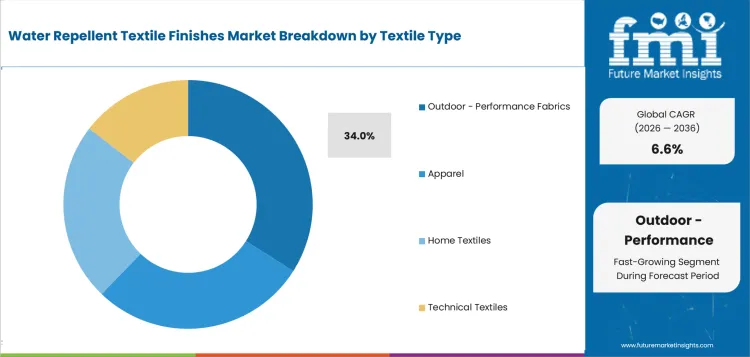
- Outdoor / Performance Fabrics are estimated to hold a 34.0% share in 2026 as jackets, hiking pants, and gear fabrics need visible water beading.
- Brand qualification is strict in this segment as fabric failure creates consumer returns faster than color or shrinkage issues.
How do buyers evaluate Sportswear within the application category?
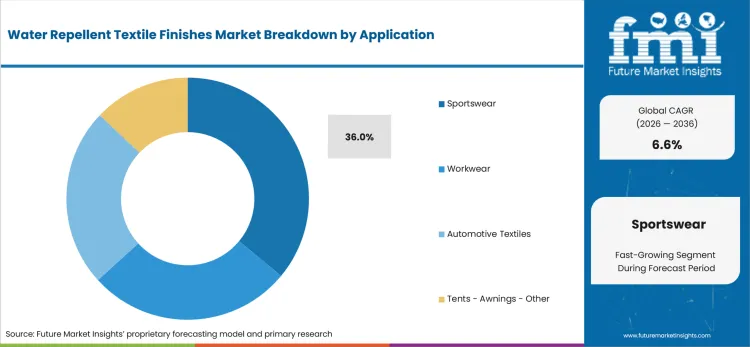
- Sportswear is anticipated to account for a 36.0% share in 2026 as activewear buyers seek light rain protection without blocking moisture movement.
- Finish recipes must protect stretch recovery on elastane blends since poor chemistry choice can weaken fabric movement after repeated washing.
What market factors influence demand for Durable Water Repellent?
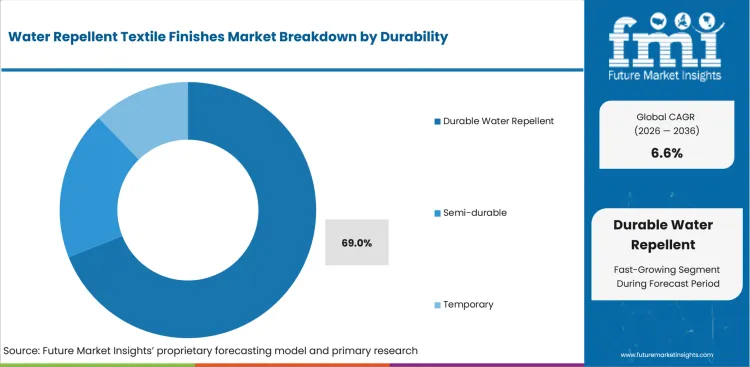
- Durable Water Repellent is expected to represent a 69.0% share in 2026 as mills sell long-wash performance into outerwear and workwear.
- Durability claims require repeated laundering tests, which raises the value of crosslinker systems and lowers acceptance of short-life temporary repellents.
How does Direct to Mills affect the sales channel outlook?
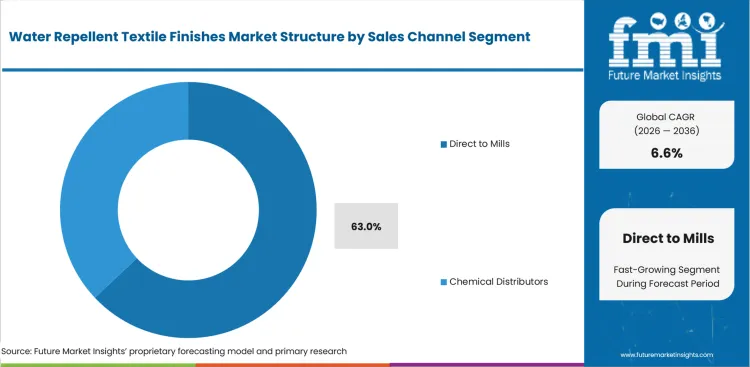
- Direct to Mills are projected to hold a 63.0% share in 2026 as suppliers support padding concentration, drying temperature, and curing trials.
- Distributors stay relevant for smaller mills, but large export programs prefer direct technical sign-off before bulk production starts.
What drives and restrains the market?
Driver: PFAS rule tightening drives reformulation work as textile buyers lower chemical risk before final enforcement dates; restraint: The main restraint is the performance gap on oil repellency since many fluorine-free systems repel water better than oils; opportunity: wash-durable C0 performance creates opportunity as suppliers replace fluorocarbon systems without losing fabric comfort.
The market reflects a balance between the identified demand driver, adoption constraints, and the supplier opportunity outlined below.
- Driver: PFAS rule tightening drives reformulation work as textile buyers lower chemical risk before final enforcement dates.
- Restraint: The main restraint is the performance gap on oil repellency since many fluorine-free systems repel water better than oils.
- Opportunity: wash-durable C0 performance creates opportunity as suppliers replace fluorocarbon systems without losing fabric comfort.
PFAS-Free Recipe Conversion: Recipe conversion is now a technical selling process rather than a simple product swap. The European Commission describes PFAS as highly persistent chemicals used in water-repellent textiles and other products. This regulatory framing raises the cost of using older fluorinated chemistries in consumer-facing goods. Buyers now ask suppliers to support mill trials that prove water beading, wash life, and compliance records together. The practical result is a stronger market for suppliers with application laboratories and C0 product breadth.
Oil Repellency Gap: The core restraint is the loss of oil and soil repellency after moving away from fluorinated chemistry. C0 systems can deliver strong water beading, but many buyers accept a narrower performance profile on oily stains. This affects workwear, upholstery, and transport textiles more than sportswear. Suppliers can offset the gap through hybrid systems, boosters, and better fabric pretreatment. The opportunity sits with companies able to explain the performance trade-off clearly before buyers approve new specifications.
Which factors support expansion?
Commercial expansion is reinforced by the value, workflow, and recurring-demand factors below.
- Value is rising as brands replace older fluorochemical finishes with C0 systems that need more trial support and higher formulation control.
- Outdoor fabrics lift average selling prices since buyers require wash durability, soft hand feel, and breathable rain protection together.
- Home textile demand supports stable volume as upholstery and furnishing buyers seek stain resistance without restricted chemistry risk.
Which country markets are included in the CAGR comparison?
The selected CAGR comparison covers China (7.4%), India (7.1%), South Korea (6.8%), United States (6.4%), and Germany (6.2%) through 2036.
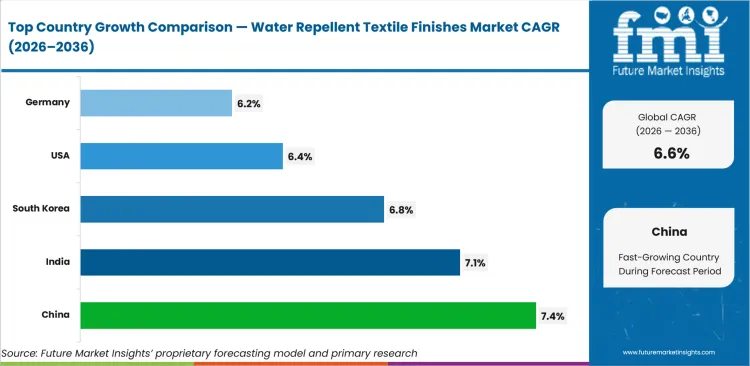
| Country | CAGR |
|---|---|
| China | 7.4% |
| India | 7.1% |
| South Korea | 6.8% |
| United States | 6.4% |
| Germany | 6.2% |
Source: Future Market Insights analysis.
How do country-level CAGRs compare?
- China (CAGR: 7.4%): China’s large textile finishing base supports the country outlook.
- India (CAGR: 7.1%): India has large apparel, cotton, and technical textile production capacity.
- South Korea (CAGR: 6.8%): South Korea supplies synthetic fibers, fashion fabrics, and performance textile programs.
- United States (CAGR: 6.4%): United States demand is shaped by regulation first and product performance second.
- Germany (CAGR: 6.2%): Germany demand is shaped by technical textile discipline and EU chemicals policy.
The global Water Repellent Textile Finishes Market is forecast to record a CAGR of 6.6% from 2026 to 2036. The study covers 30+ countries across the report regions.
How is the Water Repellent Textile Finishes Market developing in China?
China is projected to record a CAGR of 7.4% through 2036. The country outlook identifies this demand signal: China’s large textile finishing base supports the country outlook.
Country Market Snapshot
| Country | China |
|---|---|
| Forecast CAGR | 7.4% |
| Demand anchor | China’s large textile finishing base supports the country outlook. |
| Local proof | Archroma showcased PHOBOTEX® NTR-50 at China Interdye 2024 for activewear and outdoor fabrics. |
| Channel route | Large mills buy directly when export buyers require approved recipes. |
| Restraint | Price competition is intense among regional finish suppliers. |
| Application mix | Activewear, outdoor fabrics, tenting, and export apparel carry demand. |
| Competitive context | Archroma, RUDOLF, and local chemical suppliers compete in mill approvals. |
| Company context | Companies active in or serving this market include Archroma, RUDOLF, NICCA Chemical, Daikin, and Pulcra Chemicals. |
Market Outlook
China has strong volume pull because it combines large-scale finishing capacity with export compliance pressure. Archroma presented its bio-based PHOBOTEX® NTR-50 durable water repellent finish at China Interdye 2024 for activewear, athleisure, and outdoor segments. The company said the finish is based on 50% sustainably sourced renewable feedstock and is PFAS-free. This type of product launch fits Chinese mills serving global brands. China is forecast to grow at a CAGR of 7.4% through 2036 as exporters convert recipes for Western buyers.
Key Growth Drivers
- Export mills change recipes to meet United States and European buyer chemical rules.
- Activewear and outdoor fabric capacity supports steady demand for durable repellency.
- Large finishing clusters can scale approved C0 recipes quickly after brand sign-off.
- China’s large textile finishing base supports the country outlook.
Key Restraints
- Price pressure can limit uptake of premium bio-based finishes.
- Smaller mills may lack testing systems for wash durability and restricted substances.
- Price competition is intense among regional finish suppliers.
Country Market FAQs
What should C-suite teams prioritize in China?
C-suite teams should prioritize qualification requirements, procurement routes, local service coverage, and implementation economics before committing capital or supplier volume.
How should suppliers approach the China market?
Suppliers should align technical evidence, local channel support, and account-specific commercial terms with the buying process used by major customers in China.
What can weaken the business case in China?
Price competition is intense among regional finish suppliers. Executives should test this exposure during supplier, investment, and rollout reviews.
How is the Water Repellent Textile Finishes Market developing in India?
India is projected to record a CAGR of 7.1% through 2036. The country outlook identifies this demand signal: India has large apparel, cotton, and technical textile production capacity.
Country Market Snapshot
| Country | India |
|---|---|
| Forecast CAGR | 7.1% |
| Demand anchor | India has large apparel, cotton, and technical textile production capacity. |
| Local proof | India’s textile ministry reported direct textile employment of about 45 million people. |
| Channel route | Chemical distributors serve many small and mid-sized mills across clusters. |
| Restraint | Price sensitivity can slow premium C0 uptake outside export programs. |
| Application mix | Apparel, workwear, home textiles, and technical textiles drive finish consumption. |
| Competitive context | Sarex Chemicals and Pulcra Chemicals are relevant India-linked suppliers. |
| Company context | Companies active in or serving this market include Sarex Chemicals, Rossari Biotech, Archroma India, RUDOLF Atul Chemicals, and Pulcra Chemicals India. |
Market Outlook
India demand is broad because textile processing covers export apparel and domestic fabric consumption. India’s textile ministry annual report states that the sector provides direct employment to about 45 million people and supports over 100 million people indirectly. This large production network creates a wide mill base for finishing chemicals. Export-facing mills are the first to test PFAS-free water repellents because overseas buyers require cleaner chemical documentation. The Indian buying route is split between direct supplier support and distributor-led mill service.
Key Growth Drivers
- Export apparel mills adopt PFAS-free finishes to meet Western buyer requirements.
- Technical textile programs expand demand for durable repellency in industrial fabrics.
- Distributor networks help smaller textile clusters access finish recipes and support.
- India has large apparel, cotton, and technical textile production capacity.
Key Restraints
- Cost-sensitive mills can delay conversion when buyers do not require PFAS-free claims.
- Uneven testing access creates quality gaps across smaller processing clusters.
- Price sensitivity can slow premium C0 uptake outside export programs.
Country Market FAQs
What should C-suite teams prioritize in India?
C-suite teams should prioritize qualification requirements, procurement routes, local service coverage, and implementation economics before committing capital or supplier volume.
How should suppliers approach the India market?
Suppliers should align technical evidence, local channel support, and account-specific commercial terms with the buying process used by major customers in India.
What can weaken the business case in India?
Price sensitivity can slow premium C0 uptake outside export programs. Executives should test this exposure during supplier, investment, and rollout reviews.
How is the Water Repellent Textile Finishes Market developing in South Korea?
South Korea is projected to record a CAGR of 6.8% through 2036. The country outlook identifies this demand signal: South Korea supplies synthetic fibers, fashion fabrics, and performance textile programs.
Country Market Snapshot
| Country | South Korea |
|---|---|
| Forecast CAGR | 6.8% |
| Demand anchor | South Korea supplies synthetic fibers, fashion fabrics, and performance textile programs. |
| Local proof | InvestKOREA identifies fabric and dyeing or processing as a key midstream textile activity. |
| Channel route | Buyers use trading networks and direct supplier support for export fabrics. |
| Restraint | Retail softness can affect apparel fabric order timing. |
| Application mix | Synthetic sportswear, outdoor fabrics, and technical textiles shape demand. |
| Competitive context | Global and regional finishing-chemical suppliers compete through mill qualification, technical service, and local channel coverage. |
| Company context | Companies active in or serving this market include NICCA Chemical, Daikin, Archroma, RUDOLF, and TANATEX Chemicals. |
Market Outlook
South Korea demand is tied to synthetic textile competence and export-oriented fabric development. InvestKOREA describes the industry structure across upstream yarns, midstream fabric and dyeing or processing, and downstream clothing. This supports water repellent finish use because finishing sits inside the value-adding midstream. Korean buyers often seek finishes that work well on polyester and nylon blends used in outdoor clothing. The market also faces consumer demand swings in apparel.
Key Growth Drivers
- Polyester and nylon fabric strengths support water repellent sportswear applications.
- Export buyers push Korean mills toward safer finish portfolios.
- Midstream dyeing and processing networks can add repellency as a value step.
- South Korea supplies synthetic fibers, fashion fabrics, and performance textile programs.
Key Restraints
- Apparel order cycles can delay finish purchases during retail slowdowns.
- Smaller mills may need distributor support for recipe adjustment and testing.
- Retail softness can affect apparel fabric order timing.
Country Market FAQs
What should C-suite teams prioritize in South Korea?
C-suite teams should prioritize qualification requirements, procurement routes, local service coverage, and implementation economics before committing capital or supplier volume.
How should suppliers approach the South Korea market?
Suppliers should align technical evidence, local channel support, and account-specific commercial terms with the buying process used by major customers in South Korea.
What can weaken the business case in South Korea?
Retail softness can affect apparel fabric order timing. Executives should test this exposure during supplier, investment, and rollout reviews.
How is the Water Repellent Textile Finishes Market developing in the United States?
The United States is projected to record a CAGR of 6.4% through 2036. The country outlook identifies this demand signal: California and Minnesota rules push brands toward unified PFAS-free textile specifications.
Country Market Snapshot
| Country | United States |
|---|---|
| Forecast CAGR | 6.4% |
| Regulation signal | Minnesota prohibited intentionally added PFAS in fabric treatments from January 1, 2025. |
| Buyer anchor | Outdoor apparel and home furnishings buyers are shifting specifications toward C0 chemistry. |
| Channel route | Large mills prefer direct supplier support for pad-dry-cure trial settings. |
| Restraint | State-by-state PFAS rules raise compliance cost for national product programs. |
| Application mix | Performance apparel, upholstery, and technical fabrics drive substantial premium finish demand. |
| Competitive context | Archroma, Nicca USA, and Bolger & O’Hearn have visible United States relevance. |
| Company context | Companies active in or serving this market include Bolger & O’Hearn, NICCA USA, Archroma, Goulston Technologies, and Pulcra Chemicals. |
Market Outlook
United States demand is shaped by regulation first and product performance second. The Minnesota Pollution Control Agency lists fabric treatments and textile furnishings among 11 product categories subject to 2025 PFAS prohibitions. This makes compliance records part of chemical selection for mills serving national brands. The rule affects buying behavior beyond Minnesota since national retailers prefer one specification across states. Suppliers with PFAS-free options gain access to mill trials before lower-cost options are considered.
Key Growth Drivers
- California and Minnesota rules push brands toward unified PFAS-free textile specifications.
- Outdoor retail channels increase demand for C0 DWR on jackets and performance pants.
- Home furnishing buyers use safer finish claims to reduce exposure in consumer product audits.
- Performance apparel, upholstery, and technical fabrics drive substantial premium finish demand.
Key Restraints
- Multiple state laws create label and inventory complexity for national textile programs.
- C0 systems can need extra mill trials before matching older fluorochemical performance.
- State-by-state PFAS rules raise compliance cost for national product programs.
Country Market FAQs
What should C-suite teams prioritize in the United States?
C-suite teams should prioritize qualification requirements, procurement routes, local service coverage, and implementation economics before committing capital or supplier volume.
How should suppliers approach the United States market?
Suppliers should align technical evidence, local channel support, and account-specific commercial terms with the buying process used by major customers in the United States.
What can weaken the business case in the United States?
State-by-state PFAS rules raise compliance cost for national product programs. Executives should test this exposure during supplier, investment, and rollout reviews.
How is the Water Repellent Textile Finishes Market developing in Germany?
Germany is projected to record a CAGR of 6.2% through 2036. The country outlook identifies this demand signal: REACH-linked buyer pressure accelerates C0 testing in apparel and technical textiles.
Country Market Snapshot
| Country | Germany |
|---|---|
| Forecast CAGR | 6.2% |
| Policy context | Germany is one of the EU countries behind the broad PFAS restriction proposal. |
| Buyer anchor | Workwear and technical textile buyers place high weight on durability proof. |
| Supply structure | German chemical know-how supports strong formulation and testing expectations. |
| Restraint | Energy and compliance costs pressure local textile finishing margins. |
| Application mix | Technical textiles, protective wear, and outdoor fabrics support value demand. |
| Competitive context | RUDOLF and Archroma are visible in Germany-linked technical finishing supply. |
| Company context | Companies active in or serving this market include RUDOLF, Pulcra Chemicals, Archroma, TANATEX Chemicals, and CHT Germany. |
Market Outlook
Germany demand is shaped by technical textile discipline and EU chemicals policy. The European Environment Agency notes that Denmark, Germany, the Netherlands, Norway, and Sweden brought forward the broad PFAS restriction proposal under REACH. This gives German buyers early reason to test safer finishes before final regulatory outcomes. It also makes supplier documentation and product stewardship more important in mill approval. German mills tend to test performance across laundering, abrasion, and hand feel before switching formulations.
Key Growth Drivers
- REACH-linked buyer pressure accelerates C0 testing in apparel and technical textiles.
- German workwear users need wash-durable finishes for rental laundry cycles.
- Technical textile converters favor suppliers with strong lab and application support.
- Technical textiles, protective wear, and outdoor fabrics support value demand.
Key Restraints
- Higher production costs make local mills sensitive to finish pickup and rework rates.
- Fluorine-free systems need tighter process control on some synthetic fabrics.
- Energy and compliance costs pressure local textile finishing margins.
Country Market FAQs
What should C-suite teams prioritize in Germany?
C-suite teams should prioritize qualification requirements, procurement routes, local service coverage, and implementation economics before committing capital or supplier volume.
How should suppliers approach the Germany market?
Suppliers should align technical evidence, local channel support, and account-specific commercial terms with the buying process used by major customers in Germany.
What can weaken the business case in Germany?
Energy and compliance costs pressure local textile finishing margins. Executives should test this exposure during supplier, investment, and rollout reviews.
Which companies are discussed in the Water Repellent Textile Finishes Market?
The preview discusses Archroma, RUDOLF, NICCA Chemical, Daikin, and TANATEX Chemicals among the companies active in this market.
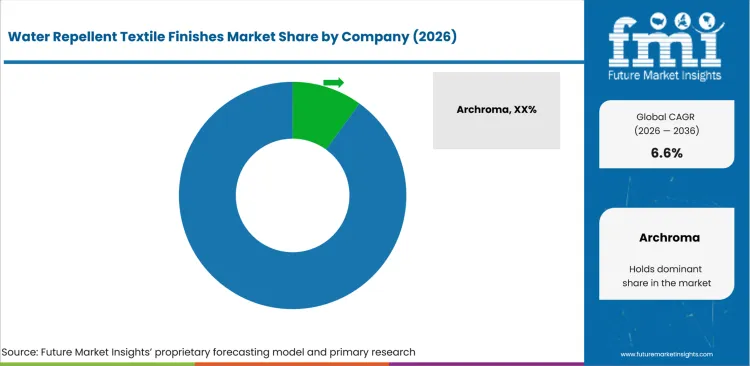
The market is moderately concentrated as global suppliers hold strong positions in C0 chemistry and application support. Established suppliers support on product breadth, mill trial support, and restricted-substance documentation. Specialists win where buyers need focused PFAS-free DWR performance and fast troubleshooting.
Entry barriers include wash durability proof, brand approval cycles, and process knowledge across fiber types. Competitive advantage is moving toward application proof rather than product listing alone. Archroma’s April 2024 PHOBOTEX® NTR-50 LIQ launch shows how suppliers position new repellents around PFAS-free status, renewable carbon content, and mill process performance.
How is competition structured?
Competition reflects differences in specialization, portfolio scope, geographic reach, evidence, and customer access.
Competition centers on chemistry breadth, mill service, and proof of PFAS-free performance.
- Global Leaders: Archroma, RUDOLF, NICCA Chemical, and Daikin hold stronger positions through broad textile chemistry knowledge and international customer access. Archroma offers PHOBOTEX durable water repellent systems. RUDOLF provides BIONIC-FINISH® ECO fluorine-free technology. Nicca offers NEOSEED fluorine-free repellents.
- Regional Players: TANATEX Chemicals, Pulcra Chemicals, Sarex Chemicals, and Maflon compete through textile finishing portfolios and regional mill relationships. These firms are important where buyers need fast application support and smaller production batches.
- Specialist Formulators: Bolger & O’Hearn and selected local suppliers compete through focused PFAS-free durable water repellent products and technical problem solving. This group is relevant for mills dealing with difficult fabrics or short approval windows.
How do selected companies compare?
The selected companies differ in portfolio focus, geographic reach, evidence depth, and channel strength.
| Company | Competitive position |
|---|---|
| Archroma | Archroma is assessed for formulation or material technology, technical support, qualification evidence, and regional channel reach. |
| RUDOLF | RUDOLF is assessed for formulation or material technology, technical support, qualification evidence, and regional channel reach. |
| NICCA Chemical | NICCA Chemical is assessed for formulation or material technology, technical support, qualification evidence, and regional channel reach. |
| Daikin | Daikin is assessed for formulation or material technology, technical support, qualification evidence, and regional channel reach. |
| TANATEX Chemicals | TANATEX Chemicals is assessed for formulation or material technology, technical support, qualification evidence, and regional channel reach. |
What are the key developments in the Water Repellent Textile Finishes Market?
- In April 2024, Archroma introduced PHOBOTEX NTR-50 LIQ, a bio-based durable water-repellent finish for outerwear and apparel fabrics. The launch supported PFAS-free conversion in apparel finishing.
- In April 2024, Archroma highlighted PHOBOTEX R-ACE at Techtextil 2024 for durable water repellency in technical textiles. The showcase reinforced performance-fabric opportunities.
- In March 2026, NICCA Chemical agreed to acquire the non-fluorinated Zelan water-repellent business from Chemours. The transaction expanded NICCA’s fluorine-free finishing portfolio.
Selected Companies in the Water Repellent Textile Finishes Market
Companies referenced in this preview
- Archroma.
- RUDOLF.
- NICCA Chemical.
- Daikin.
- TANATEX Chemicals.
- Pulcra Chemicals.
- Sarex Chemicals.
- Bolger & O’Hearn.
Market Scope & Definition
| Metric | Value |
|---|---|
| Market definition | Water repellent textile finishes are chemical treatments applied to fabric surfaces so water beads and rolls off without turning the fabric into a full waterproof barrier. |
| Functions covered | Apparel, Outdoor / Performance Fabrics, Home Textiles, Technical Textiles |
| End-use industries | Sportswear, Workwear, Automotive Textiles, Tents / Awnings / Other |
| Inclusions | Market scope covers commercially sold textile water repellent finishes by chemistry, textile type, application, durability level, sales channel, and selected country coverage across the United States, United Kingdom, Germany, France, Japan, China, South Korea, and India. |
| Exclusions | The scope excludes finished waterproof garments, membrane laminates, coated tarpaulin sheets, seam sealing tapes, laundry detergents, consumer spray protectors, and fluorochemical products sold only for paper or leather treatment. |
Research Methodology
| Metric | Value |
|---|---|
| Primary Research | FMI analysts reviewed input from textile chemical suppliers, fabric mills, apparel sourcing teams, and distributor sales managers active in functional finishing. Interviews focused on recipe selection, cost tolerance, mill qualification cycles, and rejection reasons during PFAS-free conversion. |
| Desk Research | Desk work covered regulatory pages, trade body updates, standards references, company product information, and public technical material on water repellency. The review separated direct water repellent finish evidence from broader textile chemicals evidence. |
| Market Sizing and Forecasting | The model combined finish consumption by fabric type, average formulation price, mill application rates, and country-level textile production exposure. Forecasting adjusted demand by regulation pressure, performance fabric use, and channel mix. |
| Data Validation | Forecasts were checked against textile chemicals activity, water-repellent fabric demand, company portfolios, and country sourcing patterns. Segment estimates were reviewed against product availability and buyer behavior in apparel and technical textiles. |
What does the report cover?
The report covers chemistry, textile type, application, durability, sales channel, and region across the 2026-2036 forecast period in 30+ countries.
| Metric | Value |
|---|---|
| Periods | Base year 2025; estimated year 2026; forecast period 2026-2036 |
| Segment axes | chemistry, textile type, application, durability, sales channel, and region |
| Regions | North America, Europe, East Asia, South Asia and Pacific, and selected global production and demand regions |
| Countries | United States, United Kingdom, Germany, France, Japan, China, South Korea, India and 30+ countries |
| Companies | Archroma, RUDOLF, NICCA Chemical, Daikin, TANATEX Chemicals, Pulcra Chemicals, Sarex Chemicals, Bolger & O’Hearn, and others |
| Approach | Hybrid bottom-up and top-down methodology using finish consumption, application rates, pricing, and country textile activity. |
Market Segmentation Analysis
Segmented by Chemistry
- C0 / Fluorine-free Finishes.
- Silicone-based Finishes.
- Fluorochemical Finishes.
- Wax / Hybrid Finishes.
Segmented by Textile Type
- Apparel.
- Outdoor / Performance Fabrics.
- Home Textiles.
- Technical Textiles.
Segmented by Application
- Sportswear.
- Workwear.
- Automotive Textiles.
- Tents / Awnings / Other.
Segmented by Durability
- Durable Water Repellent.
- Semi-durable.
- Temporary.
Segmented by Sales Channel
- Direct to Mills.
- Chemical Distributors.
By Region
- North America.
- United States.
- Canada.
- Mexico.
- Latin America.
- Brazil.
- Chile.
- Rest of Latin America.
- Western Europe.
- Germany.
- UK.
- Italy.
- Spain.
- France.
- Nordic.
- BENELUX.
- Rest of Western Europe.
- Eastern Europe.
- Russia.
- Poland.
- Hungary.
- Balkan & Baltic.
- Rest of Eastern Europe.
- East Asia.
- China.
- Japan.
- South Korea.
- South Asia and Pacific.
- India.
- ASEAN.
- Australia & New Zealand.
- Rest of South Asia and Pacific.
- Middle East & Africa.
- Kingdom of Saudi Arabia.
- Other GCC Countries.
- Turkiye.
- South Africa.
- Other African Union.
- Rest of Middle East & Africa.
Research Sources and Bibliography
- Archroma. (2024, April 22). Archroma introduces highly sustainable durable water repellent for outerwear and apparel fabrics that is softer and more durable. Archroma.
- Archroma. (2024, April 12). Archroma brings Planet Conscious Solutions to Techtextil 2024. Archroma.
- Archroma. (2024, April 11). Archroma brings Super Systems+ Solutions to China Interdye 2024. Archroma.
- European Environment Agency. (2024, September 17). PFAS in textiles in Europe’s circular economy. European Environment Agency.
- European Commission. (2026). PFAS pollution. European Commission.
- Minnesota Pollution Control Agency. (2025). 2025 PFAS prohibitions. Minnesota Pollution Control Agency.
- USA Environmental Protection Agency. (2026, April 21). Our current understanding of the human health and environmental risks of PFAS. USA EPA.
- Ministry of Textiles, Government of India. (2025, December). Annual report 2024-2025. Ministry of Textiles.
- NICCA Chemical Co., Ltd. (2026, March 24). NICCA Chemical to Acquire Non-Fluorinated Water Repellent Business “Zelan™” from The Chemours Company. NICCA Chemical.
- RUDOLF. (2026). BIONIC-FINISH® ECO. RUDOLF.
- NICCA USA Inc. (2026). Fluorine-Free Water Repellent. NICCA USA.
- WRAP. (2025, October 28). UK Textiles Pact Annual Progress Update 2024-25. WRAP.
The bibliography is provided for reader reference and uses primary, official company, regulatory, government, or official trade body publications.
This Report Answers
- What is the projected value of the Water Repellent Textile Finishes Market in 2026?
- What value is forecast for the Water Repellent Textile Finishes Market by 2036?
- What CAGR is forecast for the Water Repellent Textile Finishes Market from 2026 to 2036?
- What 2026 share is projected for C0 / Fluorine-free Finishes within the chemistry category?
- What 2026 share is projected for Outdoor / Performance Fabrics within the textile type category?
- Which demand factors support the Water Repellent Textile Finishes Market outlook?
- Which restraints and opportunities affect adoption in the Water Repellent Textile Finishes Market?
- How are country CAGR outlooks, including China at 7.4%, compared?
- Which companies and product developments are covered in the competitive analysis?
- What is included in the market scope, and how is the forecast validated?
Frequently Asked Questions
Why should executives track the Water Repellent Textile Finishes Market?
Executives should track this market because it can affect capital allocation, supplier strategy, operating risk, and competitive positioning across commercial planning cycles.
What business problem does the Water Repellent Textile Finishes Market address?
It helps executive teams judge where customer pain, supplier capability, compliance exposure, and implementation economics justify investment, procurement, or portfolio action.
What should procurement leaders evaluate before selecting suppliers?
Procurement leaders should assess evidence quality, integration fit, service coverage, compliance readiness, total cost of ownership, and supplier execution capability.
What can limit return on investment for buyers?
Return on investment can be limited by low utilization, integration delays, training gaps, unclear ownership, pricing pressure, or weak fit with existing workflows.
How can suppliers build executive confidence?
Suppliers can build confidence by proving implementation speed, risk reduction, support depth, reference use cases, and measurable outcomes for budget owners.
Preview the report firsthand - request a free sample
Get SampleGet the brochure for pricing and purchase details.
Get PDFTable of Content
- Key Takeaways
- Market Size and CAGR
- Top Growth Driver
- Fastest Growing Segment
- Leading Region
- Key Companies
- Emerging Opportunities
- Executive Summary
- Global Market Outlook
- Demand-side Trends
- Supply-side Trends
- Technology Roadmap Analysis
- Analysis and Recommendations
- Analyst Perspective (What is happening? Why now? What should investors know?)
- Key Questions Answered
- How large is the market?
- What is the CAGR?
- What are key trends?
- Which region dominates?
- Who are the leaders?
- Market Overview
- Market Coverage / Taxonomy
- Market Definition / Scope / Limitations
- Research Methodology
- Chapter Orientation
- Analytical Lens and Working Hypotheses
- Market Structure, Signals, and Trend Drivers
- Benchmarking and Cross-market Comparability
- Market Sizing, Forecasting, and Opportunity Mapping
- Research Design and Evidence Framework
- Desk Research Programme (Secondary Evidence)
- Expert Input and Fieldwork (Primary Evidence)
- Tooling, Models, and Reference Databases
- Data Engineering and Model Build
- Quality Assurance and Audit Trail
- Market Background
- Market Dynamics (Drivers, Restraints, Opportunity, Trends)
- Scenario Forecast (Optimistic, Likely, Conservative)
- Impact Analysis
- AI Impact
- Sustainability Impact
- Regulatory Impact
- Technology Impact
- Consumer / Buyer Analysis
- Purchase Drivers
- Adoption Barriers
- Buyer Journey
- Opportunity Map Analysis
- Product Life Cycle Analysis
- Supply Chain Analysis
- Investment Feasibility Matrix
- Value Chain Analysis
- PESTLE and Porter's Analysis
- Regulatory Landscape
- Regional Parent Market Outlook
- Production and Consumption Statistics
- Import and Export Statistics
- Global Market Analysis and Forecast, 2021 to 2036
- Historical Market Size Value (USD Billion) & Volume (Unit) Analysis, 2021 to 2025
- Current and Future Market Size Value (USD Billion) & Volume (Unit) Projections, 2026 to 2036
- Y-o-Y Growth Trend Analysis
- Absolute $ Opportunity Analysis
- Global Market Pricing Analysis, 2021 to 2036
- Global Market Analysis and Forecast, By Chemistry, 2021 to 2036
- Introduction / Key Findings
- Historical Market Size Value (USD Billion) & Volume (Unit) Analysis By Chemistry, 2021 to 2025
- Current and Future Market Size Value (USD Billion) & Volume (Unit) Analysis and Forecast By Chemistry, 2026 to 2036
- C0 - Fluorine-free Finishes
- Silicone-based Finishes
- Fluorochemical Finishes
- Wax - Hybrid Finishes
- C0 - Fluorine-free Finishes
- Y-o-Y Growth Trend Analysis By Chemistry, 2021 to 2025
- Absolute $ Opportunity Analysis By Chemistry, 2026 to 2036
- Global Market Analysis and Forecast, By Textile Type, 2021 to 2036
- Introduction / Key Findings
- Historical Market Size Value (USD Billion) & Volume (Unit) Analysis By Textile Type, 2021 to 2025
- Current and Future Market Size Value (USD Billion) & Volume (Unit) Analysis and Forecast By Textile Type, 2026 to 2036
- Outdoor - Performance Fabrics
- Apparel
- Home Textiles
- Technical Textiles
- Outdoor - Performance Fabrics
- Y-o-Y Growth Trend Analysis By Textile Type, 2021 to 2025
- Absolute $ Opportunity Analysis By Textile Type, 2026 to 2036
- Global Market Analysis and Forecast, By Application, 2021 to 2036
- Introduction / Key Findings
- Historical Market Size Value (USD Billion) & Volume (Unit) Analysis By Application, 2021 to 2025
- Current and Future Market Size Value (USD Billion) & Volume (Unit) Analysis and Forecast By Application, 2026 to 2036
- Sportswear
- Workwear
- Automotive Textiles
- Tents - Awnings - Other
- Sportswear
- Y-o-Y Growth Trend Analysis By Application, 2021 to 2025
- Absolute $ Opportunity Analysis By Application, 2026 to 2036
- Global Market Analysis and Forecast, By Durability, 2021 to 2036
- Introduction / Key Findings
- Historical Market Size Value (USD Billion) & Volume (Unit) Analysis By Durability, 2021 to 2025
- Current and Future Market Size Value (USD Billion) & Volume (Unit) Analysis and Forecast By Durability, 2026 to 2036
- Durable Water Repellent
- Semi-durable
- Temporary
- Durable Water Repellent
- Y-o-Y Growth Trend Analysis By Durability, 2021 to 2025
- Absolute $ Opportunity Analysis By Durability, 2026 to 2036
- Global Market Analysis and Forecast, By Sales Channel, 2021 to 2036
- Introduction / Key Findings
- Historical Market Size Value (USD Billion) & Volume (Unit) Analysis By Sales Channel, 2021 to 2025
- Current and Future Market Size Value (USD Billion) & Volume (Unit) Analysis and Forecast By Sales Channel, 2026 to 2036
- Direct to Mills
- Chemical Distributors
- Direct to Mills
- Y-o-Y Growth Trend Analysis By Sales Channel, 2021 to 2025
- Absolute $ Opportunity Analysis By Sales Channel, 2026 to 2036
- Global Market Analysis and Forecast, By Region, 2021 to 2036
- Introduction
- Historical Market Size Value (USD Billion) & Volume (Unit) Analysis By Region, 2021 to 2025
- Current Market Size Value (USD Billion) & Volume (Unit) Analysis and Forecast By Region, 2026 to 2036
- North America
- Latin America
- Western Europe
- Eastern Europe
- East Asia
- South Asia and Pacific
- Middle East & Africa
- Market Attractiveness Analysis By Region
- North America Market Analysis and Forecast, By Country, 2021 to 2036
- Historical Market Size Value (USD Billion) & Volume (Unit) Trend Analysis By Market Taxonomy, 2021 to 2025
- Market Size Value (USD Billion) & Volume (Unit) Forecast By Market Taxonomy, 2026 to 2036
- By Country
- USA
- Canada
- Mexico
- By Chemistry
- By Textile Type
- By Application
- By Durability
- By Sales Channel
- By Country
- Market Attractiveness Analysis
- By Country
- By Chemistry
- By Textile Type
- By Application
- By Durability
- By Sales Channel
- Key Takeaways
- Latin America Market Analysis and Forecast, By Country
- Historical Market Size Value (USD Billion) & Volume (Unit) Trend Analysis By Market Taxonomy, 2021 to 2025
- Market Size Value (USD Billion) & Volume (Unit) Forecast By Market Taxonomy, 2026 to 2036
- By Country
- Brazil
- Chile
- Rest of Latin America
- By Chemistry
- By Textile Type
- By Application
- By Durability
- By Sales Channel
- By Country
- Market Attractiveness Analysis
- By Country
- By Chemistry
- By Textile Type
- By Application
- By Durability
- By Sales Channel
- Key Takeaways
- Western Europe Market Analysis and Forecast, By Country
- Historical Market Size Value (USD Billion) & Volume (Unit) Trend Analysis By Market Taxonomy, 2021 to 2025
- Market Size Value (USD Billion) & Volume (Unit) Forecast By Market Taxonomy, 2026 to 2036
- By Country
- Germany
- UK
- Italy
- Spain
- France
- Nordic
- BENELUX
- Rest of Western Europe
- By Chemistry
- By Textile Type
- By Application
- By Durability
- By Sales Channel
- By Country
- Market Attractiveness Analysis
- By Country
- By Chemistry
- By Textile Type
- By Application
- By Durability
- By Sales Channel
- Key Takeaways
- Eastern Europe Market Analysis and Forecast, By Country
- Historical Market Size Value (USD Billion) & Volume (Unit) Trend Analysis By Market Taxonomy, 2021 to 2025
- Market Size Value (USD Billion) & Volume (Unit) Forecast By Market Taxonomy, 2026 to 2036
- By Country
- Russia
- Poland
- Hungary
- Balkan & Baltic
- Rest of Eastern Europe
- By Chemistry
- By Textile Type
- By Application
- By Durability
- By Sales Channel
- By Country
- Market Attractiveness Analysis
- By Country
- By Chemistry
- By Textile Type
- By Application
- By Durability
- By Sales Channel
- Key Takeaways
- East Asia Market Analysis and Forecast, By Country
- Historical Market Size Value (USD Billion) & Volume (Unit) Trend Analysis By Market Taxonomy, 2021 to 2025
- Market Size Value (USD Billion) & Volume (Unit) Forecast By Market Taxonomy, 2026 to 2036
- By Country
- China
- Japan
- South Korea
- By Chemistry
- By Textile Type
- By Application
- By Durability
- By Sales Channel
- By Country
- Market Attractiveness Analysis
- By Country
- By Chemistry
- By Textile Type
- By Application
- By Durability
- By Sales Channel
- Key Takeaways
- South Asia and Pacific Market Analysis and Forecast, By Country
- Historical Market Size Value (USD Billion) & Volume (Unit) Trend Analysis By Market Taxonomy, 2021 to 2025
- Market Size Value (USD Billion) & Volume (Unit) Forecast By Market Taxonomy, 2026 to 2036
- By Country
- India
- ASEAN
- Australia & New Zealand
- Rest of South Asia and Pacific
- By Chemistry
- By Textile Type
- By Application
- By Durability
- By Sales Channel
- By Country
- Market Attractiveness Analysis
- By Country
- By Chemistry
- By Textile Type
- By Application
- By Durability
- By Sales Channel
- Key Takeaways
- Middle East & Africa Market Analysis and Forecast, By Country
- Historical Market Size Value (USD Billion) & Volume (Unit) Trend Analysis By Market Taxonomy, 2021 to 2025
- Market Size Value (USD Billion) & Volume (Unit) Forecast By Market Taxonomy, 2026 to 2036
- By Country
- Kingdom of Saudi Arabia
- Other GCC Countries
- Türkiye
- South Africa
- Other African Union
- Rest of Middle East & Africa
- By Chemistry
- By Textile Type
- By Application
- By Durability
- By Sales Channel
- By Country
- Market Attractiveness Analysis
- By Country
- By Chemistry
- By Textile Type
- By Application
- By Durability
- By Sales Channel
- Key Takeaways
- Key Countries Market Analysis
- USA
- Pricing Analysis
- Market Share Analysis, 2025
- By Chemistry
- By Textile Type
- By Application
- By Durability
- By Sales Channel
- Canada
- Pricing Analysis
- Market Share Analysis, 2025
- By Chemistry
- By Textile Type
- By Application
- By Durability
- By Sales Channel
- Mexico
- Pricing Analysis
- Market Share Analysis, 2025
- By Chemistry
- By Textile Type
- By Application
- By Durability
- By Sales Channel
- Brazil
- Pricing Analysis
- Market Share Analysis, 2025
- By Chemistry
- By Textile Type
- By Application
- By Durability
- By Sales Channel
- Chile
- Pricing Analysis
- Market Share Analysis, 2025
- By Chemistry
- By Textile Type
- By Application
- By Durability
- By Sales Channel
- Germany
- Pricing Analysis
- Market Share Analysis, 2025
- By Chemistry
- By Textile Type
- By Application
- By Durability
- By Sales Channel
- UK
- Pricing Analysis
- Market Share Analysis, 2025
- By Chemistry
- By Textile Type
- By Application
- By Durability
- By Sales Channel
- Italy
- Pricing Analysis
- Market Share Analysis, 2025
- By Chemistry
- By Textile Type
- By Application
- By Durability
- By Sales Channel
- Spain
- Pricing Analysis
- Market Share Analysis, 2025
- By Chemistry
- By Textile Type
- By Application
- By Durability
- By Sales Channel
- France
- Pricing Analysis
- Market Share Analysis, 2025
- By Chemistry
- By Textile Type
- By Application
- By Durability
- By Sales Channel
- India
- Pricing Analysis
- Market Share Analysis, 2025
- By Chemistry
- By Textile Type
- By Application
- By Durability
- By Sales Channel
- ASEAN
- Pricing Analysis
- Market Share Analysis, 2025
- By Chemistry
- By Textile Type
- By Application
- By Durability
- By Sales Channel
- Australia & New Zealand
- Pricing Analysis
- Market Share Analysis, 2025
- By Chemistry
- By Textile Type
- By Application
- By Durability
- By Sales Channel
- China
- Pricing Analysis
- Market Share Analysis, 2025
- By Chemistry
- By Textile Type
- By Application
- By Durability
- By Sales Channel
- Japan
- Pricing Analysis
- Market Share Analysis, 2025
- By Chemistry
- By Textile Type
- By Application
- By Durability
- By Sales Channel
- South Korea
- Pricing Analysis
- Market Share Analysis, 2025
- By Chemistry
- By Textile Type
- By Application
- By Durability
- By Sales Channel
- Russia
- Pricing Analysis
- Market Share Analysis, 2025
- By Chemistry
- By Textile Type
- By Application
- By Durability
- By Sales Channel
- Poland
- Pricing Analysis
- Market Share Analysis, 2025
- By Chemistry
- By Textile Type
- By Application
- By Durability
- By Sales Channel
- Hungary
- Pricing Analysis
- Market Share Analysis, 2025
- By Chemistry
- By Textile Type
- By Application
- By Durability
- By Sales Channel
- Kingdom of Saudi Arabia
- Pricing Analysis
- Market Share Analysis, 2025
- By Chemistry
- By Textile Type
- By Application
- By Durability
- By Sales Channel
- Türkiye
- Pricing Analysis
- Market Share Analysis, 2025
- By Chemistry
- By Textile Type
- By Application
- By Durability
- By Sales Channel
- South Africa
- Pricing Analysis
- Market Share Analysis, 2025
- By Chemistry
- By Textile Type
- By Application
- By Durability
- By Sales Channel
- USA
- Market Structure Analysis
- Competition Dashboard
- Competition Benchmarking
- Market Share Analysis of Top Players
- By Regional
- By Chemistry
- By Textile Type
- By Application
- By Durability
- By Sales Channel
- Emerging Startups
- Innovation Benchmarking
- Competition Analysis
- Competition Deep Dive
- Archroma
- Overview
- Product Portfolio
- Profitability by Market Segments (Product/Region/Sales Channel)
- Sales Footprint
- Strategy Overview
- Marketing Strategy
- Product Strategy
- Channel Strategy
- RUDOLF
- NICCA Chemical
- Daikin
- TANATEX Chemicals
- Pulcra Chemicals
- Sarex Chemicals
- Bolger & O'Hearn
- Archroma
- Case Studies
- Success Stories
- Recent Developments
- Competition Deep Dive
- Assumptions & Acronyms Used


