

- Market Size (2026)
- USD 1860.7 Mn
- Forecast (2036)
- USD 3906.9 Mn
- CAGR (2026 to 2036)
- 7.7%
How big is the Textile Sanitizing Chemicals Market in 2026?
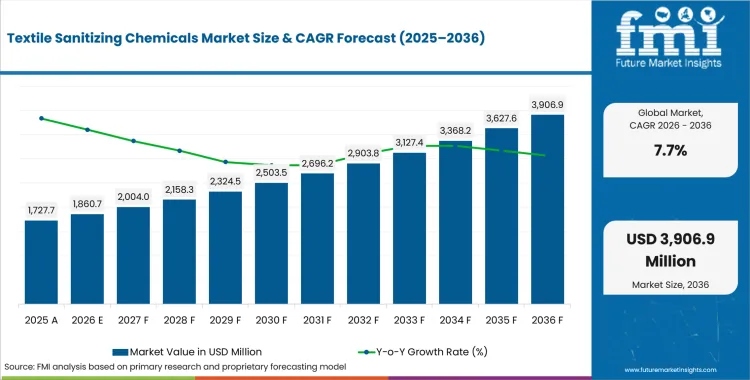
USD 1,860.7 million in 2026 and USD 3,906.9 million by 2036 at a 7.7% CAGR.
Demand for textile sanitizing chemicals is projected to rise at a CAGR of 7.7% by 2036, driving industry valuation from USD 1,860.7 million in 2026 to USD 3,906.9 million during the forecast period. Recurring exposure in sheets and gowns is keeping wash validation central to institutional laundry procurement. CDC reported in January 2026 that about 1 in 31 United States hospital patients had a healthcare-associated infection on a given day. The figure keeps chemical dosing and wash validation connected to residue control in antimicrobial hospital textiles specification work.
India and China are projected to grow faster as textile output and institutional linen expansion raise demand for controlled wash programs. The United States, Germany and Japan are anticipated to expand through label claims, hospital linen standards and service documentation during recurring chemical review. Institutional laundry operators are expected to adopt textile sanitizing chemicals to lower contamination risk during repeat wash cycles. EPA issued July 2025 guidance for disinfectant efficacy claims on soft surface textiles in non-residential settings. The guidance is expected to keep label instructions and exposure claims central to account approval.
Institutional laundry operators and hospital facility teams are projected to adopt textile sanitizing chemicals to lower contamination risk during repeat wash cycles. Chemical program managers evaluate dilution accuracy and residue behavior before adding formulas to recurring linen routes. Ecolab introduced professional cleaning textiles made from 100% recycled microfiber and cotton in April 2024. The launch shows how hygiene programs increasingly combine textiles and laundry care products inside service contracts that require staff training and proof of wash performance.
| Metric | Value |
|---|---|
| 2025 Market Size | USD 1,727.7 million |
| 2026 Market Size | USD 1,860.7 million |
| 2036 Market Size | USD 3,906.9 million |
| Forecast CAGR (2026-2036) | 7.7% |
| Chemical Type Focus | Quaternary Ammonium Compounds |
| Quaternary Ammonium Compounds Share (2026) | 36.2% |
| Application Focus | Laundry Sanitizing |
| Laundry Sanitizing Share (2026) | 43.0% |
| Form Focus | Liquid Concentrates |
| Liquid Concentrates Share (2026) | 38.6% |
Summary of the Textile Sanitizing Chemicals Market
| Market Signal | Commercial Impact |
|---|---|
| Demand and Growth Drivers | Hygiene accountability is expected to move spending toward chemicals that document textile disinfection performance. Service access is projected to decide whether facilities expand use beyond trial runs.
|
| Product and Segment View | Chemical supply and laundry sanitizing are expected to lead their parent categories in 2026. Liquid concentrates are forecast to remain the practical format screen for high-volume wash rooms.
|
| Geography and Growth Outlook | India and China are projected to form the higher-expansion tier due to textile output and institutional linen pressure. The United States and Western Europe are expected to expand under heavier documentation discipline.
|
| Competitive Landscape | Competition is moderately concentrated around hygiene program owners and textile chemistry specialists. Procurement screens are expected to center on label support and wash-room service reliability.
|
| Analyst Perspective | Textile sanitizing chemicals are expected to gain value when wash rooms can prove dosage, contact conditions and textile compatibility. Long-term retention is expected to depend on technical handover after first approval.
|
Source: FMI's proprietary forecasting model and primary research
How is the textile sanitizing chemicals market segmented?
The textile sanitizing chemicals industry is segmented by chemical type, application, form, end use, sales model, and region.
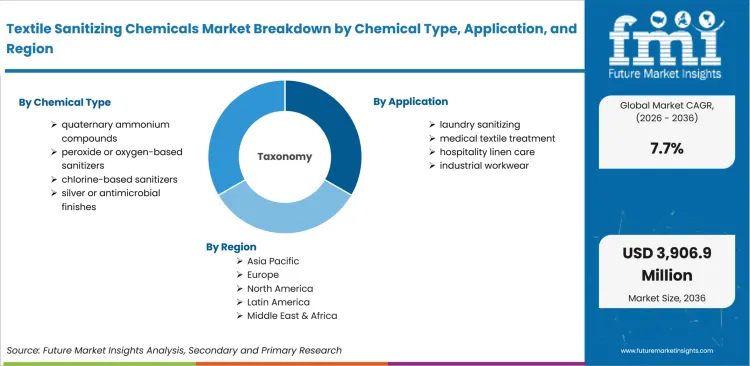
The textile sanitizing chemicals market is segmented by chemical type, application, form, end use, sales model, and region. By chemical type, it covers quaternary ammonium compounds, peroxide or oxygen-based sanitizers, chlorine-based sanitizers, and silver or antimicrobial finishes. By application, it covers laundry sanitizing, medical textile treatment, hospitality linen care, and industrial workwear. By form, it covers liquid concentrates, ready-to-use sprays, powder or granules, and durable finishing agents. By end use, it covers healthcare, commercial laundry, hospitality, and textile mills or finishers. By sales model, it covers chemical supply, chemical and service program, and private-label supply. Regional coverage spans North America, Europe, East Asia, South Asia and Pacific, Latin America, Middle East and Africa, aligned to Asia textile chemicals demand.
How does chemical supply shape purchasing within the sales model category?
Laundry operators often keep chemical supply separate from service contracts to protect inventory control and internal approval paths. EPA antimicrobial registration information updated in January 2026 defines sanitizing products by their role in reducing microorganisms on surfaces and processes. EPA wording keeps label language and intended use close to procurement review during chemical approval. Chemical supply routes therefore need product identity and safety files before account teams raise order volume.
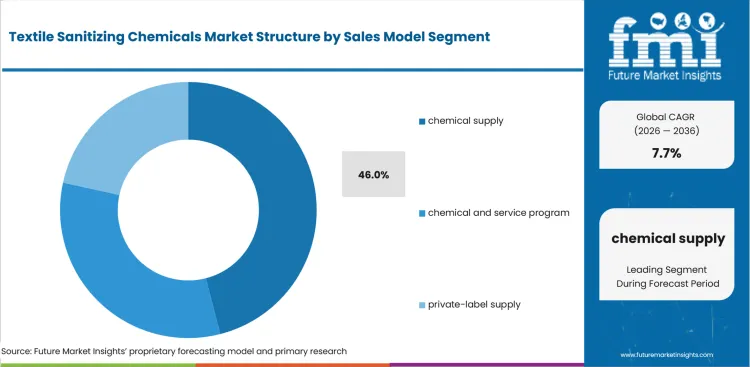
- By sales model, chemical supply is projected to account for 46.0% share in 2026 driven by direct control over sanitizer inventories and reorder timing. EPA described antimicrobial pesticides in January 2026 as products used to disinfect or sanitize inanimate objects and processes, which keeps label fit central during chemical approval reviews. Industrial laundry teams therefore review safety sheets and use instructions before converting supply-only orders into routine wash-room programs.
- Chemical supply is witnessing demand from industrial laundry operators owing to purchase control and predictable reorder routines. Procurement teams comparing laundry sanitizer demand need delivery reliability and emergency reorder support before shifting approved formulas into weekly linen programs. Service gaps turn a lower-price chemical route into a higher-risk operating choice for laundries managing daily linen release.
What supports laundry sanitizing within the application category?
Healthcare and hospitality linens move repeatedly between collection points and washing equipment, which keeps application fit visible to operations managers. CDC laundry guidance updated in January 2024 states healthcare laundry includes sheets and gowns. The item list also covers towels and uniforms that require consistent handling in clinical accounts. The broad textile list ties sanitizer choice to mixed-load handling and release standards for operators. Application teams need proof that a program performs across different fabric soils and wash temperatures.
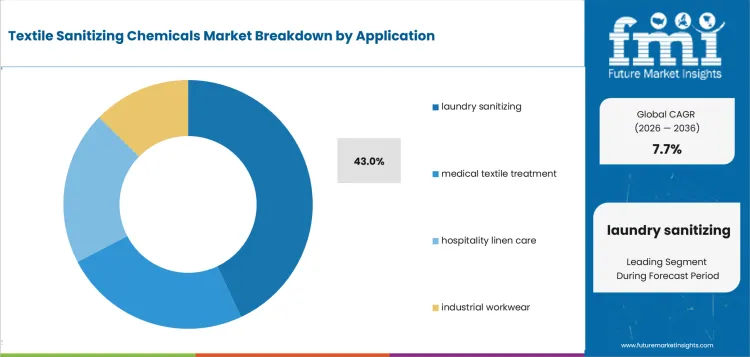
- By application, laundry sanitizing is estimated to hold 43.0% share in 2026 supported by recurring linen exposure and rewash avoidance. CDC listed healthcare laundry items in January 2024 from sheets to surgical drapes, which explains why one sanitizer program often needs multiple textile-use approvals. Operators therefore review each formula against mixed fabric soil and release routines before approving recurring use.
- Demand for laundry sanitizing is expected to grow among healthcare laundry teams attributable to mixed-load risk and audited wash release. Operators link surface disinfectant programs to textile routines only after contact time and dosage instructions fit daily production schedules. Adoption becomes easier after sanitation records align to linen-room checklists and account reporting needs.
How are liquid concentrates positioned within the form category?
High-volume wash rooms need chemical formats that fit pumps and staff routines without creating storage confusion. Christeyns states that on-premise laundry programs use liquid and powder detergents for automatic or hand dosing alongside registered biocides. The format decision therefore becomes a dosage-control issue before it becomes a price discussion. Concentrates support facilities that need fewer container changes and clearer dilution checks during shift handover.
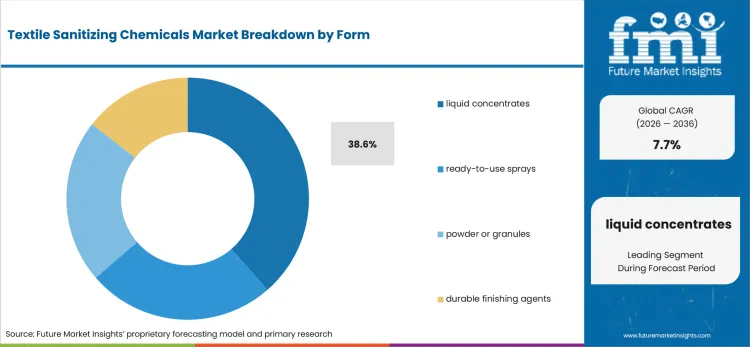
- By form, liquid concentrates are forecast to represent 38.6% share in 2026 attributable to pump-fed dosing and inventory efficiency. Christeyns lists liquid and powder detergents beside registered biocides in on-premise laundry programs, which keeps format compatibility near the start of product qualification. Wash-room managers therefore compare concentrates against dispenser fit and container handling before setting repeat-order routines.
- Purchase activity for liquid concentrates is anticipated to rise driven by automatic dosing needs in healthcare and hotel laundries. Chemical program managers using industrial cleaning programs prefer formats that reduce manual handling and preserve repeatable wash outcomes. Concentrates support cleaner shift handover in plants that track chemical use against linen volume and rewash rates.
What drives quaternary ammonium compounds within chemical type demand?
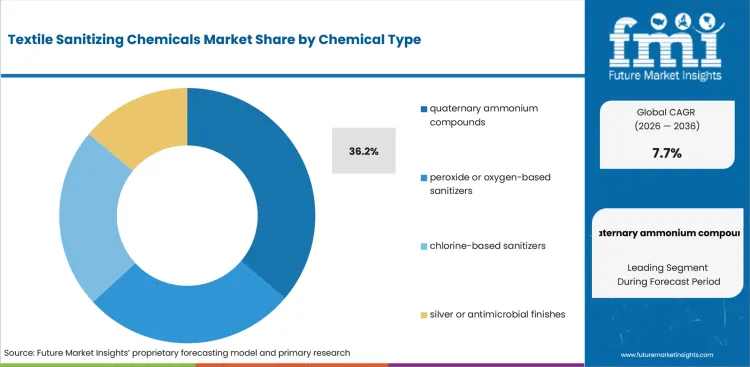
Quaternary ammonium compounds remain familiar to hygiene teams due to their role in antimicrobial formulations and surface sanitizing programs. Stepan describes antimicrobial cleaning products by their role in killing or slowing microorganisms on treated surfaces. That positioning supports technical reviews that compare active chemistry against contact instructions and residue concerns. Facility teams still need label clarity before moving quats into textile-adjacent cleaning or finishing programs.
- By chemical type, quaternary ammonium compounds are likely to capture 36.2% share in 2026 owing to formulation familiarity and sanitizer claim review. Stepan describes antimicrobial products as chemistries used to kill or slow microorganisms, which keeps active-ingredient identity central to institutional screening. Technical reviewers therefore compare quat concentration and contact guidance before approving formulas for textile-adjacent hygiene routines.
- Quaternary ammonium compound demand is drawing attention from hygiene program managers shaped by product familiarity and practical dilution checks. Technical teams comparing antimicrobial additive selection need evidence that chemistry fits textile-contact limits and cleaning instructions. Program managers then test residue expectations and fabric contact limits before adding quat formulas to larger hygiene accounts.
How do healthcare accounts evaluate textile sanitizing chemicals within end use?
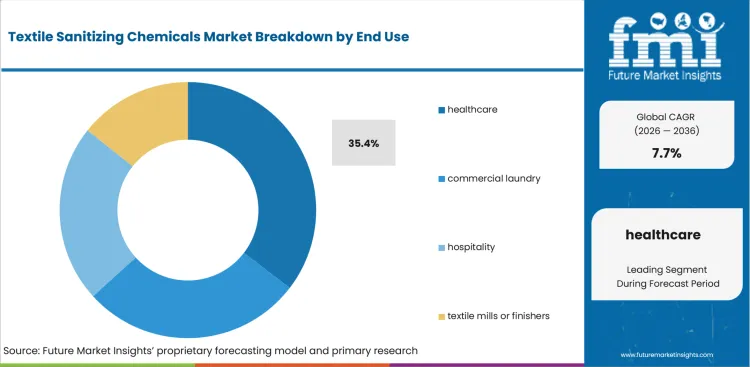
Hospital linen programs expose sanitizing chemistry to infection-prevention oversight, repeat wash pressure and routine operational audits. CDC reported in January 2026 that about 1 in 43 nursing home residents contracts at least one infection linked to healthcare each day. The long-term care statistic raises attention around linen separation and laundry instructions in accounts serving vulnerable residents. Healthcare accounts therefore screen chemical providers for product files and service ownership before program expansion.
- By end use, healthcare is set to lead demand at 35.4% share in 2026 due to infection-control accountability and recurring linen turnover. CDC noted in January 2026 that about 1 in 43 nursing home residents contracts a healthcare-associated infection, which reinforces laundry-process scrutiny. Hospital procurement teams therefore ask for audit records and staff training proof before enlarging chemical programs.
- Healthcare adoption is gaining momentum in institutional linen rooms supported by audit pressure and risk control. Facility teams using functional textile finishing need chemical partners that distinguish laundry disinfection from durable finish claims. Program expansion depends on service teams that translate label scope into training records and routine wash-release checks for nursing and laundry staff.
What are the drivers, restraints, and opportunities in the textile sanitizing chemicals market?
Near-term purchases are being shaped by linen hygiene accountability, label-claim discipline, and service-led expansion routes outlined below.
- Driver: Healthcare and hospitality linen programs are expected to increase purchases of chemicals that document dosage and contact conditions.
- Restraint: Qualification time is anticipated to delay adoption in accounts that lack clear label review and staff training ownership.
- Opportunity: Service-led chemical programs are projected to open access in wash rooms that need dosing support and documentation handover.
Healthcare and hospitality operations are expected to increase interest in sanitizing chemicals that make wash outcomes easier to verify. EPA issued July 2025 guidance explaining how disinfectant efficacy claims are added for soft surface textiles in non-residential settings. The guidance is expected to make label scope and test design central during formula review. Facility teams need the same proof before shifting trial products into recurring linen workflows. Audit teams therefore look for records that connect dosage instructions to fabric handling decisions.
Procurement review is likely to slow in facilities that lack internal ownership for claim review and wash validation. OSHA updated its low-hazard industries table in November 2024 for inspection targeting, which keeps sector risk classification visible to managers handling chemical programs. Safety data sheets and training records remain part of account approval for teams handling concentrated sanitizer formulas. Chemical providers that leave these records unresolved create extra review work for operating teams.
Service providers are projected to convert qualification pressure into account access by pairing chemicals with dosing guidance and field support. Christeyns took over Allegrini’s laundry division in Italy in July 2024 and added about 200 customers mainly from industrial laundries. The deal points to service depth as a route for documented textile finishes and wash-room chemicals in regional accounts. Local route density is expected to make troubleshooting faster during formula changeovers and staff retraining.
Which country CAGRs are profiled in the textile sanitizing chemicals market?
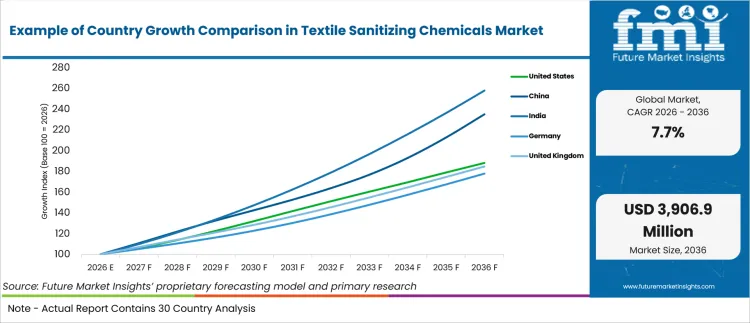
| Country | CAGR |
|---|---|
| United States | 6.53% |
| China | 8.93% |
| India | 9.93% |
| Germany | 5.93% |
| United Kingdom | 6.33% |
| Japan | 5.73% |
| South Korea | 7.13% |
Source: FMI's proprietary forecasting model and primary research
How do country-level CAGRs compare in the textile sanitizing chemicals market?
India at 9.93% CAGR and China at 8.93% CAGR form the higher-expansion group due to textile output and service conversion. South Korea is projected at 7.13% CAGR due to export-linked accounts. The United States at 6.53% CAGR and the United Kingdom at 6.33% CAGR show steadier expansion under healthcare and hospitality documentation cycles. Germany at 5.93% CAGR and Japan at 5.73% CAGR reflect careful qualification practices and slower switching from approved chemical programs across established accounts. Service access separates countries that scale trial orders quickly from markets that rely on longer technical review cycles.
- United States demand is projected to grow at 6.53% CAGR during the assessment period, driven by hospital linen accountability and healthcare service scale. USA Census Bureau reported in May 2026 that health care and social assistance revenue reached USD 1,107.1 billion in the first quarter of 2026. The spending base keeps outsourced laundries tied to infection-control reviews and recurring linen programs in hospital networks.
- China demand is forecast to rise at 8.93% CAGR over the forecast period, supported by textile output recovery and large industrial laundry channels. National Bureau of Statistics of China reported in March 2026 that textile industry value added rose 5.3% from January to February 2026. The production rebound strengthens demand for sanitizing agents used in finishing plants, workwear processors and institutional wash rooms. Provincial chemical approvals and distributor control still shape product rollout in coastal textile provinces.
- India is estimated to post 9.93% CAGR through 2036, attributable to textile export activity and formalized linen handling in healthcare. Press Information Bureau reported in April 2026 that ready-made garment exports reached ₹1,39,349.6 crore in FY 2025-26. Export-facing textile units need residue control and clear chemical records for treated fabric and workwear orders. Hospital and commercial laundry tenders still apply tight price filters before approving recurring chemical programs.
- Germany is anticipated to advance at 5.93% CAGR during the assessment period, shaped by strict documentation and established textile care chemistry. Destatis recorded in June 2026 that accommodation establishments had 39,390.3 thousand overnight stays in April 2026. Hotel linen turnover keeps wash quality visible for laundries that already use validated wash processes. German accounts often require clear safety records and repeatable dosing guidance before changing approved formulas.
- United Kingdom textile sanitizing chemical demand is predicted to expand at 6.33% CAGR by 2036, reinforced by hospitality linen cycles and care setting guidance. Office for National Statistics reported in November 2025 that short-term lets recorded 93,823,780 guest nights from July 2024 to June 2025. Accommodation turnover increases the need for consistent wash-room chemistry and linen release routines across outsourced laundry routes. Care homes also follow strict linen separation guidance from UK health authorities during infection-control audits.
- Japan is projected to record 5.73% CAGR over the forecast period, influenced by hotel linen turnover and cautious vendor qualification. Japan National Tourism Organization reported in March 2025 that visitor arrivals reached 3,258,100 in February 2025. The inbound travel volume raises linen demand for hotels and outsourced laundries that need repeatable wash chemistry during room turnover.
- South Korea adoption is estimated to expand at 7.13% CAGR through 2036, supported by export-linked SMEs and compact supply chains. Ministry of Data and Statistics reported in March 2026 that third-quarter 2025 export value rose 6.5% year on year. Export-linked textile and apparel accounts need stable finishing chemistry and workwear hygiene programs before repeat orders. Chemical qualification is likely to slow if local service ownership and documentation handover remain unclear. Domestic distributors therefore play a larger role in translating global product files into accepted account routines. Rudolf Group and Sanitized AG fit accounts that need antimicrobial finish evidence before brand or workwear approval.
Who are the notable companies in the textile sanitizing chemicals market?
Ecolab, Solenis, Diversey, Christeyns, Seitz, Kreussler, Archroma, Sanitized AG, Rudolf Group, Stepan, and Lanxess are the notable companies shaping this market.
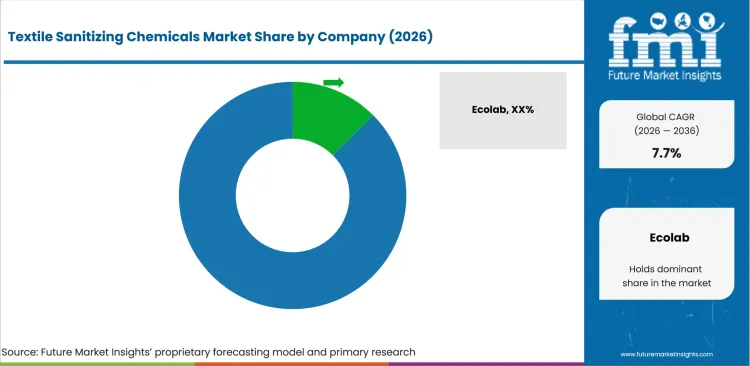
The market is moderately concentrated around hygiene program providers and specialist textile chemistry companies. Scale depends on application service, label documentation and account training beyond product supply alone. Regional specialists compete in accounts that need local delivery and dosing support for industrial laundry plants. Smaller finish specialists retain narrow advantages in treated-article claims and textile finish know-how for mills and apparel brands. Competition centers on chemical breadth and training depth beside sensitive cleaning chemicals for healthcare and hospitality accounts. Account retention depends on audit support after first delivery and field response during formula changeovers.
- Institutional service coverage separates Ecolab and Solenis from narrower chemistry providers serving isolated product purchases. Ecolab supports healthcare and hospitality programs that need consistent hygiene routines across multi-site contracts. Solenis uses Diversey’s cleaning and hygiene base to approach facilities seeking chemicals and training from one provider.
- Industrial laundry chemistry gives Christeyns, Seitz and Kreussler a route built around wash-room support. Christeyns covers industrial and on-premise laundries that need detergents and disinfection products under one program. Seitz and Kreussler compete in accounts that use German textile care know-how during chemical approval.
- Textile finish positions separate Archroma, Sanitized AG and Rudolf Group from providers focused mainly on wash chemistry. Archroma and Sanitized AG connect odor management and hygiene functions for apparel and home textiles. Rudolf Group offers antimicrobial finishing routes for mills and brands that need treated-article evidence before launch.
- Active-chemistry depth keeps Stepan and Lanxess visible during upstream formulation and active ingredient selection. Stepan supplies specialty chemistries used in cleaning and antimicrobial products for institutional hygiene formulations. Lanxess provides biocide and preservation expertise for formulators that need compliance support before finished-product approvals.
Competitive Benchmarking: Textile Sanitizing Chemicals Market
| Company | Laundry Program Fit | Textile Finish Fit | Documentation Depth | Service Reach |
|---|---|---|---|---|
| Ecolab | High | Medium | High | Global |
| Solenis | High | Medium | Strong | Global |
| Diversey | High | Medium | Strong | Global |
| Christeyns | Strong | Medium | Strong | Regional |
| Seitz | Strong | Medium | High | Regional |
| Kreussler | Strong | Medium | High | Regional |
| Archroma | Medium | High | High | Global |
| Sanitized AG | Medium | Strong | High | Regional |
| Rudolf Group | Medium | Strong | Strong | Global |
| Stepan | Medium | Medium | High | Global |
| Lanxess | Medium | Medium | High | Global |
Source: Future Market Insights competitive analysis, 2026. Ratings reflect relative portfolio relevance and workflow fit. Service capability and geographic reach shape the remaining comparison.
Key Developments in the Textile Sanitizing Chemicals Market
- In April 2024, Ecolab introduced professional cleaning textiles made from recycled microfiber and cotton for facility cleaning programs. The portfolio includes Rasant Planet flat mops and Polifix Microclin Planet microfiber cloths designed for professional hygiene applications. This development highlights the growing integration of cleaning textiles and chemical hygiene programs within commercial cleaning operations.
- In January 2024, Archroma and Sanitized AG strengthened their strategic alignment following a decade-long partnership focused on hygiene and odor-management finishes. The collaboration encompasses marketing, sales, and technology initiatives supporting textile treatment solutions.
- In July 2024, Christeyns acquired Allegrini’s laundry division in Italy to expand its presence within industrial laundry markets. The transaction added approximately 200 customers, primarily from the Italian industrial laundry sector, and broadened the company’s service network for laundry chemistry solutions. This development is expected to strengthen local technical support capabilities and improve service coverage for commercial laundry operators.
- In November 2024, Kreussler Textile Care showcased its latest washing and bleaching developments at Texcare 2024 for professional laundry operators. The event was used to demonstrate textile-care chemistry solutions designed for commercial laundry environments.
Key Players in the Textile Sanitizing Chemicals Market
Laundry and hygiene program providers
- Ecolab
- Solenis
- Diversey
- Christeyns
Textile care chemistry specialists
- Seitz
- Kreussler
- Stepan
- Lanxess
Antimicrobial finishing specialists
- Archroma
- Sanitized AG
- Rudolf Group
Textile Sanitizing Chemicals Market - Report Scope
| Coverage field | Report scope |
|---|---|
| Market breakdown | Textile Sanitizing Chemicals Market Breakdown By Chemical Type, Application, Form, End Use, Sales Model, and Region |
| Market Definition | Textile sanitizing chemicals are disinfecting, sanitizing or antimicrobial chemical products used by laundries, healthcare facilities, hotels and textile finishers to control microbial load on washable or treated textiles. |
| Regions Covered | North America, Latin America, Europe, East Asia, South Asia and Pacific, Middle East and Africa |
| Countries Covered | United States, China, India, Germany, United Kingdom, Japan, South Korea, Rest of World and 30+ countries |
| Key Companies Profiled | Ecolab, Solenis, Diversey, Christeyns, Seitz, Kreussler, Archroma, Sanitized AG, Rudolf Group, Stepan, and Lanxess |
| Forecast Period | 2026 to 2036 |
| Approach | Hybrid bottom-up and top-down methodology using linen wash frequency, chemical dosage assumptions, textile finishing use cases, healthcare linen standards and supplier service depth |
Source: Future Market Insights - analysis driven by proprietary forecasting models and primary research
Textile Sanitizing Chemicals Market - Research Methodology
| Method | Approach |
|---|---|
| Primary Research | FMI analysts reviewed inputs from hospital laundry managers, commercial laundry operators, textile finishers and chemical program managers. Interviews focused on wash validation, dosing accuracy, residue control and account approval barriers. Respondents explained how staff training affects formula rollout in healthcare linen rooms. The discussions also tested service ownership, documentation handover and distributor support before broader chemical program adoption and supplier scorecards. |
| Desk Research | Desk research used CDC infection-control guidance, EPA antimicrobial registration references, official national statistics and company product pages. Product relevance was checked against textile disinfection claims, laundry chemistry fit, active-ingredient positioning and treated-article functions. Source review also screened official company pages for laundry programs and antimicrobial finish evidence. Commercial market reports, undated aggregator sources and unsupported trade commentary were removed from source consideration. |
| Market Sizing and Forecasting | The model combined country textile activity, institutional linen demand, application share assumptions and chemical dosage intensity. Bottom-up estimates were reconciled against global value forecasts and segment share structure. Forecast assumptions were adjusted for liquid concentrate use, healthcare end-use exposure and service-led program adoption. Country allocation was tested against textile output, hospitality linen cycles and company service reach to avoid overcounting adjacent cleaning chemicals. |
| Data Validation | Forecasts were checked against company portfolio evidence, country-level textile indicators, hospital infection-control references and industrial laundry service signals. Company lists were reviewed to avoid counting adjacent chemicals without textile sanitizing relevance. Validation also checked whether each cited statistic supported a specific purchase mechanism, not broad textile activity alone. |
Source: Future Market Insights (FMI) analysis, based on proprietary forecasting model and primary research
Textile Sanitizing Chemicals Market by Segments
Textile sanitizing chemicals market segmented by chemical type:
- Quaternary Ammonium Compounds
- Peroxide Or Oxygen-Based Sanitizers
- Chlorine-Based Sanitizers
- Silver Or Antimicrobial Finishes
Textile sanitizing chemicals market segmented by application:
- Laundry Sanitizing
- Medical Textile Treatment
- Hospitality Linen Care
- Industrial Workwear
Textile sanitizing chemicals market segmented by form:
- Liquid Concentrates
- Ready-To-Use Sprays
- Powder Or Granules
- Durable Finishing Agents
Textile sanitizing chemicals market segmented by end use:
- Healthcare
- Commercial Laundry
- Hospitality
- Textile Mills Or Finishers
Textile sanitizing chemicals market segmented by sales model:
- Chemical Supply
- Chemical And Service Program
- Private-Label Supply
Textile Sanitizing Chemicals Market by Region:
- North America
- United States
- Canada
- Latin America
- Brazil
- Mexico
- Argentina
- Europe
- Germany
- United Kingdom
- France
- Italy
- Spain
- Rest of Europe
- East Asia
- China
- Japan
- South Korea
- South Asia and Pacific
- India
- Australia
- ASEAN
- Rest of South Asia and Pacific
- Middle East and Africa
- GCC Countries
- South Africa
- Rest of Middle East and Africa
Research Sources and Bibliography
- Centers for Disease Control and Prevention. (2026, January). Current HAI Progress Report. Centers for Disease Control and Prevention.
- Centers for Disease Control and Prevention. (2024, January). G. Laundry and Bedding. Centers for Disease Control and Prevention.
- USA Environmental Protection Agency. (2025, July). Guidance for Products Including or Adding Disinfectant Efficacy Claims for Use on Soft Surface Textiles in Non-Residential Settings. USA Environmental Protection Agency.
- USA Environmental Protection Agency. (2026, January). Antimicrobial Pesticide Registration. USA Environmental Protection Agency.
- USA Census Bureau. (2026, June). Quarterly Selected Services Estimates, First Quarter 2026. USA Census Bureau.
- National Bureau of Statistics of China. (2026, March). Industrial Production Operation from January to February 2026. National Bureau of Statistics of China.
- Press Information Bureau. (2026, April). India’s Textile Exports Register Growth of 2.1% in FY 2025-26. Ministry of Textiles.
- Destatis. (2026, June). Overnight stays. German Federal Statistical Office.
- Office for National Statistics. (2025, November). Short-term lets through online collaborative economy platforms, UK: July 2024 to June 2025. Office for National Statistics.
- Japan National Tourism Organization. (2025, March). Number of visitor arrivals to Japan in February 2025. Japan National Tourism Organization.
- Ministry of Data and Statistics. (2026, March). Preliminary Results of Trade by Enterprise Characteristics in the Third Quarter of 2025. Ministry of Data and Statistics.
- World Health Organization. (2025, November). From Data to Impact: Advancing Healthcare Associated Infection Surveillance for Safer Care and a Healthier Future. World Health Organization.
- Ecolab. (2024, April). From Waste to Textiles, Ecolab Introduces New Professional Cleaning Textiles Made From 100 Percent Recycled Fibre. Ecolab.
- Archroma. (2024, January). Archroma and Sanitized AG celebrate a decade-long partnership and align strategically for enhanced collaboration in marketing, sales and technology. Archroma.
- Archroma. (2024, April). Archroma brings Planet Conscious Solutions to Techtextil 2024. Archroma.
- Christeyns. (2024, July). Christeyns takes over Allegrini’s laundry division in Italy. Christeyns.
- Kreussler. (2024, November). Innovationen für umweltverträgliches Waschen und Bleichen mit Kreussler Textile Care auf der Texcare 2024. Kreussler Group.
- Rudolf Group. (2025, August). Sanitized Hygiene Technologies for Enhanced Textile Freshness and Durability. Rudolf Group.
- Solenis. (2024, July). Solenis Marks 10-Year Anniversary, Updates Brand Identity. Solenis.
- Stepan. (2026, June). Specialty Chemicals & Formulations for Cleaning Products. Stepan Company.
This bibliography is provided for reader reference and uses primary government evidence sources throughout. It covers standards-body, official trade body and company sources used for the article evidence base.
This Report Answers
- What value is the textile sanitizing chemicals market forecast to reach in 2026 and by 2036?
- What CAGR is expected for the textile sanitizing chemicals market from 2026 to 2036?
- Which segments shape demand across chemical type, application, form, end use and sales model?
- Which linen handling and documentation pressures support purchase activity across institutional accounts?
- How do country CAGRs differ across the profiled markets?
- Which companies compete across wash-room service, textile finishing and active chemistry dimensions?
- How does FMI validate forecasts using a hybrid bottom-up and top-down methodology?
- What should procurement and technical teams address before broader sourcing commitment?
- How do label claims, documentation and regulatory expectations affect vendor selection?
Frequently Asked Questions
What is driving growth in the Textile Sanitizing Chemicals Market?
Growth is being driven by hygiene accountability in healthcare, hospitality and commercial laundry programs. Facilities need chemicals that document textile disinfection performance during repeat wash cycles.
Who are the key players in the Textile Sanitizing Chemicals Market?
Key players include Ecolab, Solenis, Diversey and Christeyns; Seitz, Kreussler, Stepan and Lanxess; Archroma, Sanitized AG and Rudolf Group. Competition centers on label support, textile chemistry and wash-room service reliability.
What is a significant restraint in the Textile Sanitizing Chemicals Market?
A significant restraint is qualification time caused by unclear label review and staff training ownership. Facilities delay adoption when dosage records, contact conditions and safety files remain unresolved.
Why should executives track the Textile Sanitizing Chemicals Market?
Executives should track the market due to its effect on linen safety, rewash cost and service risk in healthcare and hospitality accounts. The category connects infection-control expectations to chemical program governance in accounts that manage linen risk.
What business problem does the Textile Sanitizing Chemicals Market address?
The market addresses microbial load control and residue management for washable or treated textiles. It also helps facilities convert hygiene policy into dosage, contact-time and wash-release routines for staff.
What should procurement leaders evaluate before selecting suppliers?
Procurement leaders should compare label scope, dosage guidance and safety files before approving recurring suppliers. Staff training and regional service access need review before account awards to prevent formula changes from creating rewash work or audit risk.
What limits return on investment for facility procurement teams?
Return on investment is likely to weaken if chemical qualification lacks wash-room ownership or measurable acceptance criteria. Facilities face risk if dosing systems and fabric compatibility are not tested before rollout.
How do suppliers build long-term account confidence?
Chemical providers build confidence by documenting contact conditions and linking claims to specific textile uses. Service teams should also provide training records and corrective support after first approval during rollout.
Preview the report firsthand - request a free sample
Get SampleGet the brochure for pricing and purchase details.
Get PDFTable of Content
- Key Takeaways
- Market Size and CAGR
- Top Growth Driver
- Fastest Growing Segment
- Leading Region
- Key Companies
- Emerging Opportunities
- Executive Summary
- Global Market Outlook
- Demand-side Trends
- Supply-side Trends
- Technology Roadmap Analysis
- Analysis and Recommendations
- Analyst Perspective (What is happening? Why now? What should investors know?)
- Key Questions Answered
- How large is the market?
- What is the CAGR?
- What are key trends?
- Which region dominates?
- Who are the leaders?
- Market Overview
- Market Coverage / Taxonomy
- Market Definition / Scope / Limitations
- Research Methodology
- Chapter Orientation
- Analytical Lens and Working Hypotheses
- Market Structure, Signals, and Trend Drivers
- Benchmarking and Cross-market Comparability
- Market Sizing, Forecasting, and Opportunity Mapping
- Research Design and Evidence Framework
- Desk Research Programme (Secondary Evidence)
- Expert Input and Fieldwork (Primary Evidence)
- Tooling, Models, and Reference Databases
- Data Engineering and Model Build
- Quality Assurance and Audit Trail
- Market Background
- Market Dynamics (Drivers, Restraints, Opportunity, Trends)
- Scenario Forecast (Optimistic, Likely, Conservative)
- Impact Analysis
- AI Impact
- Sustainability Impact
- Regulatory Impact
- Technology Impact
- Consumer / Buyer Analysis
- Purchase Drivers
- Adoption Barriers
- Buyer Journey
- Opportunity Map Analysis
- Product Life Cycle Analysis
- Supply Chain Analysis
- Investment Feasibility Matrix
- Value Chain Analysis
- PESTLE and Porter's Analysis
- Regulatory Landscape
- Regional Parent Market Outlook
- Production and Consumption Statistics
- Import and Export Statistics
- Global Market Analysis and Forecast, 2021 to 2036
- Historical Market Size Value (USD Mn) Analysis, 2021 to 2025
- Current and Future Market Size Value (USD Mn) Projections, 2026 to 2036
- Y-o-Y Growth Trend Analysis
- Absolute $ Opportunity Analysis
- Global Market Pricing Analysis, 2021 to 2036
- Global Market Analysis and Forecast, By Chemical Type, 2021 to 2036
- Introduction / Key Findings
- Historical Market Size Value (USD Mn) Analysis By Chemical Type, 2021 to 2025
- Current and Future Market Size Value (USD Mn) Analysis and Forecast By Chemical Type, 2026 to 2036
- quaternary ammonium compounds
- peroxide or oxygen-based sanitizers
- chlorine-based sanitizers
- silver or antimicrobial finishes
- quaternary ammonium compounds
- Y-o-Y Growth Trend Analysis By Chemical Type, 2021 to 2025
- Absolute $ Opportunity Analysis By Chemical Type, 2026 to 2036
- Global Market Analysis and Forecast, By Application, 2021 to 2036
- Introduction / Key Findings
- Historical Market Size Value (USD Mn) Analysis By Application, 2021 to 2025
- Current and Future Market Size Value (USD Mn) Analysis and Forecast By Application, 2026 to 2036
- laundry sanitizing
- medical textile treatment
- hospitality linen care
- industrial workwear
- laundry sanitizing
- Y-o-Y Growth Trend Analysis By Application, 2021 to 2025
- Absolute $ Opportunity Analysis By Application, 2026 to 2036
- Global Market Analysis and Forecast, By Form, 2021 to 2036
- Introduction / Key Findings
- Historical Market Size Value (USD Mn) Analysis By Form, 2021 to 2025
- Current and Future Market Size Value (USD Mn) Analysis and Forecast By Form, 2026 to 2036
- liquid concentrates
- ready-to-use sprays
- powder or granules
- durable finishing agents
- liquid concentrates
- Y-o-Y Growth Trend Analysis By Form, 2021 to 2025
- Absolute $ Opportunity Analysis By Form, 2026 to 2036
- Global Market Analysis and Forecast, By End Use, 2021 to 2036
- Introduction / Key Findings
- Historical Market Size Value (USD Mn) Analysis By End Use, 2021 to 2025
- Current and Future Market Size Value (USD Mn) Analysis and Forecast By End Use, 2026 to 2036
- healthcare
- commercial laundry
- hospitality
- textile mills or finishers
- healthcare
- Y-o-Y Growth Trend Analysis By End Use, 2021 to 2025
- Absolute $ Opportunity Analysis By End Use, 2026 to 2036
- Global Market Analysis and Forecast, By Sales Model, 2021 to 2036
- Introduction / Key Findings
- Historical Market Size Value (USD Mn) Analysis By Sales Model, 2021 to 2025
- Current and Future Market Size Value (USD Mn) Analysis and Forecast By Sales Model, 2026 to 2036
- chemical supply
- chemical and service program
- private-label supply
- chemical supply
- Y-o-Y Growth Trend Analysis By Sales Model, 2021 to 2025
- Absolute $ Opportunity Analysis By Sales Model, 2026 to 2036
- Global Market Analysis and Forecast, By Region, 2021 to 2036
- Introduction
- Historical Market Size Value (USD Mn) Analysis By Region, 2021 to 2025
- Current Market Size Value (USD Mn) Analysis and Forecast By Region, 2026 to 2036
- North America
- Latin America
- Western Europe
- Eastern Europe
- East Asia
- South Asia and Pacific
- Middle East & Africa
- Market Attractiveness Analysis By Region
- North America Market Analysis and Forecast, By Country, 2021 to 2036
- Historical Market Size Value (USD Mn) Trend Analysis By Market Taxonomy, 2021 to 2025
- Market Size Value (USD Mn) Forecast By Market Taxonomy, 2026 to 2036
- By Country
- USA
- Canada
- By Chemical Type
- By Application
- By Form
- By End Use
- By Sales Model
- By Country
- Market Attractiveness Analysis
- By Country
- By Chemical Type
- By Application
- By Form
- By End Use
- By Sales Model
- Key Takeaways
- Latin America Market Analysis and Forecast, By Country
- Historical Market Size Value (USD Mn) Trend Analysis By Market Taxonomy, 2021 to 2025
- Market Size Value (USD Mn) Forecast By Market Taxonomy, 2026 to 2036
- By Country
- Brazil
- Mexico
- Chile
- Rest of Latin America
- By Chemical Type
- By Application
- By Form
- By End Use
- By Sales Model
- By Country
- Market Attractiveness Analysis
- By Country
- By Chemical Type
- By Application
- By Form
- By End Use
- By Sales Model
- Key Takeaways
- Western Europe Market Analysis and Forecast, By Country
- Historical Market Size Value (USD Mn) Trend Analysis By Market Taxonomy, 2021 to 2025
- Market Size Value (USD Mn) Forecast By Market Taxonomy, 2026 to 2036
- By Country
- Germany
- UK
- Italy
- Spain
- France
- Nordic
- BENELUX
- Rest of Western Europe
- By Chemical Type
- By Application
- By Form
- By End Use
- By Sales Model
- By Country
- Market Attractiveness Analysis
- By Country
- By Chemical Type
- By Application
- By Form
- By End Use
- By Sales Model
- Key Takeaways
- Eastern Europe Market Analysis and Forecast, By Country
- Historical Market Size Value (USD Mn) Trend Analysis By Market Taxonomy, 2021 to 2025
- Market Size Value (USD Mn) Forecast By Market Taxonomy, 2026 to 2036
- By Country
- Russia
- Poland
- Hungary
- Balkan & Baltic
- Rest of Eastern Europe
- By Chemical Type
- By Application
- By Form
- By End Use
- By Sales Model
- By Country
- Market Attractiveness Analysis
- By Country
- By Chemical Type
- By Application
- By Form
- By End Use
- By Sales Model
- Key Takeaways
- East Asia Market Analysis and Forecast, By Country
- Historical Market Size Value (USD Mn) Trend Analysis By Market Taxonomy, 2021 to 2025
- Market Size Value (USD Mn) Forecast By Market Taxonomy, 2026 to 2036
- By Country
- China
- Japan
- South Korea
- By Chemical Type
- By Application
- By Form
- By End Use
- By Sales Model
- By Country
- Market Attractiveness Analysis
- By Country
- By Chemical Type
- By Application
- By Form
- By End Use
- By Sales Model
- Key Takeaways
- South Asia and Pacific Market Analysis and Forecast, By Country
- Historical Market Size Value (USD Mn) Trend Analysis By Market Taxonomy, 2021 to 2025
- Market Size Value (USD Mn) Forecast By Market Taxonomy, 2026 to 2036
- By Country
- India
- ASEAN
- Australia & New Zealand
- Rest of South Asia and Pacific
- By Chemical Type
- By Application
- By Form
- By End Use
- By Sales Model
- By Country
- Market Attractiveness Analysis
- By Country
- By Chemical Type
- By Application
- By Form
- By End Use
- By Sales Model
- Key Takeaways
- Middle East & Africa Market Analysis and Forecast, By Country
- Historical Market Size Value (USD Mn) Trend Analysis By Market Taxonomy, 2021 to 2025
- Market Size Value (USD Mn) Forecast By Market Taxonomy, 2026 to 2036
- By Country
- Kingdom of Saudi Arabia
- Other GCC Countries
- Türkiye
- South Africa
- Other African Union
- Rest of Middle East & Africa
- By Chemical Type
- By Application
- By Form
- By End Use
- By Sales Model
- By Country
- Market Attractiveness Analysis
- By Country
- By Chemical Type
- By Application
- By Form
- By End Use
- By Sales Model
- Key Takeaways
- Key Countries Market Analysis
- USA
- Pricing Analysis
- Market Share Analysis, 2025
- By Chemical Type
- By Application
- By Form
- By End Use
- By Sales Model
- Canada
- Pricing Analysis
- Market Share Analysis, 2025
- By Chemical Type
- By Application
- By Form
- By End Use
- By Sales Model
- Mexico
- Pricing Analysis
- Market Share Analysis, 2025
- By Chemical Type
- By Application
- By Form
- By End Use
- By Sales Model
- Brazil
- Pricing Analysis
- Market Share Analysis, 2025
- By Chemical Type
- By Application
- By Form
- By End Use
- By Sales Model
- Chile
- Pricing Analysis
- Market Share Analysis, 2025
- By Chemical Type
- By Application
- By Form
- By End Use
- By Sales Model
- Germany
- Pricing Analysis
- Market Share Analysis, 2025
- By Chemical Type
- By Application
- By Form
- By End Use
- By Sales Model
- UK
- Pricing Analysis
- Market Share Analysis, 2025
- By Chemical Type
- By Application
- By Form
- By End Use
- By Sales Model
- Italy
- Pricing Analysis
- Market Share Analysis, 2025
- By Chemical Type
- By Application
- By Form
- By End Use
- By Sales Model
- Spain
- Pricing Analysis
- Market Share Analysis, 2025
- By Chemical Type
- By Application
- By Form
- By End Use
- By Sales Model
- France
- Pricing Analysis
- Market Share Analysis, 2025
- By Chemical Type
- By Application
- By Form
- By End Use
- By Sales Model
- India
- Pricing Analysis
- Market Share Analysis, 2025
- By Chemical Type
- By Application
- By Form
- By End Use
- By Sales Model
- ASEAN
- Pricing Analysis
- Market Share Analysis, 2025
- By Chemical Type
- By Application
- By Form
- By End Use
- By Sales Model
- Australia & New Zealand
- Pricing Analysis
- Market Share Analysis, 2025
- By Chemical Type
- By Application
- By Form
- By End Use
- By Sales Model
- China
- Pricing Analysis
- Market Share Analysis, 2025
- By Chemical Type
- By Application
- By Form
- By End Use
- By Sales Model
- Japan
- Pricing Analysis
- Market Share Analysis, 2025
- By Chemical Type
- By Application
- By Form
- By End Use
- By Sales Model
- South Korea
- Pricing Analysis
- Market Share Analysis, 2025
- By Chemical Type
- By Application
- By Form
- By End Use
- By Sales Model
- Russia
- Pricing Analysis
- Market Share Analysis, 2025
- By Chemical Type
- By Application
- By Form
- By End Use
- By Sales Model
- Poland
- Pricing Analysis
- Market Share Analysis, 2025
- By Chemical Type
- By Application
- By Form
- By End Use
- By Sales Model
- Hungary
- Pricing Analysis
- Market Share Analysis, 2025
- By Chemical Type
- By Application
- By Form
- By End Use
- By Sales Model
- Kingdom of Saudi Arabia
- Pricing Analysis
- Market Share Analysis, 2025
- By Chemical Type
- By Application
- By Form
- By End Use
- By Sales Model
- Türkiye
- Pricing Analysis
- Market Share Analysis, 2025
- By Chemical Type
- By Application
- By Form
- By End Use
- By Sales Model
- South Africa
- Pricing Analysis
- Market Share Analysis, 2025
- By Chemical Type
- By Application
- By Form
- By End Use
- By Sales Model
- USA
- Market Structure Analysis
- Competition Dashboard
- Competition Benchmarking
- Market Share Analysis of Top Players
- By Regional
- By Chemical Type
- By Application
- By Form
- By End Use
- By Sales Model
- Emerging Startups
- Innovation Benchmarking
- Competition Analysis
- Competition Deep Dive
- Ecolab
- Overview
- Product Portfolio
- Profitability by Market Segments
- Sales Footprint
- Strategy Overview
- Marketing Strategy
- Product Strategy
- Channel Strategy
- Solenis
- Diversey
- Christeyns
- Seitz
- Kreussler
- Archroma
- Sanitized AG
- Rudolf Group
- Stepan
- Lanxess
- Ecolab
- Case Studies
- Success Stories
- Recent Developments
- Competition Deep Dive
- Assumptions & Acronyms Used


