

- Market Size (2026)
- USD 1180.6 Mn
- Forecast (2036)
- USD 2572.5 Mn
- CAGR (2026 to 2036)
- 8.1%
How big is the Textile Dye Removal Chemicals Market in 2026?
USD 1,180.6 million in 2026 and USD 2,572.5 million by 2036 at a 8.1% CAGR.
Textile wet processors are moving from basic color knockdown to documented effluent control before discharge or reuse. The shift is driven by visible dye residues that biological treatment does not always remove. EPA effluent guidance identifies dyeing, bleaching, rinsing, and finishing among textile processes that generate wastewater. The evidence matters to buyers since color removal now affects permit readiness and downstream treatment reliability. Supplier value is therefore moving toward jar testing, dosage guidance, sludge control, and adjacent water and wastewater treatment chemicals programs.
Mill operators, common effluent plants, garment wash units, and chemical service providers are the core buyer groups. Their spending reflects batch shade changes, mixed dye chemistry, salt load, sludge cost, and audit records demanded by brands or regulators. Treatment chemicals create value by reducing visible color before discharge checks and reuse systems. In May 2025, the Press Information Bureau reported IIT Madras deployment of ECOOP and capacitive deionization for textile wastewater treatment. This supports interest in chemical trains that combine coagulation, oxidation, and adsorption.
Regional adoption differs by textile production structure and water stress. China and India support chemical volume due to large wet-processing clusters. The United States, Japan, and Western Europe support technical demand tied to compliance records and specialty finishing. The product becomes more valuable once it links effluent testing, dosing control, sludge behavior, and membrane chemicals used in reuse systems. For buyers, the strategic question is which supplier can keep color removal stable during changing dye recipes and variable plant flows.
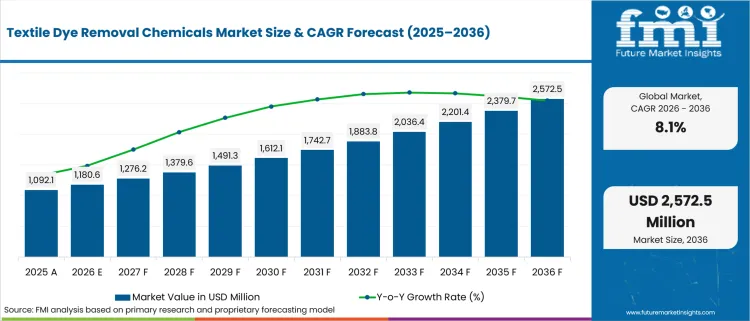
| Metric | Value |
|---|---|
| 2025 Market Size | USD 1,092.1 million |
| 2026 Market Size | USD 1,180.6 million |
| 2036 Market Size | USD 2,572.5 million |
| Forecast CAGR (2026-2036) | 8.1% |
| Leading Chemical Type | Coagulants / Flocculants |
| Coagulants / Flocculants Share (2026) | 43.0% |
| Leading Application | Dyehouse Effluent |
| Dyehouse Effluent Share (2026) | 46.0% |
| Leading Dye Type | Reactive Dyes |
| Reactive Dyes Share (2026) | 41.0% |
| Fastest-growing Country | India |
| India CAGR by 2036 | 10.2% |
Summary of the Textile Dye Removal Chemicals Market
| Market Signal | Commercial Impact |
|---|---|
| Demand and Growth Drivers | Demand for textile dye removal chemicals is increasing as textile manufacturers strengthen wastewater treatment, water reuse, and regulatory compliance across dyeing operations.
|
| Product and Segment View | Coagulants and flocculants, dyehouse effluent treatment, and reactive dye processing continue to represent the leading commercial opportunities across the market.
|
| Geography and Growth Outlook | Asia continues to lead market expansion through large textile manufacturing capacity, wastewater treatment investments, and stricter environmental regulations.
|
| Competitive Landscape | Competition increasingly focuses on treatment chemistry performance, water reuse expertise, plant testing, and technical service support.
|
| Analyst Perspective | Textile dye removal chemicals are evolving from conventional treatment products into process optimization solutions that improve wastewater quality, operational efficiency, and regulatory compliance.
- Nikhil Kaitwade, Principal Consultant at Future Market Insights |
How is the textile dye removal chemicals market segmented?
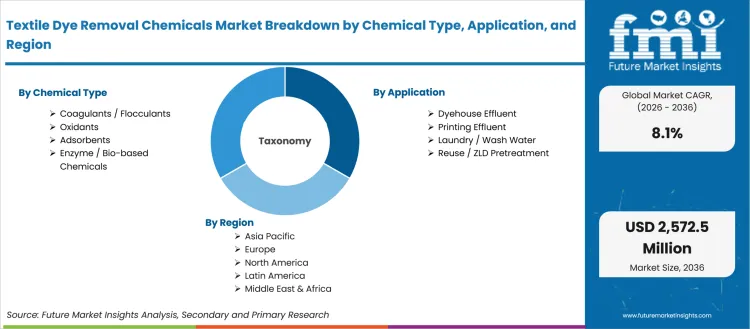
The Textile Dye Removal Chemicals Market industry is segmented by chemical type, application, dye type, end use, sales model, and region.
The textile dye removal chemicals market is segmented by chemical type, application, dye type, end use, sales model, and region. Chemical type covers Coagulants / Flocculants, Oxidants, Adsorbents, and Enzyme / Bio-based Chemicals. Application includes Dyehouse Effluent, Printing Effluent, Laundry / Wash Water, and Reuse / ZLD Pretreatment. Dye type encompasses Reactive Dyes, Disperse Dyes, Acid / Basic Dyes, and Mixed Dye Effluent. End use spans Textile Mills, Common Effluent Plants, Garment Wash Units, and Chemical Service Providers. Sales model includes Chemical Supply and Chemical + Service Program. Regional coverage extends across North America, Latin America, Europe, East Asia, South Asia and Pacific, and the Middle East and Africa.
Why do Coagulants / Flocculants matter within the chemical type category?
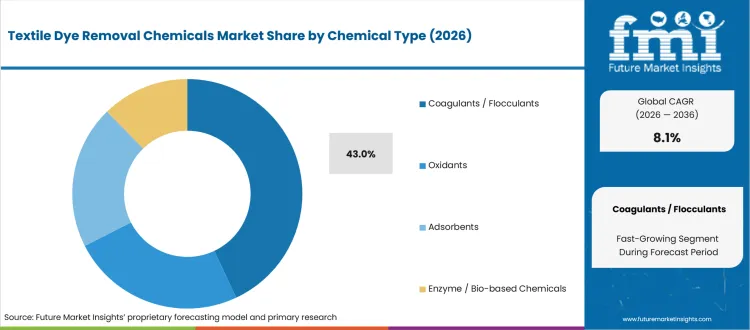
Treatment teams need fast color separation before settling tanks and filters can perform reliably. The issue is not only chemical price. It is the balance between removal depth, sludge volume, pH sensitivity, and production-day variation. Coagulants and flocculants remain relevant due to their place at the first treatment stage for visible color loads.
- In 2026, Coagulants / Flocculants are anticipated to hold 43.0% of chemical type demand, driven by routine use in color destabilization before clarification. EPA textile effluent guidance links dyeing and finishing processes to wastewater generation. This evidence supports their role as a daily control chemistry not an occasional corrective product.
- The operating value is speed under variable plant conditions. Buyers using coagulant programs can adjust dose after shade changes and reduce color carryover before biological or membrane stages. This makes the segment relevant to textile processors comparing chemical supply against broader water treatment chemical spending.
What supports demand for Dyehouse Effluent treatment?
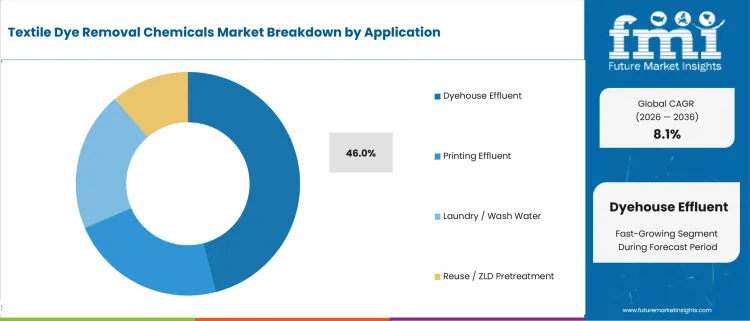
Dyehouse effluent creates the clearest buyer problem in this market due to visible color peaks after batch processing. The stream can change after a shade family switch or a substrate change. Buyers therefore evaluate chemicals by repeatability across recipes and by the effect on sludge handling after color removal.
- Dyehouse Effluent is likely to represent 46.0% of application demand in 2026, supported by concentrated color streams from dyeing and wash-off steps. VTT reported in March 2024 that dyeing and finishing are among the main water-using textile operations. This makes front-end color control central to plant treatment economics.
- Plant managers value dyehouse-specific programs due to discharge-check and reuse risks after a failed batch. Chemical suppliers gain relevance by matching jar tests to shade history and plant flow patterns. This improves buyer confidence during mixed effluent periods and reduces dependence on blanket overdosing.
How are Reactive Dyes positioned within the dye type category?
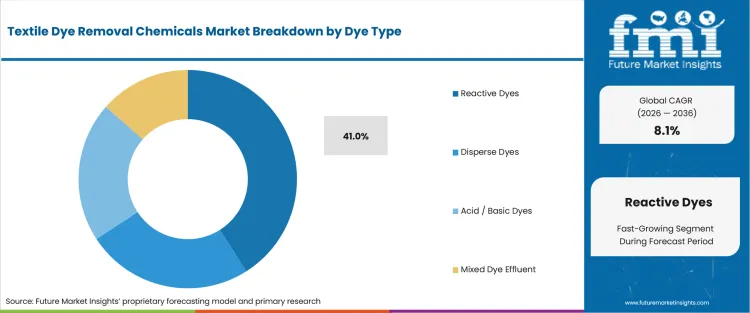
Cotton and viscose processing creates soluble color loads that need careful chemistry. Reactive dye wash-off can resist routine biological treatment and requires adjustment by salt load and pH. This segment links coloration demand to wastewater treatment choices across mills that also track adjacent synthetic dye use.
- Reactive Dyes is expected to account for 41.0% of dye type demand in 2026, attributable to cellulosic fabric processing and recurring wash water from cotton recipes. FMI textile color analysis places reactive dyes as a visible dye category. This evidence supports chemical demand for soluble color removal after dye fixation steps.
- For mill executives, the value lies in stable output after recipe changes and fewer corrective treatments after sampling. Reactive dye treatment programs help teams manage salt-sensitive floc behavior and color variability. Suppliers that understand dye chemistry can defend accounts against sellers offering only generic coagulant pricing.
What makes Textile Mills a meaningful end-use segment?
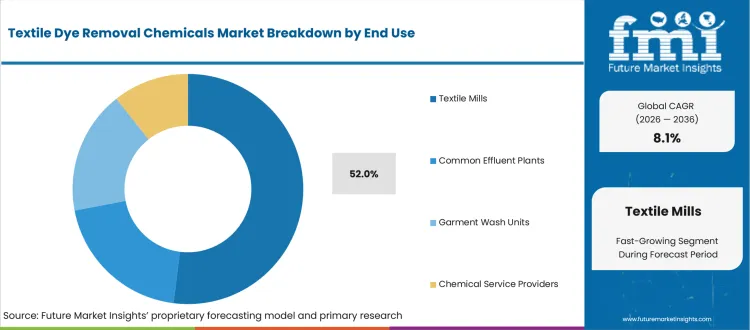
Textile mills buy dye removal chemicals closest to the production problem. Their treatment teams see shade changes, daily flow peaks, and operator constraints before external service providers do. This buyer group therefore values chemicals that can be tuned quickly and documented during routine discharge checks or reuse preparation.
- Textile Mills are expected to account for 52.0% of end-use demand in 2026, reinforced by direct responsibility for daily treatment performance. NCTO recorded 453,122 workers in the USA textile supply chain in 2025. That employment base indicates operating complexity across production and support functions that depend on reliable water control.
- The buyer value is accountability at plant level. Mill teams can compare dosage cost, sludge output, and color removal on the same production schedule. Chemical suppliers that provide training and sample-based adjustments become more useful than vendors that only deliver standard drums.
Why does Chemical Supply remain important in the sales model category?
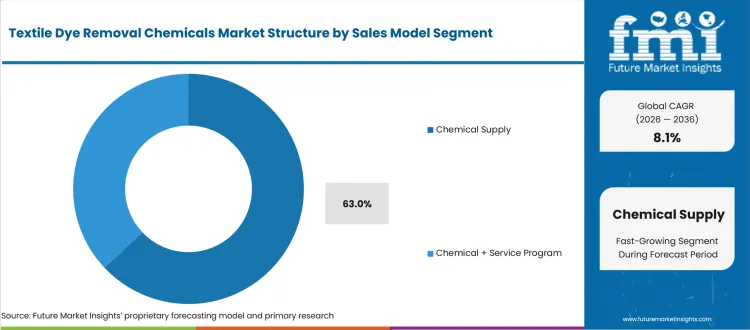
Routine treatment plants still purchase chemicals as consumables before considering bundled service programs. The sales model is shaped by plant maturity, operator skill, procurement control, and the difficulty of the effluent stream. Chemical supply remains important due to recurring purchase cycles in standard dyehouse and wash water treatment.
- Chemical Supply is projected to hold 63.0% of sales model demand in 2026, led by mills that already run treatment assets and need steady replenishment. The March 2025 Archroma and Gradiant ZLD project shows how chemical use can sit alongside equipment-centered reuse systems. This keeps chemical supply relevant even in more complex treatment trains.
- Procurement teams use direct supply when operators can manage routine dosing and call in support only for difficult streams. Service programs gain share in plants that need audit records or recurring trials. The same buyer may also evaluate thermosol dyeing system changes that alter effluent profile.
What are the drivers, restraints, and opportunities in the textile dye removal chemicals market?
Near-term purchases are being shaped by the color-control requirement and reuse-service expansion route outlined below.
- Driver: Daily dyehouse color peaks are driving chemical spending due to the need for stable discharge and reuse pretreatment.
- Restraint: Sludge disposal and overdosing risk restrain adoption owing to higher solid waste and uncertain lifecycle cost.
- Opportunity: Chemical + service programs gain traction from buyer demand for jar testing, dosing records, and plant troubleshooting.
Dyehouse managers are under pressure to reduce visible color before effluent reaches biological or reuse stages. This spending pattern is shaped by production variation not a single regulatory deadline. The May 2025 PIB release on ECOOP showed dye degradation and organic pollutant treatment without sludge formation. That evidence supports buyer interest in oxidation and hybrid treatment routes that go beyond simple settling. Suppliers gain opportunity by showing where coagulants, oxidants, and adsorbents fit inside one treatment sequence.
Sludge cost limits chemical expansion in plants that judge treatment by total operating expense. Excessive coagulant use can move the problem from water to solids handling. A 2024 Applied Sciences review described coagulation and flocculation as established methods for colored industrial wastewater treatment. The commercial point is that proven chemistry still needs careful dose control. Suppliers that reduce sludge volume and document removal performance can convert this restraint into a service-led buying case.
Startups and specialty suppliers can enter through service models that solve narrow process problems. Common effluent plants and mills often need quick trials during mixed dye runs. Reuse pretreatment creates openings for waterless textile dyeing services links and low-water processing advice. The opportunity is practical not promotional. Buyers will test suppliers that can document color reduction, salt tolerance, and sludge impact during actual production days.
Which country CAGRs are profiled in the textile dye removal chemicals market?
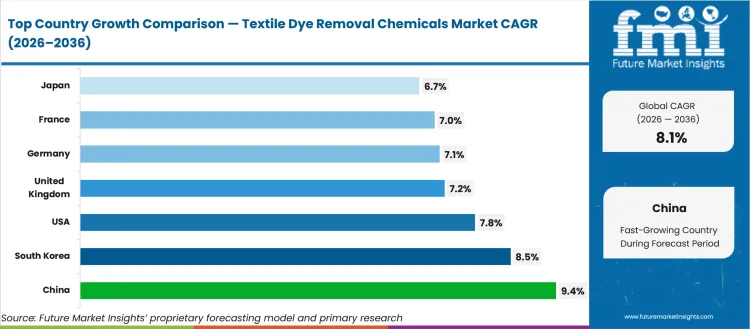
| Country | CAGR |
|---|---|
| United States | 7.8% |
| United Kingdom | 7.2% |
| Germany | 7.1% |
| France | 7.0% |
| Japan | 6.7% |
| China | 9.4% |
| South Korea | 8.5% |
| India | 10.2% |
How do country-level CAGRs compare in the textile dye removal chemicals market?
Country CAGR profiles should be read by textile processing structure and water-control pressure. In established markets, demand is tied to technical fabrics, audits, and specialty finishing not broad dyehouse expansion. In high-growth textile clusters, chemical demand is closer to daily effluent volume and reuse preparation. The comparison helps buyers and suppliers decide whether to prioritize direct mill accounts, common effluent plants, or service-led programs. Country variation therefore reflects operating need, not only macroeconomic scale.
- By 2036, the United States is projected to record 7.8% CAGR, supported by technical textile production and wastewater scrutiny. NCTO reported textile and apparel shipments of USD 60.9 billion in 2025. The figure supports a base of mills and related processors that need water control. Growth compares below India and China due to lower dyehouse concentration, yet compliance-oriented accounts can still support premium service programs.
- The United Kingdom is expected to grow at 7.2% CAGR during the forecast period, shaped by circularity scrutiny and tighter textile resource planning. The UK resource-efficiency report noted 1.7 million tonnes of textiles consumed in 2018. The statistic is older but was used in an April 2024 government evidence report. Demand compares as compliance-led not volume-led, which favors specialty service support.
- Over the assessment period, Germany is forecast to advance at 7.1% CAGR, attributable to engineering-driven finishing operations and EU textile compliance expectations. EEA reported in March 2025 that the EU textile and clothing sector had EUR 170 billion turnover in 2023. Germany compares as a quality-led market in which buyers examine sludge output and lifecycle treatment cost before switching suppliers.
- Through 2036, France is anticipated to post 7.0% CAGR, reinforced by brand accountability and circularity policy visibility. Refashion reported that 3.5 billion textile pieces are placed on the French market. This environment supports environmental documentation even if bulk dyehouse volume is lower than Asia. Demand compares as more audit-sensitive, which favors suppliers able to link treatment records to buyer expectations.
- Japan is likely to expand at 6.7% CAGR by 2036, influenced by high-specification textiles and conservative supplier qualification. Japan Textile Federation reported 32 textile-related organizations and associations in January 2024. The country compares as technically demanding but compact in volume. Suppliers need compatibility proof for specialty fabrics and plant constraints before gaining wider acceptance.
- China is estimated to rise at 9.4% CAGR between 2026 and 2036, driven by scale in dyeing and finishing operations. National Bureau of Statistics data showed clothes, shoes, hats, and textiles retail sales of 742.6 billion yuan in January-June 2025. That consumption base supports extensive upstream processing. China compares above Western markets due to cluster density and regulated wastewater discharge requirements.
- Demand in South Korea is projected to grow at 8.5% CAGR by 2036, shaped by integrated textile and fashion production. Invest Korea data showed 44,931 domestic textile and fashion companies in the core industry. This structure supports recurring chemical demand from fabric and dyeing processors. South Korea compares as service-sensitive due to export quality needs and compact production lines.
- The textile dye removal chemicals market sector in India is forecast to record 10.2% CAGR over the assessment period, led by export-facing wet-processing clusters and reuse pressure. The Ministry of Textiles reported India as ranked sixth among global textile and apparel exporters in 2024. This profile exceeds other listed countries due to cluster density, cotton processing, and service needs tied to dye fixatives and coloration workflows.
Who are the notable companies in the textile dye removal chemicals market?
Ecolab, Kemira, Solenis, SNF Group, Kurita Water Industries, Archroma, Nouryon, Buckman, Veolia Water Technologies, and Gradiant are the notable companies shaping this market.
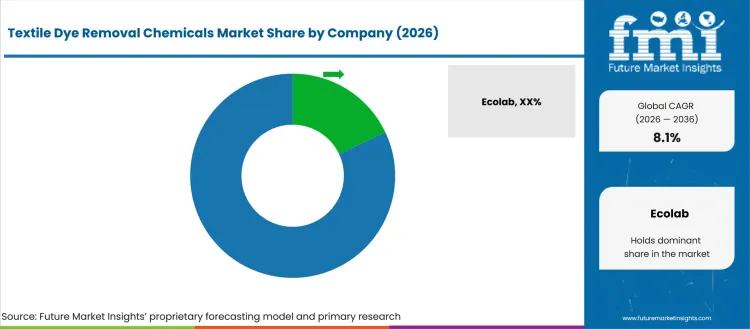
Buyer choice in this market is structured around chemistry fit, service access, and reuse-system relevance. Ecolab, Solenis, Kemira, SNF Group, and Kurita Water Industries are more relevant for buyers that need industrial water chemistry and plant support. Archroma, Nouryon, and Buckman become important in environments that connect textile chemistry to process performance. Veolia Water Technologies and Gradiant gain preference in projects that combine treatment design, ZLD, and water reuse. This positioning overlaps with boiler water treatment chemicals and other plant utility programs.
- Ecolab and Solenis focus on industrial water programs that matter for mills needing routine chemical supply and service checks. Buyers choose these suppliers to reduce handoff risk between product selection and plant troubleshooting. Their role is relevant to accounts that evaluate dye removal alongside broader cooling, boiler, and wastewater treatment needs.
- Kemira and SNF Group gain relevance through coagulant, flocculant, and polymer chemistry depth. Procurement teams consider them for plants that need color destabilization and settling performance at predictable cost. Kemira official releases also show expansion into activated carbon and industrial water service, which supports a broader treatment portfolio.
- Archroma, Nouryon, and Buckman are suited to buyers that connect textile chemistry decisions to effluent treatment outcomes. Their positioning matters in mills that evaluate dyeing, finishing, water circularity, and chemical handling together. The clearest value appears in accounts that need application knowledge before committing to new treatment chemistry.
- Veolia Water Technologies and Gradiant are relevant to reuse and ZLD projects that require treatment design as well as chemicals. Buyers selecting these companies usually want process integration and performance accountability. Archroma’s 2025 Thailand ZLD project illustrates how water reuse projects can pull chemical suppliers closer to system-level decisions.
Competitive Benchmarking: Textile Dye Removal Chemicals Market
| Company | Dye-Removal Chemistry Fit | Plant Trial Support | Reuse / ZLD Fit | Service Reach |
|---|---|---|---|---|
| Ecolab | High | Strong | Strong | Global |
| Kemira | High | Strong | Strong | Global |
| Solenis | High | Strong | Medium | Global |
| SNF Group | High | Medium | Medium | Global |
| Kurita Water Industries | Medium | Strong | Strong | Asia, Europe and North America |
| Archroma | Medium | Strong | Strong | Global |
| Nouryon | Medium | Medium | Medium | Global |
| Buckman | Medium | Medium | Medium | Global |
| Veolia Water Technologies | Medium | Strong | High | Global |
| Gradiant | Medium | Strong | High | Global |
Source: Future Market Insights competitive analysis, 2026. Ratings reflect relative portfolio relevance, workflow or project fit, service capability, and geographic reach.
Key Developments in the Textile Dye Removal Chemicals Market
- In September 2024, Kemira completed the acquisition of Norit’s UK reactivation operations. The deal matters for dye removal chemicals due to activated carbon use in deeper water treatment and micropollutant removal. The market implication is broader supplier interest in adsorbent-based treatment routes.
- In March 2025, Archroma and Gradiant implemented a ZLD solution at Archroma’s Mahachai plant in Thailand. The system enables recovery of 90-95% of wastewater for reuse. This matters due to closer links between dyeing operations, water circularity, and reuse pretreatment.
- In September 2025, Kemira signed an agreement to acquire Water Engineering for about USD 150 million. The action matters due to added industrial wastewater treatment service capability. The implication is wider competition around chemical supply programs that include field support and account management.
- In April 2026, Kurita invested in Cyclopure to expand PFAS treatment using DEXSORB in the United States. This matters for textile wastewater suppliers due to rising relevance of selective adsorbents in industrial water portfolios. The implication is higher attention to specialty removal chemistries beyond bulk coagulation.
Key Players in the Textile Dye Removal Chemicals Market
Industrial Water Chemical Suppliers
- Ecolab
- Kemira
- Solenis
- SNF Group
- Kurita Water Industries
Textile Chemistry Specialists
- Archroma
- Nouryon
- Buckman
Treatment and Reuse Integrators
- Veolia Water Technologies
- Gradiant
Textile Dye Removal Chemicals Market - Report Scope
| Coverage field | Report scope |
|---|---|
| Market breakdown | Textile Dye Removal Chemicals Market Breakdown By Chemical Type, Application, Dye Type, End Use, Sales Model, and Region |
| Market Definition | Chemicals used to reduce or remove color from textile wastewater before discharge, reuse, or further treatment. |
| Regions Covered | North America, Latin America, Europe, East Asia, South Asia and Pacific, Middle East and Africa |
| Countries Covered | United States, United Kingdom, Germany, France, Japan, China, South Korea, India and broader regional coverage |
| Key Companies Profiled | Ecolab, Kemira, Solenis, SNF Group, Kurita Water Industries, Archroma, Nouryon, Buckman, Veolia Water Technologies, Gradiant |
| Forecast Period | 2026 to 2036 |
| Approach | Hybrid bottom-up and top-down methodology using effluent treatment demand, chemical dosage assumptions, country compliance pressure, and supplier channel validation |
Textile Dye Removal Chemicals Market - Research Methodology
| Method | Approach |
|---|---|
| Primary Research | FMI analysts reviewed inputs from textile mill operators, effluent treatment plant managers, chemical distributors, and water treatment service providers. Discussions focused on dosing choices, color removal targets, sludge handling, and supplier qualification routes. |
| Desk Research | Desk research covered regulator documents, textile wastewater references, official trade bodies, company pressrooms, and industrial water portfolios. Adjacent categories were reviewed only to understand treatment chemistry and reuse-system demand pressure. |
| Market Sizing and Forecasting | The model combined estimated wet-processing effluent exposure, chemical dosage ranges, application mix, dye-class demand, and country-level compliance pressure. Forecast assumptions were checked against mill activity, common effluent plant demand, and service model adoption. |
| Data Validation | Forecasts were cross-checked against textile processing clusters, wastewater treatment portfolios, and company activity in industrial water treatment. Duplicate external statistics were removed so each evidence point supported only one article section. |
Textile Dye Removal Chemicals Market by Segments
Textile Dye Removal Chemicals Market segmented by Chemical Type:
- Coagulants / Flocculants
- Oxidants
- Adsorbents
- Enzyme / Bio-based Chemicals
Textile Dye Removal Chemicals Market segmented by Application:
- Dyehouse Effluent
- Printing Effluent
- Laundry / Wash Water
- Reuse / ZLD Pretreatment
Textile Dye Removal Chemicals Market segmented by Dye Type:
- Reactive Dyes
- Disperse Dyes
- Acid / Basic Dyes
- Mixed Dye Effluent
Textile Dye Removal Chemicals Market segmented by End Use:
- Textile Mills
- Common Effluent Plants
- Garment Wash Units
- Chemical Service Providers
Textile Dye Removal Chemicals Market segmented by Sales Model:
- Chemical Supply
- Chemical + Service Program
Textile Dye Removal Chemicals Market by Region:
- North America
- United States
- Canada
- Mexico
- Latin America
- Brazil
- Chile
- Rest of Latin America
- Western Europe
- Germany
- United Kingdom
- Italy
- Spain
- France
- Nordic
- BENELUX
- Rest of Western Europe
- Eastern Europe
- Russia
- Poland
- Hungary
- Balkan and Baltic
- Rest of Eastern Europe
- East Asia
- China
- Japan
- South Korea
- South Asia and Pacific
- India
- ASEAN
- Australia and New Zealand
- Rest of South Asia and Pacific
- Middle East and Africa
- Kingdom of Saudi Arabia
- Other GCC Countries
- Turkiye
- South Africa
- Other African Union
- Rest of Middle East and Africa
Research Sources and Bibliography
- United States Environmental Protection Agency. (2026, May 19). Effluent Guidelines. USA Environmental Protection Agency. https://www.epa.gov/eg
- United States Environmental Protection Agency. (2024, December). Preliminary Effluent Guidelines Program Plan 16. USA Environmental Protection Agency. https://www.epa.gov/system/files/documents/2024-12/preliminary-plan-16_december2024_508.pdf
- Press Information Bureau. (2025, May 16). IIT Madras develops and deploys new technology to treat textile wastewater. Government of India. https://www.pib.gov.in/PressReleasePage.aspx?PRID=2129056
- National Council of Textile Organizations. (2026, April 27). USA textile industry demonstrates resilience amid global disruptions, secures major policy wins. National Council of Textile Organizations. https://ncto.org/u-s-textile-industry-demonstrates-resilience-amid-global-disruptions-secures-major-policy-wins/
- Department for Environment, Food and Rural Affairs. (2024, April). Unlocking resource efficiency: Phase 2 textiles. Government of the United Kingdom. https://assets.publishing.service.gov.uk/media/6620f19f651136bd0b757d85/unlocking-resource-efficiency-phase-2-textiles-report.pdf
- ReLondon. (2025, March). London Textiles Action Plan. ReLondon. https://relondon.gov.uk/wp-content/uploads/2025/03/London-Textiles-Action-Plan.pdf
- European Environment Agency. (2025, March 26). Circularity of the EU textiles value chain in numbers. European Environment Agency. https://www.eea.europa.eu/en/analysis/publications/circularity-of-the-eu-textiles-value-chain-in-numbers
- Refashion. (2025, June 18). Environmental performance of the EPR textile sector. Refashion. https://pro.refashion.fr/en/news/filiere/environmental-performance-epr-sector
- Japan Textile Federation. (2024, January). Japan Textile Federation. Japan Textile Federation. https://www.jtf-net.com/english/
- Invest Korea. (2025). Fashion. Invest Korea. https://www.investkorea.org/ik-en/cntnts/i-318/web.do
- National Bureau of Statistics of China. (2025, July 16). Total retail sales of consumer goods in June 2025. National Bureau of Statistics of China. https://www.stats.gov.cn/english/PressRelease/202508/t20250805_1960595.html
- Ministry of Ecology and Environment of the People’s Republic of China. (2025). Discharge standards of water pollutants for dyeing and finishing of textile industry. Ministry of Ecology and Environment. https://english.mee.gov.cn/Resources/standards/water_environment/Discharge_standard/201301/t20130107_244749.shtml
- Ministry of Textiles. (2026, May). Annual Report 2025-26. Government of India. https://www.texmin.gov.in/static/uploads/2026/05/5c48e80d2180ca3194b9e9b01340696d.pdf
- VTT Technical Research Centre of Finland. (2024, March). Textile production water use and textile wastewaters. VTT Technical Research Centre of Finland. https://cris.vtt.fi/ws/portalfiles/portal/102413557/2027caaf-telavaluetextilewastewaters03-2024.pdf
- Zaharia, C. (2024). The use of coagulation-flocculation for industrial colored wastewater treatment. Applied Sciences, 14(5), 2184. https://www.mdpi.com/2076-3417/14/5/2184
- Archroma. (2025, March 18). Archroma and Gradiant partner to advance water circularity with ZLD technology in Thailand. Archroma. https://www.archroma.com/press-releases/archroma-and-gradiant-partner-to-advance-water-circularity-with-innovative-zld-technology-in-thailand
- Kemira. (2024, July 1). Kemira expands its water treatment offering to include activated carbon, acquiring Norit’s UK reactivation operations. Kemira. https://www.kemira.com/news-and-stories/newsroom/releases/kemira-expands-its-water-treatment-offering-to-include-activated-carbon-acquiring-norits-uk-reactivation-operations/
- Kemira. (2025, September 16). Kemira expands into industrial water treatment services with the acquisition of Water Engineering, Inc. Kemira. https://www.kemira.com/news-and-stories/newsroom/releases/kemira-expands-into-industrial-water-treatment-services-with-the-acquisition-of-water-engineering-inc/
- Kurita Water Industries. (2026, April 20). Kurita invests in Cyclopure to accelerate PFAS business expansion utilizing DEXSORB in the United States. Kurita Water Industries. https://www.kurita-water.com/en/news/20260420-02/
This bibliography is provided for reader reference and uses primary government, standards-body, official trade body, and company sources.
This Report Answers
- What is the current and future value of the Textile Dye Removal Chemicals Market from 2026 to 2036?
- What CAGR is expected for textile dye removal chemicals during the 2026 to 2036 forecast period?
- Which chemical type has a notable share in textile dye removal chemical demand in 2026?
- Which application contributes meaningful demand for textile dye removal chemicals in 2026?
- What buyer factors are increasing demand for dye removal chemicals in textile wastewater treatment?
- How do reuse, ZLD, and discharge compliance affect supplier selection in this market?
- Which countries are profiled for textile dye removal chemical CAGR movement?
- Which companies are active in textile dye removal chemicals and related industrial water treatment?
- What is included in the Textile Dye Removal Chemicals Market definition?
- How does FMI forecast demand across chemical type, dye type, end use, and country?
Frequently Asked Questions
Why should executives track the Textile Dye Removal Chemicals Market?
Executives should track this market because dye removal performance now directly affects discharge compliance water reuse readiness and brand audit outcomes.
What business problem does the Textile Dye Removal Chemicals Market address?
It reduces visible color in textile effluent so mills can meet discharge limits and stabilize downstream biological or reuse treatment.
What should procurement leaders evaluate before selecting suppliers?
Procurement leaders should evaluate color removal efficiency sludge generation consistency across dye types and availability of plant testing support.
What can limit return on investment for buyers?
Return on investment can be limited by excessive sludge disposal cost overdosing risk and unstable performance during shade changes.
How can suppliers build executive confidence?
Suppliers build confidence by delivering proven removal results disciplined dosing guidance low sludge impact and reliable on site technical support.
Preview the report firsthand - request a free sample
Get SampleGet the brochure for pricing and purchase details.
Get PDFTable of Content
- Key Takeaways
- Market Size and CAGR
- Top Growth Driver
- Fastest Growing Segment
- Leading Region
- Key Companies
- Emerging Opportunities
- Executive Summary
- Global Market Outlook
- Demand-side Trends
- Supply-side Trends
- Technology Roadmap Analysis
- Analysis and Recommendations
- Analyst Perspective (What is happening? Why now? What should investors know?)
- Key Questions Answered
- How large is the market?
- What is the CAGR?
- What are key trends?
- Which region dominates?
- Who are the leaders?
- Market Overview
- Market Coverage / Taxonomy
- Market Definition / Scope / Limitations
- Research Methodology
- Chapter Orientation
- Analytical Lens and Working Hypotheses
- Market Structure, Signals, and Trend Drivers
- Benchmarking and Cross-market Comparability
- Market Sizing, Forecasting, and Opportunity Mapping
- Research Design and Evidence Framework
- Desk Research Programme (Secondary Evidence)
- Expert Input and Fieldwork (Primary Evidence)
- Tooling, Models, and Reference Databases
- Data Engineering and Model Build
- Quality Assurance and Audit Trail
- Market Background
- Market Dynamics (Drivers, Restraints, Opportunity, Trends)
- Scenario Forecast (Optimistic, Likely, Conservative)
- Impact Analysis
- AI Impact
- Sustainability Impact
- Regulatory Impact
- Technology Impact
- Consumer / Buyer Analysis
- Purchase Drivers
- Adoption Barriers
- Buyer Journey
- Opportunity Map Analysis
- Product Life Cycle Analysis
- Supply Chain Analysis
- Investment Feasibility Matrix
- Value Chain Analysis
- PESTLE and Porter's Analysis
- Regulatory Landscape
- Regional Parent Market Outlook
- Production and Consumption Statistics
- Import and Export Statistics
- Global Market Analysis and Forecast, 2021 to 2036
- Historical Market Size Value (USD Million) & Volume (Unit) Analysis, 2021 to 2025
- Current and Future Market Size Value (USD Million) & Volume (Unit) Projections, 2026 to 2036
- Y-o-Y Growth Trend Analysis
- Absolute $ Opportunity Analysis
- Global Market Pricing Analysis, 2021 to 2036
- Global Market Analysis and Forecast, By Chemical Type, 2021 to 2036
- Introduction / Key Findings
- Historical Market Size Value (USD Million) & Volume (Unit) Analysis By Chemical Type, 2021 to 2025
- Current and Future Market Size Value (USD Million) & Volume (Unit) Analysis and Forecast By Chemical Type, 2026 to 2036
- Coagulants / Flocculants
- Oxidants
- Adsorbents
- Enzyme / Bio-based Chemicals
- Coagulants / Flocculants
- Y-o-Y Growth Trend Analysis By Chemical Type, 2021 to 2025
- Absolute $ Opportunity Analysis By Chemical Type, 2026 to 2036
- Global Market Analysis and Forecast, By Application, 2021 to 2036
- Introduction / Key Findings
- Historical Market Size Value (USD Million) & Volume (Unit) Analysis By Application, 2021 to 2025
- Current and Future Market Size Value (USD Million) & Volume (Unit) Analysis and Forecast By Application, 2026 to 2036
- Dyehouse Effluent
- Printing Effluent
- Laundry / Wash Water
- Reuse / ZLD Pretreatment
- Dyehouse Effluent
- Y-o-Y Growth Trend Analysis By Application, 2021 to 2025
- Absolute $ Opportunity Analysis By Application, 2026 to 2036
- Global Market Analysis and Forecast, By Dye Type, 2021 to 2036
- Introduction / Key Findings
- Historical Market Size Value (USD Million) & Volume (Unit) Analysis By Dye Type, 2021 to 2025
- Current and Future Market Size Value (USD Million) & Volume (Unit) Analysis and Forecast By Dye Type, 2026 to 2036
- Reactive Dyes
- Disperse Dyes
- Acid / Basic Dyes
- Mixed Dye Effluent
- Reactive Dyes
- Y-o-Y Growth Trend Analysis By Dye Type, 2021 to 2025
- Absolute $ Opportunity Analysis By Dye Type, 2026 to 2036
- Global Market Analysis and Forecast, By End Use, 2021 to 2036
- Introduction / Key Findings
- Historical Market Size Value (USD Million) & Volume (Unit) Analysis By End Use, 2021 to 2025
- Current and Future Market Size Value (USD Million) & Volume (Unit) Analysis and Forecast By End Use, 2026 to 2036
- Textile Mills
- Common Effluent Plants
- Garment Wash Value (USD Million) & Volume (Unit)s
- Chemical Service Providers
- Textile Mills
- Y-o-Y Growth Trend Analysis By End Use, 2021 to 2025
- Absolute $ Opportunity Analysis By End Use, 2026 to 2036
- Global Market Analysis and Forecast, By Sales Model, 2021 to 2036
- Introduction / Key Findings
- Historical Market Size Value (USD Million) & Volume (Unit) Analysis By Sales Model, 2021 to 2025
- Current and Future Market Size Value (USD Million) & Volume (Unit) Analysis and Forecast By Sales Model, 2026 to 2036
- Chemical Supply
- Chemical + Service Program
- Chemical Supply
- Y-o-Y Growth Trend Analysis By Sales Model, 2021 to 2025
- Absolute $ Opportunity Analysis By Sales Model, 2026 to 2036
- Global Market Analysis and Forecast, By Region, 2021 to 2036
- Introduction
- Historical Market Size Value (USD Million) & Volume (Unit) Analysis By Region, 2021 to 2025
- Current Market Size Value (USD Million) & Volume (Unit) Analysis and Forecast By Region, 2026 to 2036
- North America
- Latin America
- Western Europe
- Eastern Europe
- East Asia
- South Asia and Pacific
- Middle East & Africa
- Market Attractiveness Analysis By Region
- North America Market Analysis and Forecast, By Country, 2021 to 2036
- Historical Market Size Value (USD Million) & Volume (Unit) Trend Analysis By Market Taxonomy, 2021 to 2025
- Market Size Value (USD Million) & Volume (Unit) Forecast By Market Taxonomy, 2026 to 2036
- By Country
- USA
- Canada
- Mexico
- By Chemical Type
- By Application
- By Dye Type
- By End Use
- By Sales Model
- By Country
- Market Attractiveness Analysis
- By Country
- By Chemical Type
- By Application
- By Dye Type
- By End Use
- By Sales Model
- Key Takeaways
- Latin America Market Analysis and Forecast, By Country
- Historical Market Size Value (USD Million) & Volume (Unit) Trend Analysis By Market Taxonomy, 2021 to 2025
- Market Size Value (USD Million) & Volume (Unit) Forecast By Market Taxonomy, 2026 to 2036
- By Country
- Brazil
- Chile
- Rest of Latin America
- By Chemical Type
- By Application
- By Dye Type
- By End Use
- By Sales Model
- By Country
- Market Attractiveness Analysis
- By Country
- By Chemical Type
- By Application
- By Dye Type
- By End Use
- By Sales Model
- Key Takeaways
- Western Europe Market Analysis and Forecast, By Country
- Historical Market Size Value (USD Million) & Volume (Unit) Trend Analysis By Market Taxonomy, 2021 to 2025
- Market Size Value (USD Million) & Volume (Unit) Forecast By Market Taxonomy, 2026 to 2036
- By Country
- Germany
- UK
- Italy
- Spain
- France
- Nordic
- BENELUX
- Rest of Western Europe
- By Chemical Type
- By Application
- By Dye Type
- By End Use
- By Sales Model
- By Country
- Market Attractiveness Analysis
- By Country
- By Chemical Type
- By Application
- By Dye Type
- By End Use
- By Sales Model
- Key Takeaways
- Eastern Europe Market Analysis and Forecast, By Country
- Historical Market Size Value (USD Million) & Volume (Unit) Trend Analysis By Market Taxonomy, 2021 to 2025
- Market Size Value (USD Million) & Volume (Unit) Forecast By Market Taxonomy, 2026 to 2036
- By Country
- Russia
- Poland
- Hungary
- Balkan & Baltic
- Rest of Eastern Europe
- By Chemical Type
- By Application
- By Dye Type
- By End Use
- By Sales Model
- By Country
- Market Attractiveness Analysis
- By Country
- By Chemical Type
- By Application
- By Dye Type
- By End Use
- By Sales Model
- Key Takeaways
- East Asia Market Analysis and Forecast, By Country
- Historical Market Size Value (USD Million) & Volume (Unit) Trend Analysis By Market Taxonomy, 2021 to 2025
- Market Size Value (USD Million) & Volume (Unit) Forecast By Market Taxonomy, 2026 to 2036
- By Country
- China
- Japan
- South Korea
- By Chemical Type
- By Application
- By Dye Type
- By End Use
- By Sales Model
- By Country
- Market Attractiveness Analysis
- By Country
- By Chemical Type
- By Application
- By Dye Type
- By End Use
- By Sales Model
- Key Takeaways
- South Asia and Pacific Market Analysis and Forecast, By Country
- Historical Market Size Value (USD Million) & Volume (Unit) Trend Analysis By Market Taxonomy, 2021 to 2025
- Market Size Value (USD Million) & Volume (Unit) Forecast By Market Taxonomy, 2026 to 2036
- By Country
- India
- ASEAN
- Australia & New Zealand
- Rest of South Asia and Pacific
- By Chemical Type
- By Application
- By Dye Type
- By End Use
- By Sales Model
- By Country
- Market Attractiveness Analysis
- By Country
- By Chemical Type
- By Application
- By Dye Type
- By End Use
- By Sales Model
- Key Takeaways
- Middle East & Africa Market Analysis and Forecast, By Country
- Historical Market Size Value (USD Million) & Volume (Unit) Trend Analysis By Market Taxonomy, 2021 to 2025
- Market Size Value (USD Million) & Volume (Unit) Forecast By Market Taxonomy, 2026 to 2036
- By Country
- Kingdom of Saudi Arabia
- Other GCC Countries
- Türkiye
- South Africa
- Other African Union
- Rest of Middle East & Africa
- By Chemical Type
- By Application
- By Dye Type
- By End Use
- By Sales Model
- By Country
- Market Attractiveness Analysis
- By Country
- By Chemical Type
- By Application
- By Dye Type
- By End Use
- By Sales Model
- Key Takeaways
- Key Countries Market Analysis
- USA
- Pricing Analysis
- Market Share Analysis, 2025
- By Chemical Type
- By Application
- By Dye Type
- By End Use
- By Sales Model
- Canada
- Pricing Analysis
- Market Share Analysis, 2025
- By Chemical Type
- By Application
- By Dye Type
- By End Use
- By Sales Model
- Mexico
- Pricing Analysis
- Market Share Analysis, 2025
- By Chemical Type
- By Application
- By Dye Type
- By End Use
- By Sales Model
- Brazil
- Pricing Analysis
- Market Share Analysis, 2025
- By Chemical Type
- By Application
- By Dye Type
- By End Use
- By Sales Model
- Chile
- Pricing Analysis
- Market Share Analysis, 2025
- By Chemical Type
- By Application
- By Dye Type
- By End Use
- By Sales Model
- Germany
- Pricing Analysis
- Market Share Analysis, 2025
- By Chemical Type
- By Application
- By Dye Type
- By End Use
- By Sales Model
- UK
- Pricing Analysis
- Market Share Analysis, 2025
- By Chemical Type
- By Application
- By Dye Type
- By End Use
- By Sales Model
- Italy
- Pricing Analysis
- Market Share Analysis, 2025
- By Chemical Type
- By Application
- By Dye Type
- By End Use
- By Sales Model
- Spain
- Pricing Analysis
- Market Share Analysis, 2025
- By Chemical Type
- By Application
- By Dye Type
- By End Use
- By Sales Model
- France
- Pricing Analysis
- Market Share Analysis, 2025
- By Chemical Type
- By Application
- By Dye Type
- By End Use
- By Sales Model
- India
- Pricing Analysis
- Market Share Analysis, 2025
- By Chemical Type
- By Application
- By Dye Type
- By End Use
- By Sales Model
- ASEAN
- Pricing Analysis
- Market Share Analysis, 2025
- By Chemical Type
- By Application
- By Dye Type
- By End Use
- By Sales Model
- Australia & New Zealand
- Pricing Analysis
- Market Share Analysis, 2025
- By Chemical Type
- By Application
- By Dye Type
- By End Use
- By Sales Model
- China
- Pricing Analysis
- Market Share Analysis, 2025
- By Chemical Type
- By Application
- By Dye Type
- By End Use
- By Sales Model
- Japan
- Pricing Analysis
- Market Share Analysis, 2025
- By Chemical Type
- By Application
- By Dye Type
- By End Use
- By Sales Model
- South Korea
- Pricing Analysis
- Market Share Analysis, 2025
- By Chemical Type
- By Application
- By Dye Type
- By End Use
- By Sales Model
- Russia
- Pricing Analysis
- Market Share Analysis, 2025
- By Chemical Type
- By Application
- By Dye Type
- By End Use
- By Sales Model
- Poland
- Pricing Analysis
- Market Share Analysis, 2025
- By Chemical Type
- By Application
- By Dye Type
- By End Use
- By Sales Model
- Hungary
- Pricing Analysis
- Market Share Analysis, 2025
- By Chemical Type
- By Application
- By Dye Type
- By End Use
- By Sales Model
- Kingdom of Saudi Arabia
- Pricing Analysis
- Market Share Analysis, 2025
- By Chemical Type
- By Application
- By Dye Type
- By End Use
- By Sales Model
- Türkiye
- Pricing Analysis
- Market Share Analysis, 2025
- By Chemical Type
- By Application
- By Dye Type
- By End Use
- By Sales Model
- South Africa
- Pricing Analysis
- Market Share Analysis, 2025
- By Chemical Type
- By Application
- By Dye Type
- By End Use
- By Sales Model
- USA
- Market Structure Analysis
- Competition Dashboard
- Competition Benchmarking
- Market Share Analysis of Top Players
- By Regional
- By Chemical Type
- By Application
- By Dye Type
- By End Use
- By Sales Model
- Emerging Startups
- Innovation Benchmarking
- Competition Analysis
- Competition Deep Dive
- Ecolab
- Overview
- Product Portfolio
- Profitability by Market Segments (Product/Region/Sales Channel)
- Sales Footprint
- Strategy Overview
- Marketing Strategy
- Product Strategy
- Channel Strategy
- Kemira
- Solenis
- SNF Group
- Kurita Water Industries
- Ecolab
- Case Studies
- Success Stories
- Recent Developments
- Competition Deep Dive
- Assumptions & Acronyms Used


