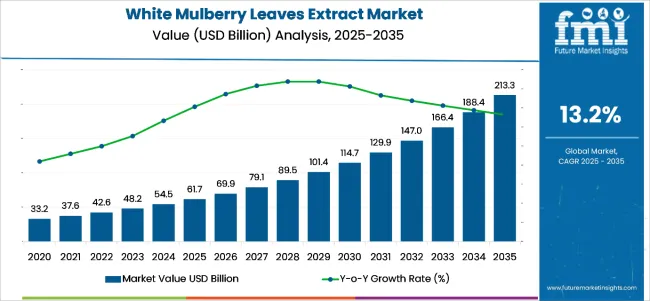
The global white mulberry leaves extract market is valued at USD 61.7 billion in 2025. It is forecasted to grow at a CAGR of 13.2% to have an estimated value of USD 213.3 billion by 2035.
White mulberry trees belong to the Moraceae family of plants which are naturally found in temperate climates and are being grown more and more because of the many advantages they offer.
There are medicinal advantages to the extracts made from white mulberry leaves. Since mulberry leaf extracts help people manage their health conditions and lead balanced lives their sales are increasing as more people are inclined to consume them.
In addition to the many therapeutic benefits of white mulberry leaf extract white mulberry trees are essential for the rearing of silkworms because the worms eat the leaves.
| Attributes | Description |
|---|---|
| Estimated Global Industry Size (2025E) | USD 61.7 Billion |
| Projected Global Industry Value (2035F) | USD 213.3 Billion |
| Value-based CAGR (2025 to 2035) | 13.2% |
White mulberry leaf extracts substantial health benefits which include lowering blood sugar and insulin levels promoting weight loss enhancing heart health and more have contributed to the products market expansion. As a result, during the forecast period the market share for extracts from white mulberry leaves is anticipated to grow.
The white mulberry leaves extract market is expanding globally, with Asia-Pacific, North America, and Europe showing distinct growth trajectories. Long-standing traditional use in Asia is being complemented by strong adoption in Western health and wellness sectors.
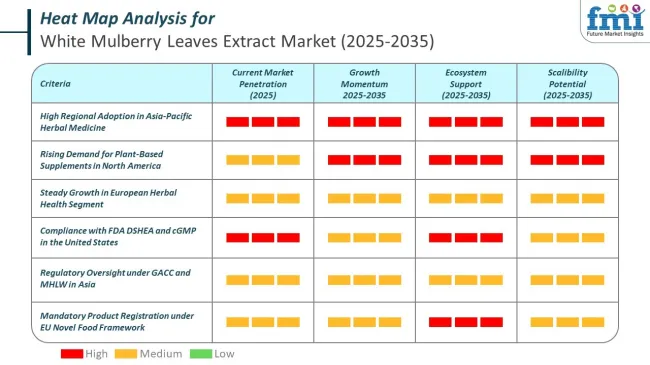
The White Mulberry Leaves Extract Market is governed by country-specific frameworks that regulate safety, labeling, and permitted claims. The United States, China, and Japan have established oversight pathways to manage ingredient classification, claim restrictions, and import procedures.
Access to the white mulberry leaves extract market in India and the European Union is structured through mandatory product registration, approved ingredient use, and strict labeling standards. Local authorities in these regions enforce compliance through traceability, documentation, and harmonized health claim guidance.
Increased demand for naturally sourced nutraceuticals due to growing health consciousness is one of the main factors propelling the market for white mulberry leaf extract. Dietary fibers found in white mulberry leaf extract help lower blood pressure blood insulin levels and the risk of heart attacks. They also improve blood circulation and gut health in the general population.
Due to there is a great demand for skin-lightening and anti-aging products the cosmetic industry uses extracts from white mulberry leaves. The antioxidants prevent cellular damage brought on by radiation exposure and food digestion and the extracts also have anti-inflammatory qualities.
The growing incidence of chronic illnesses is the primary factor propelling the market for white mulberry leaf extract. Consuming white mulberry leaf extract can help reduce inflammation and oxidative stress which are linked to an increased risk of chronic diseases like diabetes heart disease and cancer.
During the period 2020 to 2024, the sales grew at a CAGR of 12.5%, and it is predicted to continue to grow at a CAGR of 13.2% during the forecast period of 2025 to 2035.
Growing consumer awareness of white mulberry leaf extracts health benefits such as blood sugar regulation and weight management is one of the factors propelling the markets growth. The market is expanding due to the growing demand for natural and plant-based ingredients in functional foods dietary supplements and nutraceuticals.
Furthermore, its appeal is increased by the growing interest in natural skincare products and traditional herbal remedies. Further bolstering market expansion are developments in extraction technologies and expanded distribution networks. White mulberry leaf extract is becoming more widely available and well-liked worldwide thanks to government funding for research into herbal medicines and the growth of online shopping sites.
Technological developments and continuous innovation in the market for white mulberry leaf extract are greatly improving the quality and accessibility of products. Supercritical fluid extraction and advanced solvent extraction are two examples of extraction technique advancements that increase the extracts potency and purity.
Better uniformity and standardization in product formulations are also made possible by technology. Packaging innovations such as eco-friendly materials and intuitive designs satisfy consumer demands for convenient and sustainable products. Furthermore, precise active compound identification and quantification are guaranteed by developments in analytical techniques. Thanks to improvements in product efficacy safety and consumer trust these technological advancements support the expanding market.
Tier 1 companies includes industry leaders acquiring a 20% share in the global business market. These leaders are distinguished by their extensive product portfolio and high production capacity. These industry leaders stand out due to their broad geographic reach, in-depth knowledge of manufacturing and reconditioning across various formats and strong customer base. They offer a variety of services and manufacturing with the newest technology while adhering to legal requirements for the best quality.
Tier 2 companies comprises of mid-size players having a presence in some regions and highly influencing the local commerce and has a market share of 30%. These are distinguished by their robust global presence and solid business acumen. These industry participants may not have cutting-edge technology or a broad global reach but they do have good technology and guarantee regulatory compliance.
Tier 3 companies includes mostly of small-scale businesses serving niche economies and running at the local presence having a market share of 50%. Due to their notable focus on meeting local needs these businesses are categorized as belonging to the tier 3 segment, they are minor players with a constrained geographic scope. As an unorganized ecosystem Tier 3 in this context refers to a sector that in contrast to its organized competitors, lacks extensive structure and formalization.
The following table shows the forecasted growth rates of the significant three geographies revenues. USA, Germany and China come under the exhibit of high consumption, recording CAGRs of 9.1%, 7.1% and 8.0%, respectively, through 2035.
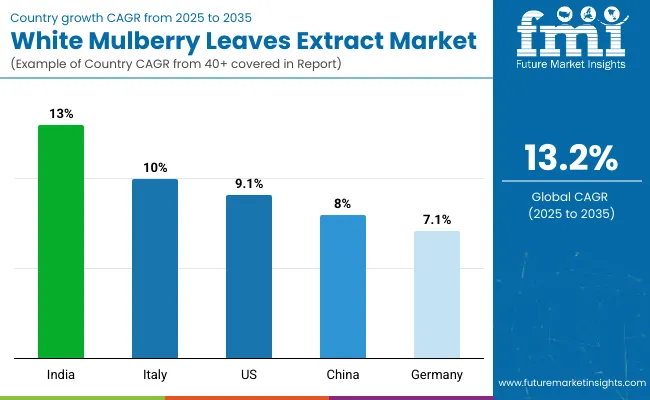
| Countries | CAGR, 2025 to 2035 |
|---|---|
| United States | 9.1% |
| Germany | 7.1% |
| China | 8.0% |
The United States is the dominant country in North America because of its emphasis on natural and organic products. Growing consumer knowledge of the advantages of natural supplements and the regions sophisticated healthcare system fuel demand. Additionally, supportive of market expansion is the trend toward preventive healthcare.
Due to the strong demand for dietary supplements and traditional medicine the Asia Pacific region leads the market for mulberry leaf extract. With their extensive herbal medicine history and growing health consciousness China is a major contributor. Market expansion is also supported by the nations expanding population and rising disposable incomes.
Europe is growing steadily with nations like Germany focusing on natural health remedies and wellness. The country’s strict laws governing artificial supplements promote the use of natural substitutes such as mulberry leaf extract. The growing popularity of plant-based diets and veganism further piques consumer interest.
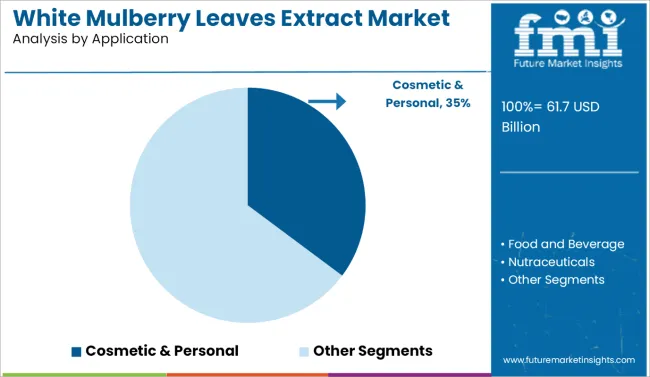
| Segment | Value Share (2025) |
|---|---|
| Cosmetic & Personal (Application) | 35% |
White mulberry leaf extract has also gained popularity in the beauty and personal care sector because of its anti-aging and skin-brightening qualities. The market for ingredients like white mulberry extract which has anti-inflammatory and skin-soothing properties has grown as consumers place a higher value on natural and clean beauty products.
As producers look to take advantage of White Mulberry leaf extracts antioxidant qualities which appeal to consumers the market for natural and organic cosmetics is expanding.
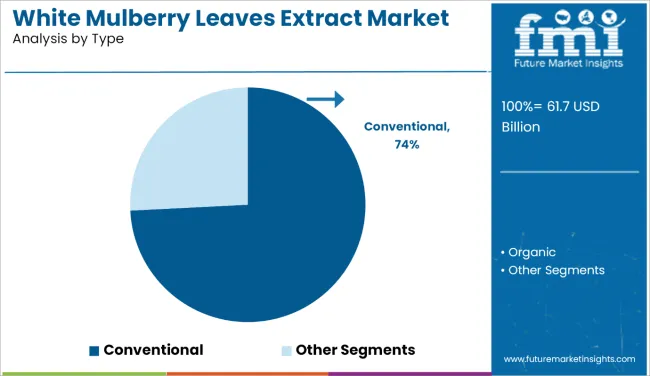
| Segment | Value Share (2025) |
|---|---|
| Conventional (Type) | 74% |
The conventional type is in line with consumer preferences for natural products over synthetic ones as demand for plant-based and herbal supplements rises. The accessibility and demand for mulberry leaf extract in dietary supplements are also being increased by the growing emphasis on preventive healthcare and the growing e-commerce industry.
Getting a competitive edge in the market is the main goal of the major players in the white mulberry leaves extract market. Rivals in the White Mulberry Leaves Extract Market concentrate on creating novel goods and launching them into the intended market. Companies in the White Mulberry Leaves Extract Market also consider the formation of strategic alliances.
The market for white mulberry leaf extract is also influenced by factors like the growing demand for natural and organic ingredients in nutraceuticals and personal care products the widespread knowledge of the advantages of white mulberry leaves and the rising incomes of people in emerging markets.
By type, industry has been categorized into conventional and organic
By form industry has been categorized into Powder, Liquid and Capsule
By application industry has been categorized into Food and Beverage, Cosmetics and Personal Care, Nutraceuticals and Pharmaceuticals
Industry analysis has been carried out in key countries of North America; Europe, Middle East, Africa, ASEAN, South Asia, Asia, New Zealand and Australia
The market is expected to grow at a CAGR of 13.2% throughout the forecast period.
By 2035, the sales value is expected to be worth USD 213.3 billion.
Growing need for healthy product is increasing demand for White Mulberry Leaves Extract.
North America is expected to dominate the global consumption.
Some of the key players in manufacturing include Swanson Health Products, Xi'an Greena Biotech Co. Ltd., Nutra Business, Bio Nutrition, Inc. and more.
Table 1: Global Market Value (US$ Million) Forecast by Region, 2017 to 2032
Table 2: Global Market Volume (Tons) Forecast by Region, 2017 to 2032
Table 3: Global Market Value (US$ Million) Forecast by End-use Application, 2017 to 2032
Table 4: Global Market Volume (Tons) Forecast by End-use Application, 2017 to 2032
Table 5: Global Market Value (US$ Million) Forecast by Use, 2017 to 2032
Table 6: Global Market Volume (Tons) Forecast by Use, 2017 to 2032
Table 7: North America Market Value (US$ Million) Forecast by Country, 2017 to 2032
Table 8: North America Market Volume (Tons) Forecast by Country, 2017 to 2032
Table 9: North America Market Value (US$ Million) Forecast by End-use Application, 2017 to 2032
Table 10: North America Market Volume (Tons) Forecast by End-use Application, 2017 to 2032
Table 11: North America Market Value (US$ Million) Forecast by Use, 2017 to 2032
Table 12: North America Market Volume (Tons) Forecast by Use, 2017 to 2032
Table 13: Latin America Market Value (US$ Million) Forecast by Country, 2017 to 2032
Table 14: Latin America Market Volume (Tons) Forecast by Country, 2017 to 2032
Table 15: Latin America Market Value (US$ Million) Forecast by End-use Application, 2017 to 2032
Table 16: Latin America Market Volume (Tons) Forecast by End-use Application, 2017 to 2032
Table 17: Latin America Market Value (US$ Million) Forecast by Use, 2017 to 2032
Table 18: Latin America Market Volume (Tons) Forecast by Use, 2017 to 2032
Table 19: Europe Market Value (US$ Million) Forecast by Country, 2017 to 2032
Table 20: Europe Market Volume (Tons) Forecast by Country, 2017 to 2032
Table 21: Europe Market Value (US$ Million) Forecast by End-use Application, 2017 to 2032
Table 22: Europe Market Volume (Tons) Forecast by End-use Application, 2017 to 2032
Table 23: Europe Market Value (US$ Million) Forecast by Use, 2017 to 2032
Table 24: Europe Market Volume (Tons) Forecast by Use, 2017 to 2032
Table 25: Asia Pacific Market Value (US$ Million) Forecast by Country, 2017 to 2032
Table 26: Asia Pacific Market Volume (Tons) Forecast by Country, 2017 to 2032
Table 27: Asia Pacific Market Value (US$ Million) Forecast by End-use Application, 2017 to 2032
Table 28: Asia Pacific Market Volume (Tons) Forecast by End-use Application, 2017 to 2032
Table 29: Asia Pacific Market Value (US$ Million) Forecast by Use, 2017 to 2032
Table 30: Asia Pacific Market Volume (Tons) Forecast by Use, 2017 to 2032
Table 31: MEA Market Value (US$ Million) Forecast by Country, 2017 to 2032
Table 32: MEA Market Volume (Tons) Forecast by Country, 2017 to 2032
Table 33: MEA Market Value (US$ Million) Forecast by End-use Application, 2017 to 2032
Table 34: MEA Market Volume (Tons) Forecast by End-use Application, 2017 to 2032
Table 35: MEA Market Value (US$ Million) Forecast by Use, 2017 to 2032
Table 36: MEA Market Volume (Tons) Forecast by Use, 2017 to 2032
Figure 1: Global Market Value (US$ Million) by End-use Application, 2022 to 2032
Figure 2: Global Market Value (US$ Million) by Use, 2022 to 2032
Figure 3: Global Market Value (US$ Million) by Region, 2022 to 2032
Figure 4: Global Market Value (US$ Million) Analysis by Region, 2017 to 2032
Figure 5: Global Market Volume (Tons) Analysis by Region, 2017 to 2032
Figure 6: Global Market Value Share (%) and BPS Analysis by Region, 2022 to 2032
Figure 7: Global Market Y-o-Y Growth (%) Projections by Region, 2022 to 2032
Figure 8: Global Market Value (US$ Million) Analysis by End-use Application, 2017 to 2032
Figure 9: Global Market Volume (Tons) Analysis by End-use Application, 2017 to 2032
Figure 10: Global Market Value Share (%) and BPS Analysis by End-use Application, 2022 to 2032
Figure 11: Global Market Y-o-Y Growth (%) Projections by End-use Application, 2022 to 2032
Figure 12: Global Market Value (US$ Million) Analysis by Use, 2017 to 2032
Figure 13: Global Market Volume (Tons) Analysis by Use, 2017 to 2032
Figure 14: Global Market Value Share (%) and BPS Analysis by Use, 2022 to 2032
Figure 15: Global Market Y-o-Y Growth (%) Projections by Use, 2022 to 2032
Figure 16: Global Market Attractiveness by End-use Application, 2022 to 2032
Figure 17: Global Market Attractiveness by Use, 2022 to 2032
Figure 18: Global Market Attractiveness by Region, 2022 to 2032
Figure 19: North America Market Value (US$ Million) by End-use Application, 2022 to 2032
Figure 20: North America Market Value (US$ Million) by Use, 2022 to 2032
Figure 21: North America Market Value (US$ Million) by Country, 2022 to 2032
Figure 22: North America Market Value (US$ Million) Analysis by Country, 2017 to 2032
Figure 23: North America Market Volume (Tons) Analysis by Country, 2017 to 2032
Figure 24: North America Market Value Share (%) and BPS Analysis by Country, 2022 to 2032
Figure 25: North America Market Y-o-Y Growth (%) Projections by Country, 2022 to 2032
Figure 26: North America Market Value (US$ Million) Analysis by End-use Application, 2017 to 2032
Figure 27: North America Market Volume (Tons) Analysis by End-use Application, 2017 to 2032
Figure 28: North America Market Value Share (%) and BPS Analysis by End-use Application, 2022 to 2032
Figure 29: North America Market Y-o-Y Growth (%) Projections by End-use Application, 2022 to 2032
Figure 30: North America Market Value (US$ Million) Analysis by Use, 2017 to 2032
Figure 31: North America Market Volume (Tons) Analysis by Use, 2017 to 2032
Figure 32: North America Market Value Share (%) and BPS Analysis by Use, 2022 to 2032
Figure 33: North America Market Y-o-Y Growth (%) Projections by Use, 2022 to 2032
Figure 34: North America Market Attractiveness by End-use Application, 2022 to 2032
Figure 35: North America Market Attractiveness by Use, 2022 to 2032
Figure 36: North America Market Attractiveness by Country, 2022 to 2032
Figure 37: Latin America Market Value (US$ Million) by End-use Application, 2022 to 2032
Figure 38: Latin America Market Value (US$ Million) by Use, 2022 to 2032
Figure 39: Latin America Market Value (US$ Million) by Country, 2022 to 2032
Figure 40: Latin America Market Value (US$ Million) Analysis by Country, 2017 to 2032
Figure 41: Latin America Market Volume (Tons) Analysis by Country, 2017 to 2032
Figure 42: Latin America Market Value Share (%) and BPS Analysis by Country, 2022 to 2032
Figure 43: Latin America Market Y-o-Y Growth (%) Projections by Country, 2022 to 2032
Figure 44: Latin America Market Value (US$ Million) Analysis by End-use Application, 2017 to 2032
Figure 45: Latin America Market Volume (Tons) Analysis by End-use Application, 2017 to 2032
Figure 46: Latin America Market Value Share (%) and BPS Analysis by End-use Application, 2022 to 2032
Figure 47: Latin America Market Y-o-Y Growth (%) Projections by End-use Application, 2022 to 2032
Figure 48: Latin America Market Value (US$ Million) Analysis by Use, 2017 to 2032
Figure 49: Latin America Market Volume (Tons) Analysis by Use, 2017 to 2032
Figure 50: Latin America Market Value Share (%) and BPS Analysis by Use, 2022 to 2032
Figure 51: Latin America Market Y-o-Y Growth (%) Projections by Use, 2022 to 2032
Figure 52: Latin America Market Attractiveness by End-use Application, 2022 to 2032
Figure 53: Latin America Market Attractiveness by Use, 2022 to 2032
Figure 54: Latin America Market Attractiveness by Country, 2022 to 2032
Figure 55: Europe Market Value (US$ Million) by End-use Application, 2022 to 2032
Figure 56: Europe Market Value (US$ Million) by Use, 2022 to 2032
Figure 57: Europe Market Value (US$ Million) by Country, 2022 to 2032
Figure 58: Europe Market Value (US$ Million) Analysis by Country, 2017 to 2032
Figure 59: Europe Market Volume (Tons) Analysis by Country, 2017 to 2032
Figure 60: Europe Market Value Share (%) and BPS Analysis by Country, 2022 to 2032
Figure 61: Europe Market Y-o-Y Growth (%) Projections by Country, 2022 to 2032
Figure 62: Europe Market Value (US$ Million) Analysis by End-use Application, 2017 to 2032
Figure 63: Europe Market Volume (Tons) Analysis by End-use Application, 2017 to 2032
Figure 64: Europe Market Value Share (%) and BPS Analysis by End-use Application, 2022 to 2032
Figure 65: Europe Market Y-o-Y Growth (%) Projections by End-use Application, 2022 to 2032
Figure 66: Europe Market Value (US$ Million) Analysis by Use, 2017 to 2032
Figure 67: Europe Market Volume (Tons) Analysis by Use, 2017 to 2032
Figure 68: Europe Market Value Share (%) and BPS Analysis by Use, 2022 to 2032
Figure 69: Europe Market Y-o-Y Growth (%) Projections by Use, 2022 to 2032
Figure 70: Europe Market Attractiveness by End-use Application, 2022 to 2032
Figure 71: Europe Market Attractiveness by Use, 2022 to 2032
Figure 72: Europe Market Attractiveness by Country, 2022 to 2032
Figure 73: Asia Pacific Market Value (US$ Million) by End-use Application, 2022 to 2032
Figure 74: Asia Pacific Market Value (US$ Million) by Use, 2022 to 2032
Figure 75: Asia Pacific Market Value (US$ Million) by Country, 2022 to 2032
Figure 76: Asia Pacific Market Value (US$ Million) Analysis by Country, 2017 to 2032
Figure 77: Asia Pacific Market Volume (Tons) Analysis by Country, 2017 to 2032
Figure 78: Asia Pacific Market Value Share (%) and BPS Analysis by Country, 2022 to 2032
Figure 79: Asia Pacific Market Y-o-Y Growth (%) Projections by Country, 2022 to 2032
Figure 80: Asia Pacific Market Value (US$ Million) Analysis by End-use Application, 2017 to 2032
Figure 81: Asia Pacific Market Volume (Tons) Analysis by End-use Application, 2017 to 2032
Figure 82: Asia Pacific Market Value Share (%) and BPS Analysis by End-use Application, 2022 to 2032
Figure 83: Asia Pacific Market Y-o-Y Growth (%) Projections by End-use Application, 2022 to 2032
Figure 84: Asia Pacific Market Value (US$ Million) Analysis by Use, 2017 to 2032
Figure 85: Asia Pacific Market Volume (Tons) Analysis by Use, 2017 to 2032
Figure 86: Asia Pacific Market Value Share (%) and BPS Analysis by Use, 2022 to 2032
Figure 87: Asia Pacific Market Y-o-Y Growth (%) Projections by Use, 2022 to 2032
Figure 88: Asia Pacific Market Attractiveness by End-use Application, 2022 to 2032
Figure 89: Asia Pacific Market Attractiveness by Use, 2022 to 2032
Figure 90: Asia Pacific Market Attractiveness by Country, 2022 to 2032
Figure 91: MEA Market Value (US$ Million) by End-use Application, 2022 to 2032
Figure 92: MEA Market Value (US$ Million) by Use, 2022 to 2032
Figure 93: MEA Market Value (US$ Million) by Country, 2022 to 2032
Figure 94: MEA Market Value (US$ Million) Analysis by Country, 2017 to 2032
Figure 95: MEA Market Volume (Tons) Analysis by Country, 2017 to 2032
Figure 96: MEA Market Value Share (%) and BPS Analysis by Country, 2022 to 2032
Figure 97: MEA Market Y-o-Y Growth (%) Projections by Country, 2022 to 2032
Figure 98: MEA Market Value (US$ Million) Analysis by End-use Application, 2017 to 2032
Figure 99: MEA Market Volume (Tons) Analysis by End-use Application, 2017 to 2032
Figure 100: MEA Market Value Share (%) and BPS Analysis by End-use Application, 2022 to 2032
Figure 101: MEA Market Y-o-Y Growth (%) Projections by End-use Application, 2022 to 2032
Figure 102: MEA Market Value (US$ Million) Analysis by Use, 2017 to 2032
Figure 103: MEA Market Volume (Tons) Analysis by Use, 2017 to 2032
Figure 104: MEA Market Value Share (%) and BPS Analysis by Use, 2022 to 2032
Figure 105: MEA Market Y-o-Y Growth (%) Projections by Use, 2022 to 2032
Figure 106: MEA Market Attractiveness by End-use Application, 2022 to 2032
Figure 107: MEA Market Attractiveness by Use, 2022 to 2032
Figure 108: MEA Market Attractiveness by Country, 2022 to 2032


Full Research Suite comprises of:
Market outlook & trends analysis
Interviews & case studies
Strategic recommendations
Vendor profiles & capabilities analysis
5-year forecasts
8 regions and 60+ country-level data splits
Market segment data splits
12 months of continuous data updates
DELIVERED AS:
PDF EXCEL ONLINE
White Inorganic Pigment Market Size and Share Forecast Outlook 2025 to 2035
White Matter Injury Treatment Market Size and Share Forecast Outlook 2025 to 2035
Whitening Gold Peptide Complex Market Size and Share Forecast Outlook 2025 to 2035
White Wheat Malt Market Size and Share Forecast Outlook 2025 to 2035
White Box Server Market Size and Share Forecast Outlook 2025 to 2035
White Charcoal Powder Market Size, Growth, and Forecast for 2025 to 2035
White Sneakers Market Insights - Size & Forecast 2025 to 2035
White Pepper Market Analysis by Product Type, Form, Application and Distribution Channel Through 2035
White Mineral Oil Market Analysis by Food, Pharmaceutical, Technical Through 2035
Leading Providers & Market Share in White Mushroom Industry
Competitive Overview of White Cement Market Share
White Top Testliner Market Growth & Trends 2024-2034
Whiteness Meter Market
White Line Chipboard Market
White Sack Kraft Paper Market
White Rice Flour Market
White Tea Extract Market Size and Share Forecast Outlook 2025 to 2035
TV White Space Spectrum Market Report - Growth & Forecast 2025 to 2035
Egg White Powder Market Size and Share Forecast Outlook 2025 to 2035
Egg White Cubes Market Size and Share Forecast Outlook 2025 to 2035

Thank you!
You will receive an email from our Business Development Manager. Please be sure to check your SPAM/JUNK folder too.
Chat With
MaRIA