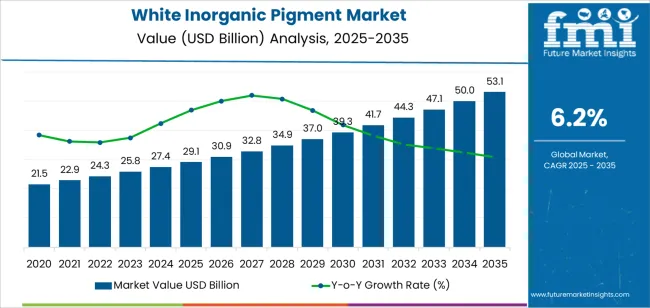
The white inorganic pigment market is expanding steadily, driven by the growing consumption of paints, coatings, plastics, and paper across multiple industries. White inorganic pigments are valued for their opacity, brightness, and UV resistance, which enhance aesthetic and protective properties in end-use products.
The market is primarily influenced by the recovery of construction activities and growth in automotive manufacturing, both of which demand high-quality coatings and surface finishes. Environmental regulations promoting non-toxic pigment formulations are also steering innovation in sustainable production technologies.
Manufacturers are focusing on achieving higher dispersion efficiency and thermal stability to meet performance standards. With continued demand from architectural and industrial applications, the market outlook remains favorable, reinforced by global infrastructure investment and material innovation..

| Metric | Value |
|---|---|
| White Inorganic Pigment Market Estimated Value in (2025 E) | USD 29.1 billion |
| White Inorganic Pigment Market Forecast Value in (2035 F) | USD 53.1 billion |
| Forecast CAGR (2025 to 2035) | 6.2% |
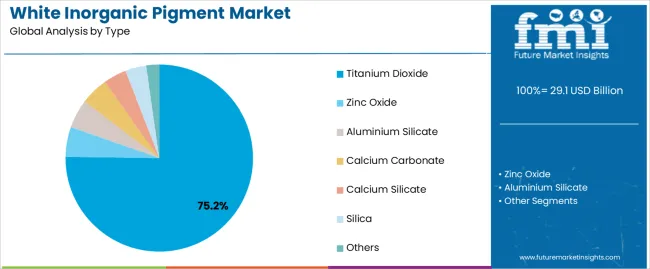
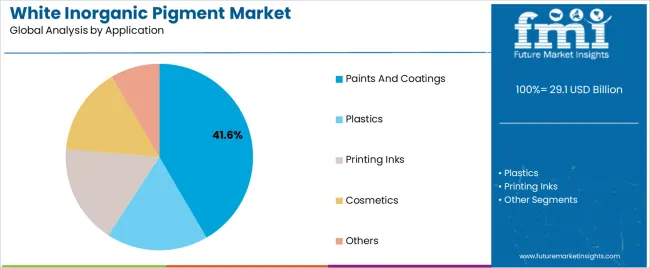
The market is segmented by Type and Application and region. By Type, the market is divided into Titanium Dioxide, Zinc Oxide, Aluminium Silicate, Calcium Carbonate, Calcium Silicate, Silica, and Others. In terms of Application, the market is classified into Paints And Coatings, Plastics, Printing Inks, Cosmetics, and Others. Regionally, the market is classified into North America, Latin America, Western Europe, Eastern Europe, Balkan & Baltic Countries, Russia & Belarus, Central Asia, East Asia, South Asia & Pacific, and the Middle East & Africa.

The titanium dioxide segment holds a dominant 75.20% share in the type category of the white inorganic pigment market. This leadership is driven by its superior refractive index, opacity, and brightness, which make it the most widely used pigment in paints, coatings, and plastics.
Titanium dioxide provides excellent UV resistance and weathering performance, essential for durable outdoor applications. Its production scalability and cost efficiency further reinforce its market share.
Ongoing research into chloride-process manufacturing and eco-friendly alternatives has improved sustainability and reduced waste generation. With increasing construction and automotive demand, titanium dioxide is expected to remain the primary pigment material throughout the forecast period..

The paints and coatings segment dominates the application category, representing approximately 41.60% of the white inorganic pigment market. This segment’s prominence is attributed to the widespread use of white pigments in decorative and industrial coatings for color retention, gloss enhancement, and corrosion resistance.
Construction growth in residential and commercial sectors continues to stimulate demand, alongside expanding automotive refinishing activities. The segment also benefits from rising architectural renovation projects in urban centers.
Formulation advancements enabling high opacity with lower pigment loads have improved performance and cost efficiency. With ongoing infrastructure expansion and durable coating innovations, the paints and coatings segment is expected to sustain its leadership in the coming years..
From 2020 to 2025, the white inorganic pigment market experienced a CAGR of 7.9%. White inorganic pigments are widely utilized in various industrial sectors such as manufacturing, aerospace, marine, and infrastructure for coating applications on metal substrates, machinery, and equipment.
These coatings serve multiple purposes, including corrosion protection, enhancing visibility, and providing decorative finishes, particularly in demanding industrial environments.
As global demand for high-quality white pigments continues to grow, the market is expected to witness steady expansion, driven by factors such as urbanization, industrialization, and technological advancements.
Environmental regulations drive demand for eco-friendly and low-VOC pigment formulations, prompting manufacturers to develop a sustainable solution. Projections indicate that the global white inorganic pigment market is expected to experience a CAGR of 6.2% from 2025 to 2035.
| Historical CAGR from 2020 to 2025 | 7.9% |
|---|---|
| Forecast CAGR from 2025 to 2035 | 6.2% |
The provided table highlights the top five countries in terms of revenue, with South Korea and Japan leading the list. South Korea, Japan, and China are significant contributors to the white inorganic pigment market, benefiting from their strong manufacturing base, technological advancements, and access to export markets.
| Countries | Forecast CAGRs from 2025 to 2035 |
|---|---|
| United States | 6.5% |
| United Kingdom | 7.4% |
| China | 6.9% |
| Japan | 7.7% |
| South Korea | 8.3% |
The white inorganic pigment market in the United States is expected to grow with a CAGR of 6.5% from 2025 to 2035. The construction sector in the United States is a major consumer of white inorganic pigments, particularly in architectural coatings used for residential, commercial, and industrial buildings.
With ongoing urbanization, infrastructure development projects, and renovations, there is a consistent demand for white pigments in paints, coatings, and construction materials. The automotive industry is another significant driver of the white inorganic pigment market in the United States.
The white inorganic pigment market in the United Kingdom is expected to grow with a CAGR of 7.4% from 2025 to 2035. The automotive sector in the United Kingdom also contributes to the demand for white inorganic pigments, especially in automotive coatings for vehicles' exteriors and interiors.
White pigments are essential for achieving desired colors, gloss levels, and UV resistance in automotive finishes. Various industrial sectors in the United Kingdom, including manufacturing, aerospace, marine, and infrastructure, utilize white inorganic pigments in industrial coatings for metal substrates, machinery, equipment, and infrastructure
The white inorganic pigment market in China is expected to grow with a CAGR of 6.9% from 2025 to 2035. China's rapid urbanization and ongoing infrastructure development projects have led to a surge in demand for white inorganic pigments, particularly in architectural coatings for residential, commercial, and industrial buildings.
The construction sector is a major consumer of white pigments in China, driving market growth. China's manufacturing sector, including automotive, electronics, appliances, and industrial equipment, requires white inorganic pigments for various coatings and applications.
The white inorganic pigment market in Japan is expected to grow with a CAGR of 7.7% from 2025 to 2035. Japan's automotive sector is one of the largest consumers of white inorganic pigments, particularly in automotive coatings for vehicles' exteriors and interiors.
White pigments are essential for achieving desired colors, gloss levels, and UV resistance in automotive finishes, contributing to the demand for white pigments in Japan.
Japan's electronics and appliance manufacturing sectors also contribute to the demand for white inorganic pigments. These pigments are used in coatings for electronic devices, appliances, and consumer goods to achieve desired colors, aesthetics, and protection against wear and corrosion.
The white inorganic pigment market in South Korea is expected to grow with a CAGR of 8.3% from 2025 to 2035. The increasing application of white inorganic pigment in manufacturing, aerospace, marine, and infrastructure drives market demand in the country. White pigments are also used in paints, coatings, and construction materials.
South Korea is known for its advancements in technology and innovation, including in pigment manufacturing processes, formulations, and applications. Korean companies invest in research and development to improve product performance, efficiency, and sustainability, driving growth in the white inorganic pigment market.
The below section shows the leading segment. The titanium dioxide segment is to grow at a CAGR of 6.0% from 2025 to 2035. Based on application, the paints and coatings segment is anticipated to hold a dominant share through 2035. It is set to exhibit a CAGR of 5.8% from 2025 to 2035.
| Category | CAGR |
|---|---|
| Titanium Dioxide | 6.0% |
| Paints and Coatings | 5.8% |
Based on the product, the titanium dioxide segment is anticipated to thrive at a CAGR of 6.0% from 2025 to 2035. Titanium dioxide offers excellent UV resistance, which is essential for outdoor applications such as architectural coatings, automotive finishes, and plastics exposed to sunlight.
Titanium dioxide exhibits exceptional opacity and brightness, making it one of the whitest and most opaque pigments available. TiO2 is chemically stable and inert under most conditions, which ensures the long-term durability and performance of products containing this pigment.
Titanium dioxide finds extensive use across diverse industries and applications, including architectural coatings, automotive coatings, plastics, cosmetics, inks, textiles, and paper.
Based on the application, the paints and coatings segment is anticipated to thrive at a CAGR of 5.8% from 2025 to 2035. White inorganic pigments, particularly titanium dioxide (TiO2), are widely used in architectural coatings for interior and exterior surfaces of residential, commercial, and industrial buildings. These coatings provide aesthetic appeal, durability, and protection against weathering, UV radiation, and environmental pollutants.
White inorganic pigments find applications in various industrial coatings used for metal substrates, machinery, equipment, appliances, and infrastructure. These coatings offer corrosion protection, chemical resistance, and decorative finishes in industrial environments such as manufacturing facilities, refineries, and chemical plants. White inorganic pigments are used in decorative paints, textured coatings, and specialty finishes for artistic and creative applications.

Market players are investing in R&D to enable innovation and develop new formulations, manufacturing processes, and applications for white inorganic pigments. Continuous improvement in product performance, cost-effectiveness, and sustainability drives market differentiation and strengthens market positions.
| Attributes | Details |
|---|---|
| Estimated Market Size in 2025 | USD 27.4 billion |
| Projected Market Valuation in 2035 | USD 50.2 billion |
| Value-based CAGR 2025 to 2035 | 6.2% |
| Forecast Period | 2025 to 2035 |
| Historical Data Available for | 2020 to 2025 |
| Market Analysis | Value in USD billion |
| Key Regions Covered |
|
| Key Market Segments Covered |
|
| Key Countries Profiled |
|
| Key Companies Profiled |
|
The global white inorganic pigment market is estimated to be valued at USD 29.1 billion in 2025.
The market size for the white inorganic pigment market is projected to reach USD 53.1 billion by 2035.
The white inorganic pigment market is expected to grow at a 6.2% CAGR between 2025 and 2035.
The key product types in white inorganic pigment market are titanium dioxide, zinc oxide, aluminium silicate, calcium carbonate, calcium silicate, silica and others.
In terms of application, paints and coatings segment to command 41.6% share in the white inorganic pigment market in 2025.


Our Research Products

The "Full Research Suite" delivers actionable market intel, deep dives on markets or technologies, so clients act faster, cut risk, and unlock growth.

The Leaderboard benchmarks and ranks top vendors, classifying them as Established Leaders, Leading Challengers, or Disruptors & Challengers.

Locates where complements amplify value and substitutes erode it, forecasting net impact by horizon

We deliver granular, decision-grade intel: market sizing, 5-year forecasts, pricing, adoption, usage, revenue, and operational KPIs—plus competitor tracking, regulation, and value chains—across 60 countries broadly.

Spot the shifts before they hit your P&L. We track inflection points, adoption curves, pricing moves, and ecosystem plays to show where demand is heading, why it is changing, and what to do next across high-growth markets and disruptive tech

Real-time reads of user behavior. We track shifting priorities, perceptions of today’s and next-gen services, and provider experience, then pace how fast tech moves from trial to adoption, blending buyer, consumer, and channel inputs with social signals (#WhySwitch, #UX).

Partner with our analyst team to build a custom report designed around your business priorities. From analysing market trends to assessing competitors or crafting bespoke datasets, we tailor insights to your needs.
Supplier Intelligence
Discovery & Profiling
Capacity & Footprint
Performance & Risk
Compliance & Governance
Commercial Readiness
Who Supplies Whom
Scorecards & Shortlists
Playbooks & Docs
Category Intelligence
Definition & Scope
Demand & Use Cases
Cost Drivers
Market Structure
Supply Chain Map
Trade & Policy
Operating Norms
Deliverables
Buyer Intelligence
Account Basics
Spend & Scope
Procurement Model
Vendor Requirements
Terms & Policies
Entry Strategy
Pain Points & Triggers
Outputs
Pricing Analysis
Benchmarks
Trends
Should-Cost
Indexation
Landed Cost
Commercial Terms
Deliverables
Brand Analysis
Positioning & Value Prop
Share & Presence
Customer Evidence
Go-to-Market
Digital & Reputation
Compliance & Trust
KPIs & Gaps
Outputs
Full Research Suite comprises of:
Market outlook & trends analysis
Interviews & case studies
Strategic recommendations
Vendor profiles & capabilities analysis
5-year forecasts
8 regions and 60+ country-level data splits
Market segment data splits
12 months of continuous data updates
DELIVERED AS:
PDF EXCEL ONLINE
Inorganic Cobalt Blue Pigments Market Size and Share Forecast Outlook 2025 to 2035
White Top Testliner Market Size and Share Forecast Outlook 2025 to 2035
Inorganic Scintillators Market Size and Share Forecast Outlook 2025 to 2035
Inorganic filler Market Size and Share Forecast Outlook 2025 to 2035
White Matter Injury Treatment Market Size and Share Forecast Outlook 2025 to 2035
White Tea Extract Market Size and Share Forecast Outlook 2025 to 2035
Inorganic Oxides Market Size and Share Forecast Outlook 2025 to 2035
Whitening Gold Peptide Complex Market Size and Share Forecast Outlook 2025 to 2035
White Wheat Malt Market Size and Share Forecast Outlook 2025 to 2035
Inorganic Salts Market Size and Share Forecast Outlook 2025 to 2035
White Box Server Market Size and Share Forecast Outlook 2025 to 2035
Inorganic Zinc Coatings Market Size and Share Forecast Outlook 2025 to 2035
White Mulberry Leaves Extract Market Growth - Product Type & Form Insights
Pigment Hot Stamping Foil Market Size and Share Forecast Outlook 2025 to 2035
White Charcoal Powder Market Size, Growth, and Forecast for 2025 to 2035
Pigmented Lesion Treatment Market Growth - Trends & Forecast 2025 to 2035
White Sneakers Market Insights - Size & Forecast 2025 to 2035
Inorganic Fungicide Market - Growth & Demand 2025 to 2035
White Pepper Market Analysis by Product Type, Form, Application and Distribution Channel Through 2035
White Mineral Oil Market Analysis by Food, Pharmaceutical, Technical Through 2035

Thank you!
You will receive an email from our Business Development Manager. Please be sure to check your SPAM/JUNK folder too.
Chat With
MaRIA