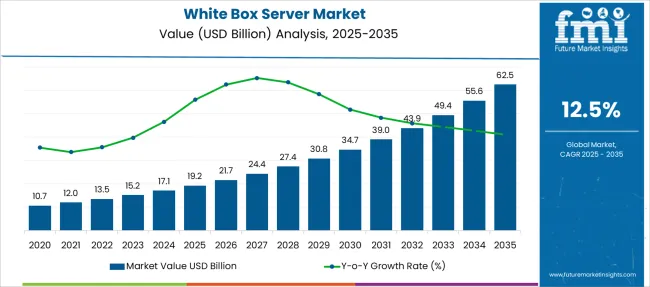
The global white box server market is forecasted to be valued at USD 43,993.5 million by 2032, up from USD 13,517.8 million in 2022, advancing at a CAGR of 12.5% during the forecast period.
The sales of white box servers are rising as they can be customized and can be home-built. The ease of customization for white box servers is leading to the rising adoption of white box servers amongst the masses.
Report Attribute | Details |
---|---|
White Box Server Market Value (2022) | USD 13,517.8 Million |
White Box Server Market Value (2032) | USD 43,993.5 Million |
White Box Server Market CAGR (2022 to 2032) | 12.5% |
Individual parts for this server can be easily replaced over the full replacement of the entire server when equipment fails. Due to this feature, Open Computer Project developers are increasingly using white box servers, bolstering the demand for white box servers in the global white box server market and escalating the key developments and opportunities.
In addition to that, major operating systems such as Windows Server, and Red Hat Enterprise Linux, as well as visualization software can be run on a white box server. Therefore, it is forecasted that the white box server market is likely to witness significant white box server market growth as well as a surge in white box server market future trends during the forecast period.
The major factor driving the demand for white box servers is their capability to run major operating systems. The server deploys clustering techniques to provide high availability and lower risk of unexpected downtime and is highly being adopted by the software industries.
The white box server is the computer structure in the huge data centers that offer high functionality to the enterprise resources boosting the white box server market opportunities.
It is anticipated that there is likely to be a rapid rise in demand for public cloud services, which has prompted cloud service providers to engage in fierce competition for the best pricing terms to gain more users. The white box servers are reducing operational and capital expenditures, and less cost and more functionality fuel the global growth of the white box server.
It is expensive and a viable alternative for cloud giants like Amazon and Google, as hyper-scalers paying a premium for OEM servers result in huge expenditures. It is projected that a rising usage of the internet and networking globally has increased the demand for more cloud space, which further propels the demand for more data centers, and subsequently fuels the demand for white box servers.
Large corporations are only willing to pay for their use and efficiently utilize the resources. Hence, white box servers are being highly adopted by them over OEM servers that are expensive; lower cost is driving the white box server market growth along with the white box server adoption trends on a large scale.
In addition to that, flexibility and customization are crucial factors spurring the growth of the white box server market, and demand for off-the-shelf cloud services providers such as Microsoft Azure, AWS, and Google are driving the white box server market expansion and also the white box server market key trends and opportunities.
It is expected that besides the driving factors, certain aspects are likely to curb the white box server market growth and white box server market opportunities. It is projected that the white box servers are majorly home-built and unbranded; the branded products can easily take over these ODMs (Original Design Manufacturers).
The white box servers have an unreliable life span; no assurance on the life span after installation of these servers can act as a major restraint in the white box server market opportunities and hinder the white box server market growth.
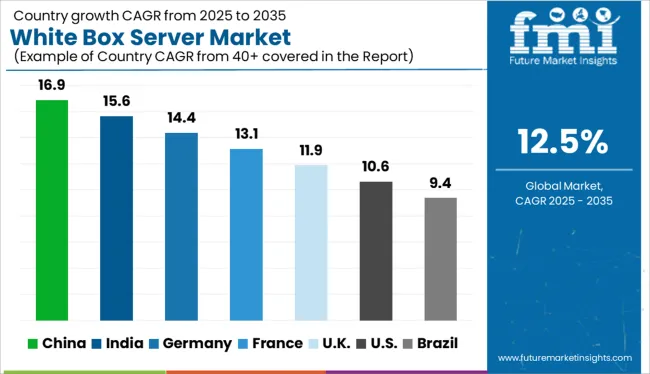
Based on the current market scenario, it is projected that North America is likely to lead the white box server market in the long run. Currently, the North American regions are accountable for 32.1% of the total white box server market share.
Due to this region witnessing an increase in the number of data centers for cloud computing services, and data analytics, the region is projected to propel the white box server market growth during the forecast period.
North America is owing to a notable white box server market share because it is home to numerous large corporations that are installing white box servers to deliver a faster and more reliable user experience (UI) and boost the white box server market's future trends.
The European white box server market size is also on the rise, following North American regions. Europe is projected to hold 23.7% of the total white box server market share. The increase in demand for white box servers and white box server market size in Europe is owing to the increased usage of internet applications, which require scalable data storage facilities.
Several ODMs in the European region have developed switching products and white box servers as they are more energy-efficient and cost-effective, which in turn is boosting the white box server market growth and the white box server adoption trends.
The start-up ecosystem in the white box server market is intense, with frequent innovations being made. Start-ups in the white box server market are focusing on improvising the devices with the integration of new facilities for faster results and convenience for the end-users, with reliable, more secure, and cost-effective means. Some of the start-up companies in the white box server market are Inspon, Cisco, Sugon Server, Quanta, and others.
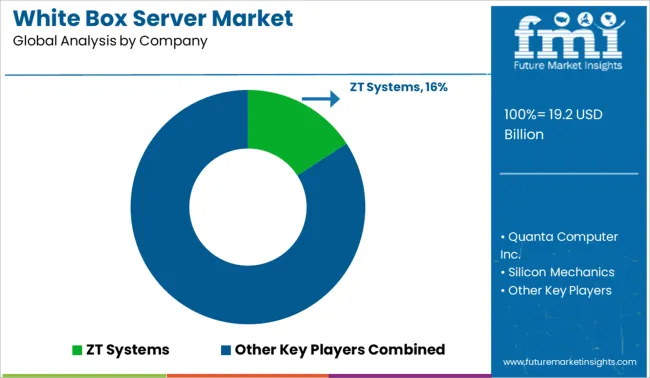
The biggies in the white box server market include Quanta Computer Inc., Servers Direct, Stack Velocity Group, Silicon Mechanics, Super Micro Computer Inc., Inventec Corporation, Wistron Corporation, Penguin Computing, and Hyve Solutions.
The white box server market manufacturers are deploying the best means to improvise the features of white box servers. They are investing in new technologies to produce innovative products. Government initiatives to help these key players are driving the white box server market. Initiatives are being taken for further enhancement of user experience and more flexibility in the adoption of white box servers.
Report Attribute | Details |
---|---|
Growth Rate | CAGR of 12.5% from 2022 to 2032 |
Base Year for Estimation | 2021 |
Historical Data | 2016 to 2021 |
Forecast Period | 2022 to 2032 |
Quantitative Units | Revenue in USD million and CAGR from 2022 to 2032 |
Report Coverage | Revenue Forecast, Volume Forecast, Company Ranking, Competitive Landscape, Growth Factors, Trends, and Pricing Analysis |
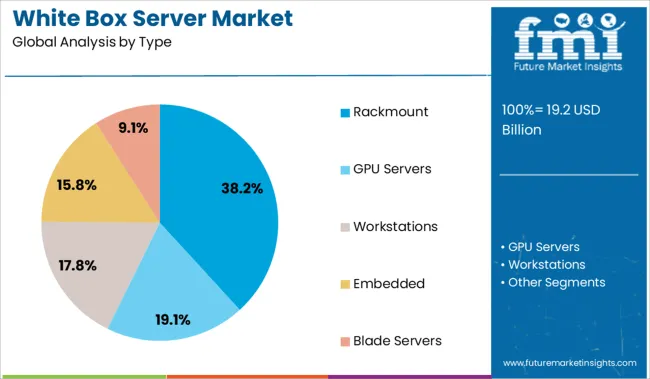
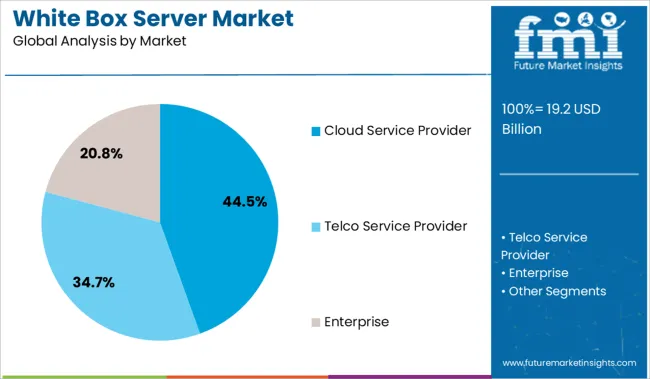
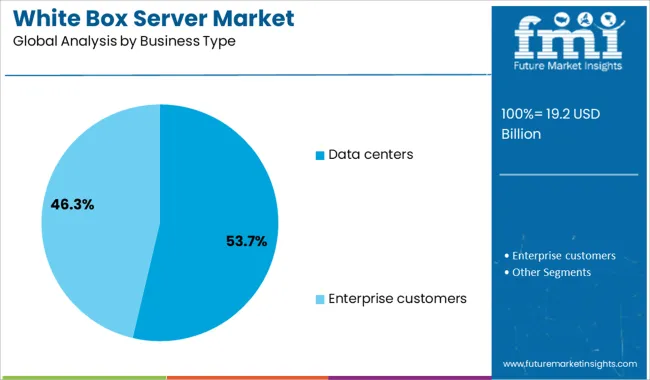
Segments Covered | Server Type, Business Type, Service Provider, Region |
Regions Covered | North America; Latin America; Europe; East Asia; South Asia; Oceania; Middle East and Africa |
Key Countries Profiled | United States of America, Canada, Brazil, Argentina, Germany, United Kingdom, France, Spain, Italy, Nordics, BENELUX, Australia & New Zealand, China, India, ASEAN, GCC Countries, South Africa |
Key Companies Profiled | Quanta Computer Inc.; Servers Direct; Stack Velocity Group; Silicon Mechanics; Super Micro Computer Inc.; Inventec Corporation; Wistron Corporation; Penguin Computing; Hyve Solutions |
Customization | Available Upon Request |
Table 1: Global Market Value (US$ Million) Forecast by Region, 2017 to 2032
Table 2: Global Market Volume (Units) Forecast by Region, 2017 to 2032
Table 3: Global Market Value (US$ Million) Forecast by Form Factor, 2017 to 2032
Table 4: Global Market Volume (Units) Forecast by Form Factor, 2017 to 2032
Table 5: Global Market Value (US$ Million) Forecast by Business Type, 2017 to 2032
Table 6: Global Market Volume (Units) Forecast by Business Type, 2017 to 2032
Table 7: Global Market Value (US$ Million) Forecast by Processor, 2017 to 2032
Table 8: Global Market Volume (Units) Forecast by Processor, 2017 to 2032
Table 9: Global Market Value (US$ Million) Forecast by Operating System, 2017 to 2032
Table 10: Global Market Volume (Units) Forecast by Operating System, 2017 to 2032
Table 11: North America Market Value (US$ Million) Forecast by Country, 2017 to 2032
Table 12: North America Market Volume (Units) Forecast by Country, 2017 to 2032
Table 13: North America Market Value (US$ Million) Forecast by Form Factor, 2017 to 2032
Table 14: North America Market Volume (Units) Forecast by Form Factor, 2017 to 2032
Table 15: North America Market Value (US$ Million) Forecast by Business Type, 2017 to 2032
Table 16: North America Market Volume (Units) Forecast by Business Type, 2017 to 2032
Table 17: North America Market Value (US$ Million) Forecast by Processor, 2017 to 2032
Table 18: North America Market Volume (Units) Forecast by Processor, 2017 to 2032
Table 19: North America Market Value (US$ Million) Forecast by Operating System, 2017 to 2032
Table 20: North America Market Volume (Units) Forecast by Operating System, 2017 to 2032
Table 21: Latin America Market Value (US$ Million) Forecast by Country, 2017 to 2032
Table 22: Latin America Market Volume (Units) Forecast by Country, 2017 to 2032
Table 23: Latin America Market Value (US$ Million) Forecast by Form Factor, 2017 to 2032
Table 24: Latin America Market Volume (Units) Forecast by Form Factor, 2017 to 2032
Table 25: Latin America Market Value (US$ Million) Forecast by Business Type, 2017 to 2032
Table 26: Latin America Market Volume (Units) Forecast by Business Type, 2017 to 2032
Table 27: Latin America Market Value (US$ Million) Forecast by Processor, 2017 to 2032
Table 28: Latin America Market Volume (Units) Forecast by Processor, 2017 to 2032
Table 29: Latin America Market Value (US$ Million) Forecast by Operating System, 2017 to 2032
Table 30: Latin America Market Volume (Units) Forecast by Operating System, 2017 to 2032
Table 31: Europe Market Value (US$ Million) Forecast by Country, 2017 to 2032
Table 32: Europe Market Volume (Units) Forecast by Country, 2017 to 2032
Table 33: Europe Market Value (US$ Million) Forecast by Form Factor, 2017 to 2032
Table 34: Europe Market Volume (Units) Forecast by Form Factor, 2017 to 2032
Table 35: Europe Market Value (US$ Million) Forecast by Business Type, 2017 to 2032
Table 36: Europe Market Volume (Units) Forecast by Business Type, 2017 to 2032
Table 37: Europe Market Value (US$ Million) Forecast by Processor, 2017 to 2032
Table 38: Europe Market Volume (Units) Forecast by Processor, 2017 to 2032
Table 39: Europe Market Value (US$ Million) Forecast by Operating System, 2017 to 2032
Table 40: Europe Market Volume (Units) Forecast by Operating System, 2017 to 2032
Table 41: Asia Pacific Market Value (US$ Million) Forecast by Country, 2017 to 2032
Table 42: Asia Pacific Market Volume (Units) Forecast by Country, 2017 to 2032
Table 43: Asia Pacific Market Value (US$ Million) Forecast by Form Factor, 2017 to 2032
Table 44: Asia Pacific Market Volume (Units) Forecast by Form Factor, 2017 to 2032
Table 45: Asia Pacific Market Value (US$ Million) Forecast by Business Type, 2017 to 2032
Table 46: Asia Pacific Market Volume (Units) Forecast by Business Type, 2017 to 2032
Table 47: Asia Pacific Market Value (US$ Million) Forecast by Processor, 2017 to 2032
Table 48: Asia Pacific Market Volume (Units) Forecast by Processor, 2017 to 2032
Table 49: Asia Pacific Market Value (US$ Million) Forecast by Operating System, 2017 to 2032
Table 50: Asia Pacific Market Volume (Units) Forecast by Operating System, 2017 to 2032
Table 51: Middle East and Africa Market Value (US$ Million) Forecast by Country, 2017 to 2032
Table 52: Middle East and Africa Market Volume (Units) Forecast by Country, 2017 to 2032
Table 53: Middle East and Africa Market Value (US$ Million) Forecast by Form Factor, 2017 to 2032
Table 54: Middle East and Africa Market Volume (Units) Forecast by Form Factor, 2017 to 2032
Table 55: Middle East and Africa Market Value (US$ Million) Forecast by Business Type, 2017 to 2032
Table 56: Middle East and Africa Market Volume (Units) Forecast by Business Type, 2017 to 2032
Table 57: Middle East and Africa Market Value (US$ Million) Forecast by Processor, 2017 to 2032
Table 58: Middle East and Africa Market Volume (Units) Forecast by Processor, 2017 to 2032
Table 59: Middle East and Africa Market Value (US$ Million) Forecast by Operating System, 2017 to 2032
Table 60: Middle East and Africa Market Volume (Units) Forecast by Operating System, 2017 to 2032
Figure 1: Global Market Value (US$ Million) by Form Factor, 2022 to 2032
Figure 2: Global Market Value (US$ Million) by Business Type, 2022 to 2032
Figure 3: Global Market Value (US$ Million) by Processor, 2022 to 2032
Figure 4: Global Market Value (US$ Million) by Operating System, 2022 to 2032
Figure 5: Global Market Value (US$ Million) by Region, 2022 to 2032
Figure 6: Global Market Value (US$ Million) Analysis by Region, 2017 to 2032
Figure 7: Global Market Volume (Units) Analysis by Region, 2017 to 2032
Figure 8: Global Market Value Share (%) and BPS Analysis by Region, 2022 to 2032
Figure 9: Global Market Y-o-Y Growth (%) Projections by Region, 2022 to 2032
Figure 10: Global Market Value (US$ Million) Analysis by Form Factor, 2017 to 2032
Figure 11: Global Market Volume (Units) Analysis by Form Factor, 2017 to 2032
Figure 12: Global Market Value Share (%) and BPS Analysis by Form Factor, 2022 to 2032
Figure 13: Global Market Y-o-Y Growth (%) Projections by Form Factor, 2022 to 2032
Figure 14: Global Market Value (US$ Million) Analysis by Business Type, 2017 to 2032
Figure 15: Global Market Volume (Units) Analysis by Business Type, 2017 to 2032
Figure 16: Global Market Value Share (%) and BPS Analysis by Business Type, 2022 to 2032
Figure 17: Global Market Y-o-Y Growth (%) Projections by Business Type, 2022 to 2032
Figure 18: Global Market Value (US$ Million) Analysis by Processor, 2017 to 2032
Figure 19: Global Market Volume (Units) Analysis by Processor, 2017 to 2032
Figure 20: Global Market Value Share (%) and BPS Analysis by Processor, 2022 to 2032
Figure 21: Global Market Y-o-Y Growth (%) Projections by Processor, 2022 to 2032
Figure 22: Global Market Value (US$ Million) Analysis by Operating System, 2017 to 2032
Figure 23: Global Market Volume (Units) Analysis by Operating System, 2017 to 2032
Figure 24: Global Market Value Share (%) and BPS Analysis by Operating System, 2022 to 2032
Figure 25: Global Market Y-o-Y Growth (%) Projections by Operating System, 2022 to 2032
Figure 26: Global Market Attractiveness by Form Factor, 2022 to 2032
Figure 27: Global Market Attractiveness by Business Type, 2022 to 2032
Figure 28: Global Market Attractiveness by Processor, 2022 to 2032
Figure 29: Global Market Attractiveness by Operating System, 2022 to 2032
Figure 30: Global Market Attractiveness by Region, 2022 to 2032
Figure 31: North America Market Value (US$ Million) by Form Factor, 2022 to 2032
Figure 32: North America Market Value (US$ Million) by Business Type, 2022 to 2032
Figure 33: North America Market Value (US$ Million) by Processor, 2022 to 2032
Figure 34: North America Market Value (US$ Million) by Operating System, 2022 to 2032
Figure 35: North America Market Value (US$ Million) by Country, 2022 to 2032
Figure 36: North America Market Value (US$ Million) Analysis by Country, 2017 to 2032
Figure 37: North America Market Volume (Units) Analysis by Country, 2017 to 2032
Figure 38: North America Market Value Share (%) and BPS Analysis by Country, 2022 to 2032
Figure 39: North America Market Y-o-Y Growth (%) Projections by Country, 2022 to 2032
Figure 40: North America Market Value (US$ Million) Analysis by Form Factor, 2017 to 2032
Figure 41: North America Market Volume (Units) Analysis by Form Factor, 2017 to 2032
Figure 42: North America Market Value Share (%) and BPS Analysis by Form Factor, 2022 to 2032
Figure 43: North America Market Y-o-Y Growth (%) Projections by Form Factor, 2022 to 2032
Figure 44: North America Market Value (US$ Million) Analysis by Business Type, 2017 to 2032
Figure 45: North America Market Volume (Units) Analysis by Business Type, 2017 to 2032
Figure 46: North America Market Value Share (%) and BPS Analysis by Business Type, 2022 to 2032
Figure 47: North America Market Y-o-Y Growth (%) Projections by Business Type, 2022 to 2032
Figure 48: North America Market Value (US$ Million) Analysis by Processor, 2017 to 2032
Figure 49: North America Market Volume (Units) Analysis by Processor, 2017 to 2032
Figure 50: North America Market Value Share (%) and BPS Analysis by Processor, 2022 to 2032
Figure 51: North America Market Y-o-Y Growth (%) Projections by Processor, 2022 to 2032
Figure 52: North America Market Value (US$ Million) Analysis by Operating System, 2017 to 2032
Figure 53: North America Market Volume (Units) Analysis by Operating System, 2017 to 2032
Figure 54: North America Market Value Share (%) and BPS Analysis by Operating System, 2022 to 2032
Figure 55: North America Market Y-o-Y Growth (%) Projections by Operating System, 2022 to 2032
Figure 56: North America Market Attractiveness by Form Factor, 2022 to 2032
Figure 57: North America Market Attractiveness by Business Type, 2022 to 2032
Figure 58: North America Market Attractiveness by Processor, 2022 to 2032
Figure 59: North America Market Attractiveness by Operating System, 2022 to 2032
Figure 60: North America Market Attractiveness by Country, 2022 to 2032
Figure 61: Latin America Market Value (US$ Million) by Form Factor, 2022 to 2032
Figure 62: Latin America Market Value (US$ Million) by Business Type, 2022 to 2032
Figure 63: Latin America Market Value (US$ Million) by Processor, 2022 to 2032
Figure 64: Latin America Market Value (US$ Million) by Operating System, 2022 to 2032
Figure 65: Latin America Market Value (US$ Million) by Country, 2022 to 2032
Figure 66: Latin America Market Value (US$ Million) Analysis by Country, 2017 to 2032
Figure 67: Latin America Market Volume (Units) Analysis by Country, 2017 to 2032
Figure 68: Latin America Market Value Share (%) and BPS Analysis by Country, 2022 to 2032
Figure 69: Latin America Market Y-o-Y Growth (%) Projections by Country, 2022 to 2032
Figure 70: Latin America Market Value (US$ Million) Analysis by Form Factor, 2017 to 2032
Figure 71: Latin America Market Volume (Units) Analysis by Form Factor, 2017 to 2032
Figure 72: Latin America Market Value Share (%) and BPS Analysis by Form Factor, 2022 to 2032
Figure 73: Latin America Market Y-o-Y Growth (%) Projections by Form Factor, 2022 to 2032
Figure 74: Latin America Market Value (US$ Million) Analysis by Business Type, 2017 to 2032
Figure 75: Latin America Market Volume (Units) Analysis by Business Type, 2017 to 2032
Figure 76: Latin America Market Value Share (%) and BPS Analysis by Business Type, 2022 to 2032
Figure 77: Latin America Market Y-o-Y Growth (%) Projections by Business Type, 2022 to 2032
Figure 78: Latin America Market Value (US$ Million) Analysis by Processor, 2017 to 2032
Figure 79: Latin America Market Volume (Units) Analysis by Processor, 2017 to 2032
Figure 80: Latin America Market Value Share (%) and BPS Analysis by Processor, 2022 to 2032
Figure 81: Latin America Market Y-o-Y Growth (%) Projections by Processor, 2022 to 2032
Figure 82: Latin America Market Value (US$ Million) Analysis by Operating System, 2017 to 2032
Figure 83: Latin America Market Volume (Units) Analysis by Operating System, 2017 to 2032
Figure 84: Latin America Market Value Share (%) and BPS Analysis by Operating System, 2022 to 2032
Figure 85: Latin America Market Y-o-Y Growth (%) Projections by Operating System, 2022 to 2032
Figure 86: Latin America Market Attractiveness by Form Factor, 2022 to 2032
Figure 87: Latin America Market Attractiveness by Business Type, 2022 to 2032
Figure 88: Latin America Market Attractiveness by Processor, 2022 to 2032
Figure 89: Latin America Market Attractiveness by Operating System, 2022 to 2032
Figure 90: Latin America Market Attractiveness by Country, 2022 to 2032
Figure 91: Europe Market Value (US$ Million) by Form Factor, 2022 to 2032
Figure 92: Europe Market Value (US$ Million) by Business Type, 2022 to 2032
Figure 93: Europe Market Value (US$ Million) by Processor, 2022 to 2032
Figure 94: Europe Market Value (US$ Million) by Operating System, 2022 to 2032
Figure 95: Europe Market Value (US$ Million) by Country, 2022 to 2032
Figure 96: Europe Market Value (US$ Million) Analysis by Country, 2017 to 2032
Figure 97: Europe Market Volume (Units) Analysis by Country, 2017 to 2032
Figure 98: Europe Market Value Share (%) and BPS Analysis by Country, 2022 to 2032
Figure 99: Europe Market Y-o-Y Growth (%) Projections by Country, 2022 to 2032
Figure 100: Europe Market Value (US$ Million) Analysis by Form Factor, 2017 to 2032
Figure 101: Europe Market Volume (Units) Analysis by Form Factor, 2017 to 2032
Figure 102: Europe Market Value Share (%) and BPS Analysis by Form Factor, 2022 to 2032
Figure 103: Europe Market Y-o-Y Growth (%) Projections by Form Factor, 2022 to 2032
Figure 104: Europe Market Value (US$ Million) Analysis by Business Type, 2017 to 2032
Figure 105: Europe Market Volume (Units) Analysis by Business Type, 2017 to 2032
Figure 106: Europe Market Value Share (%) and BPS Analysis by Business Type, 2022 to 2032
Figure 107: Europe Market Y-o-Y Growth (%) Projections by Business Type, 2022 to 2032
Figure 108: Europe Market Value (US$ Million) Analysis by Processor, 2017 to 2032
Figure 109: Europe Market Volume (Units) Analysis by Processor, 2017 to 2032
Figure 110: Europe Market Value Share (%) and BPS Analysis by Processor, 2022 to 2032
Figure 111: Europe Market Y-o-Y Growth (%) Projections by Processor, 2022 to 2032
Figure 112: Europe Market Value (US$ Million) Analysis by Operating System, 2017 to 2032
Figure 113: Europe Market Volume (Units) Analysis by Operating System, 2017 to 2032
Figure 114: Europe Market Value Share (%) and BPS Analysis by Operating System, 2022 to 2032
Figure 115: Europe Market Y-o-Y Growth (%) Projections by Operating System, 2022 to 2032
Figure 116: Europe Market Attractiveness by Form Factor, 2022 to 2032
Figure 117: Europe Market Attractiveness by Business Type, 2022 to 2032
Figure 118: Europe Market Attractiveness by Processor, 2022 to 2032
Figure 119: Europe Market Attractiveness by Operating System, 2022 to 2032
Figure 120: Europe Market Attractiveness by Country, 2022 to 2032
Figure 121: Asia Pacific Market Value (US$ Million) by Form Factor, 2022 to 2032
Figure 122: Asia Pacific Market Value (US$ Million) by Business Type, 2022 to 2032
Figure 123: Asia Pacific Market Value (US$ Million) by Processor, 2022 to 2032
Figure 124: Asia Pacific Market Value (US$ Million) by Operating System, 2022 to 2032
Figure 125: Asia Pacific Market Value (US$ Million) by Country, 2022 to 2032
Figure 126: Asia Pacific Market Value (US$ Million) Analysis by Country, 2017 to 2032
Figure 127: Asia Pacific Market Volume (Units) Analysis by Country, 2017 to 2032
Figure 128: Asia Pacific Market Value Share (%) and BPS Analysis by Country, 2022 to 2032
Figure 129: Asia Pacific Market Y-o-Y Growth (%) Projections by Country, 2022 to 2032
Figure 130: Asia Pacific Market Value (US$ Million) Analysis by Form Factor, 2017 to 2032
Figure 131: Asia Pacific Market Volume (Units) Analysis by Form Factor, 2017 to 2032
Figure 132: Asia Pacific Market Value Share (%) and BPS Analysis by Form Factor, 2022 to 2032
Figure 133: Asia Pacific Market Y-o-Y Growth (%) Projections by Form Factor, 2022 to 2032
Figure 134: Asia Pacific Market Value (US$ Million) Analysis by Business Type, 2017 to 2032
Figure 135: Asia Pacific Market Volume (Units) Analysis by Business Type, 2017 to 2032
Figure 136: Asia Pacific Market Value Share (%) and BPS Analysis by Business Type, 2022 to 2032
Figure 137: Asia Pacific Market Y-o-Y Growth (%) Projections by Business Type, 2022 to 2032
Figure 138: Asia Pacific Market Value (US$ Million) Analysis by Processor, 2017 to 2032
Figure 139: Asia Pacific Market Volume (Units) Analysis by Processor, 2017 to 2032
Figure 140: Asia Pacific Market Value Share (%) and BPS Analysis by Processor, 2022 to 2032
Figure 141: Asia Pacific Market Y-o-Y Growth (%) Projections by Processor, 2022 to 2032
Figure 142: Asia Pacific Market Value (US$ Million) Analysis by Operating System, 2017 to 2032
Figure 143: Asia Pacific Market Volume (Units) Analysis by Operating System, 2017 to 2032
Figure 144: Asia Pacific Market Value Share (%) and BPS Analysis by Operating System, 2022 to 2032
Figure 145: Asia Pacific Market Y-o-Y Growth (%) Projections by Operating System, 2022 to 2032
Figure 146: Asia Pacific Market Attractiveness by Form Factor, 2022 to 2032
Figure 147: Asia Pacific Market Attractiveness by Business Type, 2022 to 2032
Figure 148: Asia Pacific Market Attractiveness by Processor, 2022 to 2032
Figure 149: Asia Pacific Market Attractiveness by Operating System, 2022 to 2032
Figure 150: Asia Pacific Market Attractiveness by Country, 2022 to 2032
Figure 151: Middle East and Africa Market Value (US$ Million) by Form Factor, 2022 to 2032
Figure 152: Middle East and Africa Market Value (US$ Million) by Business Type, 2022 to 2032
Figure 153: Middle East and Africa Market Value (US$ Million) by Processor, 2022 to 2032
Figure 154: Middle East and Africa Market Value (US$ Million) by Operating System, 2022 to 2032
Figure 155: Middle East and Africa Market Value (US$ Million) by Country, 2022 to 2032
Figure 156: Middle East and Africa Market Value (US$ Million) Analysis by Country, 2017 to 2032
Figure 157: Middle East and Africa Market Volume (Units) Analysis by Country, 2017 to 2032
Figure 158: Middle East and Africa Market Value Share (%) and BPS Analysis by Country, 2022 to 2032
Figure 159: Middle East and Africa Market Y-o-Y Growth (%) Projections by Country, 2022 to 2032
Figure 160: Middle East and Africa Market Value (US$ Million) Analysis by Form Factor, 2017 to 2032
Figure 161: Middle East and Africa Market Volume (Units) Analysis by Form Factor, 2017 to 2032
Figure 162: Middle East and Africa Market Value Share (%) and BPS Analysis by Form Factor, 2022 to 2032
Figure 163: Middle East and Africa Market Y-o-Y Growth (%) Projections by Form Factor, 2022 to 2032
Figure 164: Middle East and Africa Market Value (US$ Million) Analysis by Business Type, 2017 to 2032
Figure 165: Middle East and Africa Market Volume (Units) Analysis by Business Type, 2017 to 2032
Figure 166: Middle East and Africa Market Value Share (%) and BPS Analysis by Business Type, 2022 to 2032
Figure 167: Middle East and Africa Market Y-o-Y Growth (%) Projections by Business Type, 2022 to 2032
Figure 168: Middle East and Africa Market Value (US$ Million) Analysis by Processor, 2017 to 2032
Figure 169: Middle East and Africa Market Volume (Units) Analysis by Processor, 2017 to 2032
Figure 170: Middle East and Africa Market Value Share (%) and BPS Analysis by Processor, 2022 to 2032
Figure 171: Middle East and Africa Market Y-o-Y Growth (%) Projections by Processor, 2022 to 2032
Figure 172: Middle East and Africa Market Value (US$ Million) Analysis by Operating System, 2017 to 2032
Figure 173: Middle East and Africa Market Volume (Units) Analysis by Operating System, 2017 to 2032
Figure 174: Middle East and Africa Market Value Share (%) and BPS Analysis by Operating System, 2022 to 2032
Figure 175: Middle East and Africa Market Y-o-Y Growth (%) Projections by Operating System, 2022 to 2032
Figure 176: Middle East and Africa Market Attractiveness by Form Factor, 2022 to 2032
Figure 177: Middle East and Africa Market Attractiveness by Business Type, 2022 to 2032
Figure 178: Middle East and Africa Market Attractiveness by Processor, 2022 to 2032
Figure 179: Middle East and Africa Market Attractiveness by Operating System, 2022 to 2032
Figure 180: Middle East and Africa Market Attractiveness by Country, 2022 to 2032
The growth outlook for the white box server market is predicted to advance at a CAGR of 12.5% from 2022 to 2032.
The North American region is anticipated to lead the white box server market during the forecast period.
The white box server market is likely to hold a valuation of USD 43,993.5 million by 2032.
The corporate and development sector is the key contributors to the white box server market.
Explore Similar Insights
Thank you!
You will receive an email from our Business Development Manager. Please be sure to check your SPAM/JUNK folder too.