Reports

- Global Locations -

Headquarters

Future Market Insights, Inc.

Christiana Corporate, 200
Continental Drive, Suite 401,
Newark, Delaware - 19713,
United States

T: +1-845-579-5705

Americas

Future Market Insights, Inc.

616 Corporate Way, Suite 2-9018,
Valley Cottage, NY 10989, United States

T: +1-347-918-3531

MEA

Future Market Insights

1602-6 Jumeirah Bay X2 Tower, Plot No: JLT-PH2-X2A,
Jumeirah Lakes Towers, Dubai,
United Arab Emirates

Europe

Future Market Insights

3rd Floor, 207 Regent Street,
W1B 3HH London
United Kingdom

T: + 44 (0) 20 8123 9659
D: +44 (0) 20 3287 4268

Asia Pacific

Future Market Insights

IndiaLand Global Tech Park, Unit UG-1, Behind Grand HighStreet, Phase 1, Hinjawadi, MH, Pune – 411057, India

Zinc Oxide Market Outlook (2022 to 2032)

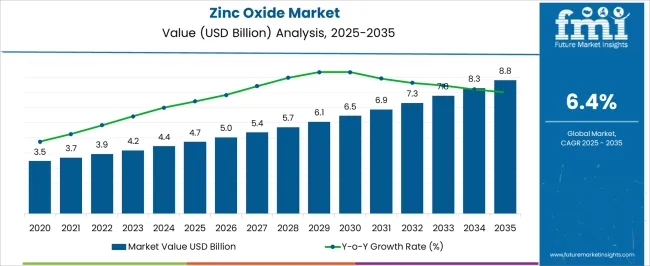
[220 Pages Report] The global zinc oxide market is projected to be worth around US$ 3.9 billion in 2022, representing a year-over-year increase of 5.4%. Sales of zinc oxide are anticipated to expand at a strong CAGR of 6.4% and reach a market cap of $7.3 billion by 2032. Throughout the assessment period, the demand for zinc oxide is anticipated to increase due to the expanding use of rubber in a variety of sectors. The major development factors of the zinc oxide market include:

  • rising use in applications such as cosmetics, paints, and ceramics
  • research and development of ZnO nanoparticles, as well as their use in a variety of applications
  • the growing requirement to correct soil micronutrient deficiency
  • increasing adoption in rubber manufacturing
Attribute Details
Zinc Oxide Sales (2021A) US$ 3.7 Billion
Estimated Demand (2022E) US$ 3.9 Billion
Projected Market Valuation (2032F) US$ 7.3 Billion
Value-based CAGR (2022-2032) 6.4 %
Collective Value Share: Top 3 Countries (2022E) 47.0 %

One of the major driving factors of the zinc oxide market is the increasing application in rubber. It could be summarised as:

  • In the first nine months of 2021, global rubber output rose by 8.9%, from 19.8 million tonne to 21.6 million tonne (MRC).
  • US Tire Manufacturers Association (USTMA) predicts 336 million tyre exports in 2021, up from 303.2 million in 2020.
  • Pyramids Tires began rolling out tyres on May 9, 2020, with an estimated USD 350 million. Second phase will add passenger car, truck, and OTR tyres by 2022.

Don't pay for what you don't need

Customize your report by selecting specific countries or regions and save 30%!

Vendor Landscape

Research shows that both large and small companies are competing for customers in the zinc oxide market. In the next five years, innovation and product extensions are expected to expand, leading to increased market rivalry.

Price, quality, innovation, and competitiveness in the marketplace are all points of contention among the many sellers. Because their product costs are lower than those of their competitors, some of the major firms can force down market prices. Some providers have greater technological, financial, and other resources than their rivals, allowing them to respond more quickly to shifts in the zinc oxide market. The top 5 vendors operating in the zinc oxide market are as follows:

EverZinc:

When it comes to the manufacturing of zinc compounds, EverZinc is among the zinc oxide industry frontrunners. It produces three distinct types of zinc powder: zinc oxide, fine zinc powder, and battery zinc powder. Tires, anti-corrosion coatings, ceramics and glass, pharmaceuticals and chemicals, etc. are only some of the many uses for the items it provides.

Hindustan Zinc:

Hindustan Zinc produces zinc, lead, and silver as part of a vertically integrated system. Production of lead and zinc from ore is the company's primary activity. Captive power generation is also emphasised. Zinc oxide is made by the corporation for use in many products, including rubber, ceramics, and paints & coatings.

Votorantim Group:

The energy, metals, cement, steel, pulp, agribusiness, and finance sectors are only some of the areas where Votorantim Group excels. Zinc oxide, in a variety of grades, is one of the products offered by the company. Zinc oxide is produced from scrap zinc and refined zinc metal. Zinc oxide can be purchased from them in several different forms, including pellets, powder, USP, and surface-treated grades.

GHC:

Tires, ceramics, agriculture, custom compound rubber and plastics, lubricating oil additives, and speciality chemicals are just some of the many markets that GHC supplies with its zinc oxide. It is a leading exporter of refined zinc oxide from France. Most of the zinc used in the company's zinc oxide production comes from electrolytic zinc purchased from reputable vendors.

American Zinc Recycling:

Products based on zinc and nickel are the mainstay of American Zinc Recycling's global export business. In order to produce and sell zinc and other metals, the company processes dust from electric arc furnaces and other sources rich in zinc. Its business is split into two divisions: Zochem and INMETCO. Zinc oxide is the primary product made and sold by the Zochem division.

Growing consumption of zinc oxide as an activator for the vulcanization process in the rubber industry and rising consumption as important raw material in the ceramic industry are expected to fuel sales in the forthcoming years. Growing demand for rubber from the automotive industry in East Asia & Europe is expected augment the growth in the market over the forecast period.

Zinc Oxide Market

2017-2021 Zinc Oxide Market Historic Outlook Compared to 2022-2032 Forecast

The global demand for zinc oxide increased at a CAGR of 3.3% between 2017 and 2021. Significant production volume of rubber had bolstered the consumption of zinc oxide in recent years as it is used as an activator for the vulcanization of rubber in the rubber industry. High consumption of rubber in the automotive industry and increasing motor vehicle demand will propel sales in the market at 6.4% CAGR over the assessment period.

Growing demand for zinc oxide as a melting point reducer in the production of ceramics and vulcanization of rubber is driving the market. Furthermore, zinc oxide nanoparticles have emerged as a promising biomedicine candidate, particularly for anticancer and antibacterial applications.

Since it is used as a catalyst in a variety of chemical processes, as a sunscreen active ingredient in cosmetics and personal care products, and as an anti-corrosion component in paints and coatings, demand is expected to accelerate.

How is Increasing Adoption in Rubber Production Bolstering Sales of Zinc Oxide?

Zinc Oxide is widely used in the rubber industry as an activator for the vulcanization of the rubber. It is used in the vulcanization process to make the material more durable by adding strength and improving its resistance against heat, and abrasion. Rubber products have a wide range of applications in various industries.

Increasing demand for rubber in the automotive industry for the production of a wide variety of products such as tires, hoses, gaskets, roll coverings, crap tubes, and adhesives is expected to boost sales of zinc oxide.

Further, rubber products have a wide range of applications in industries such as packaging, manufacturing, engineering, construction, and others. The growth in these industries is expected to propel demand for zinc oxide over the forecast period.

Nikhil Kaitwade
Nikhil Kaitwade

Principal Consultant

Talk to Analyst

Find your sweet spots for generating winning opportunities in this market.

What is Driving Demand for Zinc Oxide Nanoparticles (NPs) In Biomedicine?

Zinc oxide nanoparticles have excellent biocompatibility and low toxicity. These nanoparticles are anticipated to emerge as a potential element in anticancer & antibacterial applications as they can trigger the excess reactive oxygen species & release zinc ions.

Zinc oxide nanoparticles are being explored for cancer treatment as a biocompatible and biodegradable platform. Using these nanoparticles for drug delivery systems may provide safe & effective cancer treatment. Also, it has found its applications in diabetes treatment. Zinc is an essential part to keep the structural integrity of insulin and also participates in insulin formation, therefore ZnO NPs can be used as an agent for zinc delivery.

They can also be used as antibacterial material as they have superior properties such as high activity to block pathogens and more surface area. In addition to this, zinc oxide shows excellent luminescent properties which are expected to boost the demand for bio imaging. All these applications are expected to create opportunities for growth for zinc oxide manufacturers.

Country-wise Insights

What Will be the China Zinc Oxide Market Outlook?

“Increasing Usage of Zinc Oxide Powder in China Will Boost Sales”

The automotive sector in China has been one of the largest in the world. According to China’s National Bureau of statistics 2002-2010, the total number of civilian vehicles owned in China increased from 17.35 million to 123.27 million from 2004 to 2014 with an annual growth rate of 21.69%.

The automotive industry has a great contribution to China’s economic development. The growth in the automotive industry is one of the key factors for the expansion in the rubber industry, which is expected to push sales of zinc oxide.

Owing to the significant production volume of automotive parts in China, the country is expected to remain a prominent consumer of zinc oxide. Total consumption of zinc oxide in China is estimated to reach about US$ 1.8 Bn by 2032.

What is Driving the U.S. Zinc Oxide Market?

“Increasing Demand for Zinc Oxide for Ceramic Production in the U.S. Will Augment Growth”

The U.S. construction market is expected to grow in upcoming years due to the high investment in housing projects, transport, renewable energy, and water projects. Increasing industrial, infrastructure, energy & utility, institutional, and residential construction is expected to boost demand for construction materials.

Ceramics is one of the key applications of zinc oxide. Ceramics and its products are utilized in the building & construction industry in different forms such as ceramics tiles, ceramic shingles, and others.

Ceramics pose high mechanical properties such as compression strength, and hardness which make them suitable for use in the construction industry. Zinc oxide in ceramics reduces the melting temperature and improves the intensity of color glazes.

The zinc oxide market in the U.S. is anticipated to reach about US$ 1.2 Bn by 2032.

Get the data you need at a Fraction of the cost

Personalize your report by choosing insights you need
and save 40%!

Category-wise Insights

What is Boosting Demand for Industrial-Grade Zinc Oxide?

“Adoption of Industrial Grade Zinc Oxide in the Chemical Industry Will Remain High”

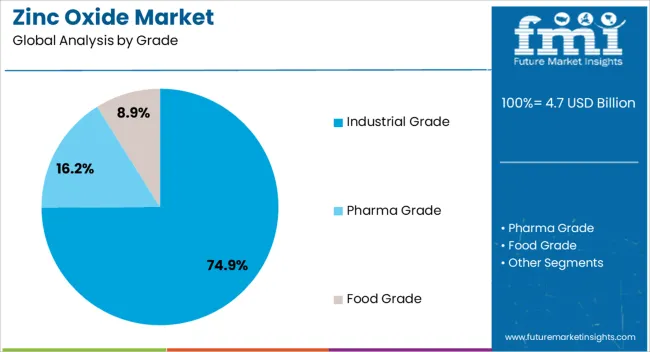
Based on grade, sales of industrial grade zinc oxide are expected to increase at a 6.1% CAGR over the assessment period. The grade is widely used owing to its physical and chemical properties which makes it suitable for consumption in different end-use industries such as the rubber industry. Rubber is highly used in the automotive sector for the production of tires and other automotive parts. In addition to this, it is used in many industries such as building and construction, industrial machinery, and others.

The industrial grade of zinc oxide is relatively less pure as compared to the other two grades. The consumption of industrial grade zinc oxide is high in ceramics, chemicals, paints & coatings, and rubber industries. As the industries are witnessing growth, the consumption of industrial grade zinc oxide is also increasing significantly.

Which Production Process of Zinc Oxide is More Preferred?

“Production of Zinc Oxide Through Indirect Process Will Gain Traction”

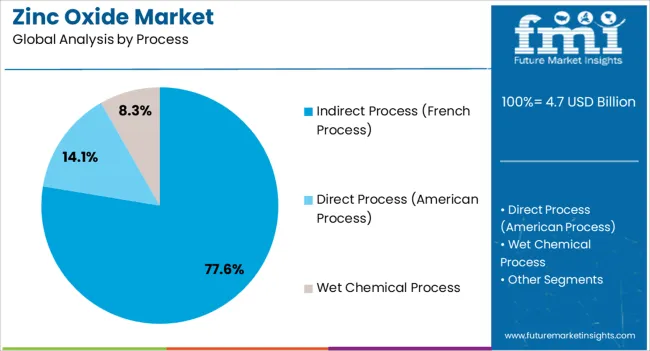
Generally, zinc oxide is manufactured by three processes which include wet chemical, indirect & direct process. Commercially, zinc oxide is manufactured by using the indirect process. The indirect process is also known as the French process. This approach is the quickest and most efficient way to produce zinc oxide in industrial settings. As indirect processes consume low energy, give increased yield and have faster production cycles, it is the preferred process for production.

However, the precursor used during the process determines the quality of zinc oxide. In the pharmaceutical sector, special high zinc metal is employed, while in the rubber industry, regular zinc metal is used. Demand in the indirect process segment is expected to grow at a CAGR of 6.6% by end of the forecast period.

Competitive Landscape

Key players are concentrating on increasing their production capacity in order to expand their global presence and gain maximum traction in the market. Furthermore, some of the leading manufacturers are pursuing mergers, acquisitions, and collaborations to expand their global footprint. For instance:

  • In June 2022, Aterian Investment Partner combined EverZinc & U.S. Zinc companies to form the pre-eminent global zinc business. The company is anticipated to source the majority of the raw material from a third party. This will help in reducing the need for virgin zinc.

Scope of Report

Attribute Details
Estimated Market Size (2022) US$ 3.9 Billion
Projected Market Valuation (2032) US$ 7.3 Billion
Value-based CAGR (2022 to 2032) 6.4%
Forecast Period 2022 to 2032
Historical Data Available for 2017 to 2021
Market Analysis US$ Million for Value and Tons for Volume
Key Countries Covered The USA, Canada, Brazil, Mexico, Germany, Italy, France, The UK, Spain, BENELUX, Russia, China, Japan, South Korea, India, ASEAN, ANZ, GCC Countries, Turkey, Northern Africa, South Africa
Key Segments Covered Grade, Process, Application, and Region
Key Companies Profiled
  • USA Zinc
  • Rubamin
  • Zinc Oxide LLC
  • Grupo Promax
  • Weifang Longda Zinc Industry Co. Ltd.
  • Yongchang Zinc Industry Co. Ltd.
  • Pan Continental Chemical
  • J.G. Chemicals
  • Akrochem
  • ZM Silesia
Report Coverage
  • Market Forecast, Company Share Analysis, Competition Intelligence, DROT Analysis, Market Dynamics and Challenges, and Strategic Growth Initiatives

Zinc Oxide Market Segmentation

By Grade:

  • Industrial
  • Pharma
  • Food

By Application:

  • Wet Chemical
  • Indirect
  • Direct

By Application:

  • Rubber
  • Ceramics
  • Chemicals
  • Cosmetics and personal care
  • Paints & Coatings
  • Pharmaceutical
  • Agricultural
  • Others

By Region:

  • North America
  • Latin America
  • Europe
  • East Asia
  • South Asia & Pacific
  • Middle East & Africa

Frequently Asked Questions

What is the current size of the global zinc oxide market?

The global market for zinc oxide is estimated to reach a valuation of US$ 7.3 Bn by 2032.

What is the demand outlook for zinc oxide for the indirect process?

The indirect process is anticipated to witness a growth rate of 6.6% over the forecast period of 2022 and 2032 in terms of value.

What are the key applications of Zinc Oxide?

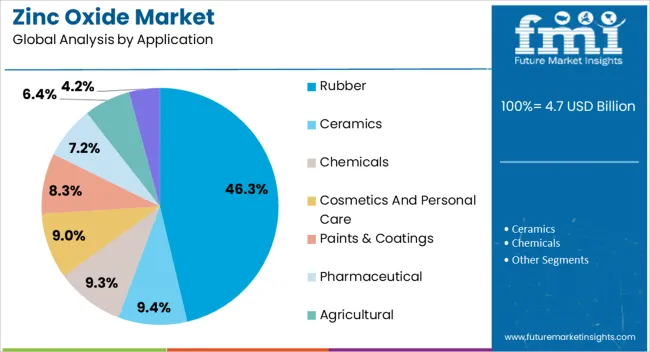
Rubber and Ceramics are the key applications of zinc oxide, with a total market share of 58.7% for the year 2022.

Who are the key players in the global market of Zinc Oxide?

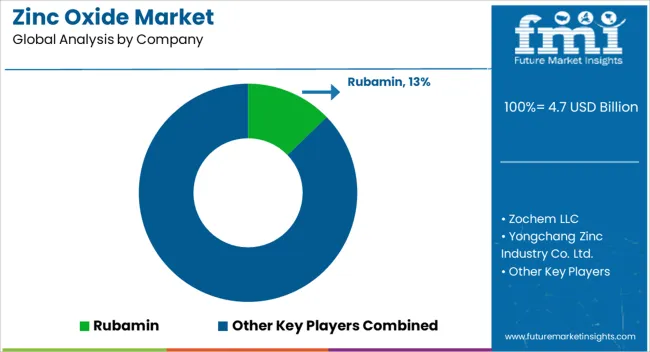
According to FMI analysis, U.S. Zinc, Rubamin, Zinc Oxide LLC, Grupo Promax, Weifang Longda Zinc Industry Co. Ltd., and others are identified as the key manufacturers in the zinc oxide market.

What is the estimated market share of the key players in the Global DMC market?

Key players in the global zinc oxide market are expected to account for about 45-50% of the overall market share.

Which are the key countries driving the Global Zinc Oxide market demand?

The top countries driving the global zinc oxide demand are China, the U.S., and Germany.

Table of Content

1. Executive Summary

    1.1. Global Market Outlook

    1.2. Demand Side Trends

    1.3. Supply Side Trends

    1.4. Analysis and Recommendations

2. Market Overview

    2.1. Market Coverage / Taxonomy

    2.2. Market Definition / Scope / Limitations

3. Key Market Trends

    3.1. Key Trends Impacting the Market

    3.2. Innovation / Development Trends

4. Key Success Factors

    4.1. Product Adoption / Usage Analysis

    4.2. Product innovation & Diversification

    4.3. Marketing and Brand management

    4.4. Supply Chain Management

5. Global Zinc Oxide Market Demand Analysis 2017-2021 and Forecast, 2022-2032

    5.1. Historical Market Volume (Tons) Analysis, 2017-2021

    5.2. Current and Future Market Volume (Tons) Projections, 2022-2032

    5.3. Y-o-Y Growth Trend Analysis

6. Global Zinc Oxide Market - Pricing Analysis

    6.1. Regional Pricing Analysis

    6.2. Pricing Analysis by Regions

7. Global Zinc Oxide Market Demand (in Value or Size in US$ Bn) Analysis 2017-2021 and Forecast, 2022-2032

    7.1. Historical Market Value (US$ Bn) Analysis, 2017-2021

    7.2. Current and Future Market Value (US$ Bn) Projections, 2022-2032

        7.2.1. Y-o-Y Growth Trend Analysis

        7.2.2. Absolute $ Opportunity Analysis

8. Market Background

    8.1. Macro-Economic Factors

    8.2. Forecast Factors - Relevance & Impact

    8.3. Supply-Demand Analysis

    8.4. Value Chain

    8.5. Market Dynamics

    8.6. Impact of COVID – 19 Crisis

9. Global Zinc Oxide Market Analysis 2017-2021 and Forecast 2022-2032, by Grade

    9.1. Introduction / Key Findings

    9.2. Historical Market Size (US$ Bn) and Volume Analysis By Grade, 2017 - 2021

    9.3. Current and Future Market Size (US$ Bn) and Volume Analysis and Forecast By Grade, 2022 - 2032

        9.3.1. Industrial

        9.3.2. Pharma

        9.3.3. Food

    9.4. Market Attractiveness Analyses, By Grade

10. Global Zinc Oxide Market Analysis 2017-2021 and Forecast 2022-2032, by Process

    10.1. Introduction / Key Findings

    10.2. Historical Market Size (US$ Bn) and Volume Analysis By Process, 2017 - 2021

    10.3. Current and Future Market Size (US$ Bn) and Volume Analysis and Forecast By Process, 2022 - 2032

        10.3.1. Wet Chemical

        10.3.2. Indirect

        10.3.3. Direct

    10.4. Market Attractiveness Analyses, By Process

11. Global Zinc Oxide Market Analysis 2017-2021 and Forecast 2022-2032, By Application 

    11.1. Introduction / Key Findings

    11.2. Historical Market Size (US$ Bn) and Volume Analysis By Application, 2017 - 2021

    11.3. Current and Future Market Size (US$ Bn) and Volume Analysis and Forecast By Application, 2022 - 2032

        11.3.1. Rubber

        11.3.2. Ceramics

        11.3.3. Chemicals

        11.3.4. Cosmetics & Personal care

        11.3.5. Paints & Coatings

        11.3.6. Pharmaceuticals

        11.3.7. Agriculture

        11.3.8. Others

    11.4. Market Attractiveness Analysis By Application

12. Global Zinc Oxide Market Analysis 2017-2021 and Forecast 2022-2032, by Region

    12.1. Introduction

    12.2. Historical Market Size (US$ Bn) and Volume Analysis By Region, 2017 - 2021

    12.3. Current Market Size (US$ Bn) and Volume Analysis and Forecast By Region, 2022 - 2032

        12.3.1. North America

        12.3.2. Latin America

        12.3.3. Europe

        12.3.4. East Asia

        12.3.5. South Asia & Pacific

        12.3.6. Middle East & Africa

    12.4. Market Attractiveness Analysis By Region

13. North America Zinc Oxide Market Analysis 2017-2021 and Forecast 2022-2032

    13.1. Introduction

    13.2. Pricing Analysis

    13.3. Historical Market Size (US$ Bn) and Volume Trend Analysis By Market Taxonomy, 2017 - 2021

    13.4. Market Size (US$ Bn) and Volume Forecast By Market Taxonomy, 2022 - 2032

        13.4.1. By Grade

        13.4.2. By Process

        13.4.3. By Application

        13.4.4. By Country

            13.4.4.1. U.S.

            13.4.4.2. Canada

    13.5. Market Attractiveness Analysis

        13.5.1. By Grade

        13.5.2. By Process

        13.5.3. By Application

        13.5.4. By Country

    13.6. Market Trends

    13.7. Drivers and Restraints Impact Analysis

14. Latin America Zinc Oxide Market Analysis 2017-2021 and Forecast 2022-2032

    14.1. Introduction

    14.2. Pricing Analysis

    14.3. Historical Market Size (US$ Bn) and Volume Trend Analysis By Market Taxonomy, 2017 - 2021

    14.4. Market Size (US$ Bn) and Volume Forecast By Market Taxonomy, 2022 - 2032

        14.4.1. By Grade

        14.4.2. By Process

        14.4.3. By Application

        14.4.4. By Country

            14.4.4.1. Brazil

            14.4.4.2. Mexico

            14.4.4.3. Rest of Latin America

    14.5. Market Attractiveness Analysis

        14.5.1. By Grade

        14.5.2. By Process

        14.5.3. By Application

        14.5.4. By Country

    14.6. Market Trends

    14.7. Drivers and Restraints Impact Analysis

15. Europe Zinc Oxide Market Analysis 2017-2021 and Forecast 2022-2032

    15.1. Introduction

    15.2. Pricing Analysis

    15.3. Historical Market Size (US$ Bn) and Volume Trend Analysis By Market Taxonomy, 2017 - 2021

    15.4. Market Size (US$ Bn) and Volume Forecast By Market Taxonomy, 2022 - 2032

        15.4.1. By Grade

        15.4.2. By Process

        15.4.3. By Application

        15.4.4. By Country

            15.4.4.1. Germany

            15.4.4.2. Italy

            15.4.4.3. France

            15.4.4.4. U.K.

            15.4.4.5. Spain

            15.4.4.6. BENELUX

            15.4.4.7. Russia

            15.4.4.8. Rest of Europe

    15.5. Market Attractiveness Analysis

        15.5.1. By Grade

        15.5.2. By Process

        15.5.3. By Application

        15.5.4. By Country

    15.6. Market Trends

    15.7. Drivers and Restraints Impact Analysis

16. East Asia Zinc Oxide Market Analysis 2017-2021 and Forecast 2022-2032

    16.1. Introduction

    16.2. Pricing Analysis

    16.3. Historical Market Size (US$ Bn) and Volume Trend Analysis By Market Taxonomy, 2017 - 2021

    16.4. Market Size (US$ Bn) and Volume Forecast By Market Taxonomy, 2022 - 2032

        16.4.1. By Grade

        16.4.2. By Process

        16.4.3. By Application

        16.4.4. By Country

            16.4.4.1. China

            16.4.4.2. Japan

            16.4.4.3. South Korea

    16.5. Market Attractiveness Analysis

        16.5.1. By Grade

        16.5.2. By Process

        16.5.3. By Application

        16.5.4. By Country

    16.6. Market Trends

    16.7. Drivers and Restraints Impact Analysis

17. South Asia & Pacific Zinc Oxide Market Analysis 2017-2021 and Forecast 2022-2032

    17.1. Introduction

    17.2. Pricing Analysis

    17.3. Historical Market Size (US$ Bn) and Volume Trend Analysis By Market Taxonomy, 2017 - 2021

    17.4. Market Size (US$ Bn) and Volume Forecast By Market Taxonomy, 2022 - 2032

        17.4.1. By Grade

        17.4.2. By Process

        17.4.3. By Application

        17.4.4. By Country

            17.4.4.1. India

            17.4.4.2. ASEAN

            17.4.4.3. ANZ

            17.4.4.4. Rest of South Asia & Pacific

    17.5. Market Attractiveness Analysis

        17.5.1. By Grade

        17.5.2. By Process

        17.5.3. By Application

        17.5.4. By Country

    17.6. Market Trends

    17.7. Drivers and Restraints Impact Analysis

18. Middle East and Africa Zinc Oxide Market Analysis 2017-2021 and Forecast 2022-2032

    18.1. Introduction

    18.2. Pricing Analysis

    18.3. Historical Market Size (US$ Bn) and Volume Trend Analysis By Market Taxonomy, 2017 - 2021

    18.4. Market Size (US$ Bn) and Volume Forecast By Market Taxonomy, 2022 - 2032

        18.4.1. By Grade

        18.4.2. By Process

        18.4.3. By Application

        18.4.4. By Country

            18.4.4.1. GCC Countries

            18.4.4.2. Turkey

            18.4.4.3. South Africa

            18.4.4.4. Rest of Middle East and Africa

    18.5. Market Attractiveness Analysis

        18.5.1. By Grade

        18.5.2. By Process

        18.5.3. By Application

        18.5.4. By Country

    18.6. Market Trends

    18.7. Drivers and Restraints Impact Analysis

19. Key and Emerging Countries Zinc Oxide Market Analysis 

    19.1. U.S. Zinc Oxide Market Analysis

        19.1.1. By Grade

        19.1.2. By Process

        19.1.3. By Application

    19.2. Canada Zinc Oxide Market Analysis

        19.2.1. By Grade

        19.2.2. By Process

        19.2.3. By Application

    19.3. Mexico Zinc Oxide Market Analysis

        19.3.1. By Grade

        19.3.2. By Process

        19.3.3. By Application

    19.4. Brazil Zinc Oxide Market Analysis

        19.4.1. By Grade

        19.4.2. By Process

        19.4.3. By Application

    19.5. Germany Zinc Oxide Market Analysis

        19.5.1. By Grade

        19.5.2. By Process

        19.5.3. By Application

    19.6. Italy Zinc Oxide Market Analysis

        19.6.1. By Grade

        19.6.2. By Process

        19.6.3. By Application

    19.7. France Zinc Oxide Market Analysis

        19.7.1. By Grade

        19.7.2. By Process

        19.7.3. By Application

    19.8. U.K. Zinc Oxide Market Analysis

        19.8.1. By Grade

        19.8.2. By Process

        19.8.3. By Application

    19.9. Spain Zinc Oxide Market Analysis

        19.9.1. By Grade

        19.9.2. By Process

        19.9.3. By Application

    19.10. Russia Zinc Oxide Market Analysis

        19.10.1. By Grade

        19.10.2. By Process

        19.10.3. By Application

    19.11. BENELUX Zinc Oxide Market Analysis

        19.11.1. By Grade

        19.11.2. By Process

        19.11.3. By Application

    19.12. China Zinc Oxide Market Analysis

        19.12.1. By Grade

        19.12.2. By Process

        19.12.3. By Application

    19.13. Japan Zinc Oxide Market Analysis

        19.13.1. By Grade

        19.13.2. By Process

        19.13.3. By Application

    19.14. S. Korea Zinc Oxide Market Analysis

        19.14.1. By Grade

        19.14.2. By Process

        19.14.3. By Application

    19.15. India Zinc Oxide Market Analysis

        19.15.1. By Grade

        19.15.2. By Process

        19.15.3. By Application

    19.16. ASEAN Zinc Oxide Market Analysis

        19.16.1. By Grade

        19.16.2. By Process

        19.16.3. By Application

    19.17. GCC Countries Zinc Oxide Market Analysis

        19.17.1. By Grade

        19.17.2. By Process

        19.17.3. By Application

    19.18. Turkey Zinc Oxide Market Analysis

        19.18.1. By Grade

        19.18.2. By Process

        19.18.3. By Application

    19.19. South Africa Zinc Oxide Market Analysis

        19.19.1. By Grade

        19.19.2. By Process

        19.19.3. By Application

    19.20. Northern Africa Zinc Oxide Market Analysis

        19.20.1. By Grade

        19.20.2. By Process

        19.20.3. By Application

20. Market Structure Analysis

    20.1. Market Analysis by Tier of Companies [Zinc Oxide]

    20.2. Market Concentration

    20.3. Market Share Analysis of Top Players

    20.4. Production Capacity Estimates of Top Players

    20.5. Market Presence Analysis

21. Competition Analysis

    21.1. Competition Dashboard

    21.2. Primary Survey Analysis

    21.3. Competition Deep Dive

        21.3.1. U.S. Zinc

            21.3.1.1. Overview

            21.3.1.2. Product Portfolio

            21.3.1.3. Key Financials

            21.3.1.4. Sales Footprint

            21.3.1.5. Strategy Overview

        21.3.2. Rubamin

            21.3.2.1. Overview

            21.3.2.2. Product Portfolio

            21.3.2.3. Key Financials

            21.3.2.4. Sales Footprint

            21.3.2.5. Strategy Overview

        21.3.3. Zinc Oxide LLC

            21.3.3.1. Overview

            21.3.3.2. Product Portfolio

            21.3.3.3. Key Financials

            21.3.3.4. Sales Footprint

            21.3.3.5. Strategy Overview

        21.3.4. Grupo Promax

            21.3.4.1. Overview

            21.3.4.2. Product Portfolio

            21.3.4.3. Key Financials

            21.3.4.4. Sales Footprint

            21.3.4.5. Strategy Overview

        21.3.5. Weifang Longda Zinc Industry Co., Ltd.

            21.3.5.1. Overview

            21.3.5.2. Product Portfolio

            21.3.5.3. Key Financials

            21.3.5.4. Sales Footprint

            21.3.5.5. Strategy Overview

        21.3.6. Yongchang zinc industry Co., Ltd.

            21.3.6.1. Overview

            21.3.6.2. Product Portfolio

            21.3.6.3. Key Financials

            21.3.6.4. Sales Footprint

            21.3.6.5. Strategy Overview

        21.3.7. Pan-Continental Chemical

            21.3.7.1. Overview

            21.3.7.2. Product Portfolio

            21.3.7.3. Key Financials

            21.3.7.4. Sales Footprint

            21.3.7.5. Strategy Overview

        21.3.8. J.G. Chemicals

            21.3.8.1. Overview

            21.3.8.2. Product Portfolio

            21.3.8.3. Key Financials

            21.3.8.4. Sales Footprint

            21.3.8.5. Strategy Overview

        21.3.9. Akrochem

            21.3.9.1. Overview

            21.3.9.2. Product Portfolio

            21.3.9.3. Key Financials

            21.3.9.4. Sales Footprint

            21.3.9.5. Strategy Overview

        21.3.10. ZM Silesia

            21.3.10.1. Overview

            21.3.10.2. Product Portfolio

            21.3.10.3. Key Financials

            21.3.10.4. Sales Footprint

            21.3.10.5. Strategy Overview

        21.3.11. Kannan Group

            21.3.11.1. Overview

            21.3.11.2. Product Portfolio

            21.3.11.3. Key Financials

            21.3.11.4. Sales Footprint

            21.3.11.5. Strategy Overview

22. Assumptions and Acronyms Used

23. Research Methodology

Don't pay for what you don't need

Customize your report by selecting specific countries or regions and save 30%!

List of Tables

Table 01: Global Zinc Oxide Volume (KT) and Value (US$ Bn) Forecast by Grade, 2017–2032

Table 02: Global Zinc Oxide Volume (KT) and Value (US$ Bn) Forecast by Process, 2017–2032

Table 03: Global Zinc Oxide Volume (KT) and Value (US$ Bn) Forecast by Application, 2017–2032

Table 04: Global Zinc Oxide Market Size (US$ Bn) and Volume (KT) Forecast by Region, 2017–2032

Table 05: North America Zinc Oxide Market Size (US$ Bn) and Volume (KT) Forecast by Country, 2017–2032

Table 06: North America Zinc Oxide Volume (KT) and Value (US$ Bn) Forecast by Grade, 2017–2032

Table 07: North America Zinc Oxide Volume (KT) and Value (US$ Bn) Forecast by Process, 2017–2032

Table 08: North America Zinc Oxide Volume (KT) and Value (US$ Bn) Forecast by Application, 2017–2032

Table 09: Latin America Zinc Oxide Market Size (US$ Bn) and Volume (KT) Forecast by Country, 2017–2032

Table 10: Latin America Zinc Oxide Volume (KT) and Value (US$ Bn) Forecast by Grade, 2017–2032

Table 11: Latin America Zinc Oxide Volume (KT) and Value (US$ Bn) Forecast by Process, 2017–2032

Table 12: Latin America Zinc Oxide Volume (KT) and Value (US$ Bn) Forecast by Application, 2017–2032

Table 13: Europe Zinc Oxide Market Size (US$ Bn) and Volume (KT) Forecast by Country, 2017–2032

Table 14: Europe Zinc Oxide Volume (KT) and Value (US$ Bn) Forecast by Grade, 2017–2032

Table 15: Europe Zinc Oxide Volume (KT) and Value (US$ Bn) Forecast by Process, 2017–2032

Table 16: Europe Zinc Oxide Volume (KT) and Value (US$ Bn) Forecast by Application, 2017–2032

Table 17: East Asia Zinc Oxide Market Size (US$ Bn) and Volume (KT) Forecast by Country, 2017–2032

Table 18: East Asia Zinc Oxide Volume (KT) and Value (US$ Bn) Forecast by Grade, 2017–2032

Table 19: East Asia Zinc Oxide Volume (KT) and Value (US$ Bn) Forecast by Process, 2017–2032

Table 20: East Asia Zinc Oxide Volume (KT) and Value (US$ Bn) Forecast by Application, 2017–2032

Table 21: SAP Zinc Oxide Market Size (US$ Bn) and Volume (KT) Forecast by Country, 2017–2032

Table 22: SAP Zinc Oxide Volume (KT) and Value (US$ Bn) Forecast by Grade, 2017–2032

Table 23: SAP Zinc Oxide Volume (KT) and Value (US$ Bn) Forecast by Process, 2017–2032

Table 24: SAP Zinc Oxide Volume (KT) and Value (US$ Bn) Forecast by Application, 2017–2032

Table 25: MEA Zinc Oxide Market Size (US$ Bn) and Volume (KT) Forecast by Country, 2017–2032

Table 26: MEA Zinc Oxide Volume (KT) and Value (US$ Bn) Forecast by Grade, 2017–2032

Table 27: MEA Zinc Oxide Volume (KT) and Value (US$ Bn) Forecast by Process, 2017–2032

Table 28: MEA Zinc Oxide Volume (KT) and Value (US$ Bn) Forecast by Application, 2017–2032
Nikhil Kaitwade
Nikhil Kaitwade

Principal Consultant

Talk to Analyst

Find your sweet spots for generating winning opportunities in this market.

List of Charts

Figure 01: Global Historical Market Volume (KT) Analysis, 2017-2021

Figure 02: Global Current and Future Market Volume (KT) Analysis, 2022-2032

Figure 03: Global Zinc Oxide Historical Value (US$ Bn), 2017 – 2021

Figure 04:Global Zinc Oxide Value (US$ Bn) Forecast, 2022 – 2032

Figure 05:Global Zinc Oxide Market Value 2022-2032 and Y-O-Y (US$ Bn)

Figure 06: Global Zinc Oxide Market Share and BPS Analysis by Grade, 2022 & 2032

Figure 07: Global Zinc Oxide Market Y-o-Y Growth by Grade, 2022-2032

Figure 08: Global Zinc Oxide Market Attractiveness Analysis Grade, 2022-2032

Figure 09: Global Zinc Oxide Market Absolute $ Opportunity by Industrial Grade Segment, 2017-2032

Figure 10: Global Zinc Oxide Market Absolute $ Opportunity by Pharma Grade Segment, 2017-2032

Figure 11: Global Zinc Oxide Market Absolute $ Opportunity by Food Grade Segment, 2017-2032

Figure 12: Global Zinc Oxide Market Share and BPS Analysis by Process, 2022 & 2032

Figure 13: Global Zinc Oxide Market Y-o-Y Growth by Process, 2022-2032

Figure 14: Global Zinc Oxide Market Attractiveness Analysis Process, 2022-2032

Figure 15: Global Zinc Oxide Market Absolute $ Opportunity by Wet Chemical Segment, 2017-2032

Figure 16: Global Zinc Oxide Market Absolute $ Opportunity by Indirect Grade Segment, 2017-2032

Figure 17: Global Zinc Oxide Market Absolute $ Opportunity by Direct Grade Segment, 2017-2032

Figure 18: Global Zinc Oxide Market Share and BPS Analysis by Application, 2022 & 2032

Figure 19: Global Zinc Oxide Market Y-o-Y Growth by Application, 2022-2032

Figure 20: Global Zinc Oxide Market Attractiveness Analysis Application, 2022-2032

Figure 21: Global Zinc Oxide Market Absolute $ Opportunity by Rubber Segment, 2017-2032

Figure 22: Global Zinc Oxide Market Absolute $ Opportunity by Ceramics Segment, 2017-2032

Figure 23: Global Zinc Oxide Market Absolute $ Opportunity by Chemicals Segment, 2017-2032

Figure 24: Global Zinc Oxide Market Absolute $ Opportunity by Cosmetics & Personal Care Segment, 2017-2032

Figure 25: Global Zinc Oxide Market Absolute $ Opportunity by Paints & Coatings Segment, 2017-2032

Figure 26: Global Zinc Oxide Market Absolute $ Opportunity by Pharmaceuticals Segment, 2017-2032

Figure 27: Global Zinc Oxide Market Absolute $ Opportunity by Agriculture Segment, 2017-2032

Figure 28: Global Zinc Oxide Market Absolute $ Opportunity by Others Segment, 2017-2032

Figure 29: Global Zinc Oxide Market Share and BPS Analysis by Region, 2022 & 2032

Figure 30: Global Zinc Oxide Market Y-o-Y Growth by Region, 2022-2032

Figure 31: Global Zinc Oxide Market Attractiveness Analysis Region, 2022-2032

Figure 32: Global Zinc Oxide Market Absolute $ Opportunity by North America Segment, 2017-2032

Figure 33: Global Zinc Oxide Market Absolute $ Opportunity by Latin America Segment, 2017-2032

Figure 34: Global Zinc Oxide Market Absolute $ Opportunity by Europe Segment, 2017-2032

Figure 35: Global Zinc Oxide Market Absolute $ Opportunity by East Asia Segment, 2017-2032

Figure 36: Global Zinc Oxide Market Absolute $ Opportunity by South Asia Pacific Segment, 2017-2032

Figure 37: Global Zinc Oxide Market Absolute $ Opportunity by MEA Segment, 2017-2032

Figure 38: North America Zinc Oxide Market Share and BPS Analysis by Country, 2022 & 2032

Figure 39: North America Zinc Oxide Market Y-o-Y Growth by Country, 2022-2032

Figure 40: North America Zinc Oxide Market Attractiveness Analysis Country, 2022-2032

Figure 41: North America Zinc Oxide Market Share and BPS Analysis by Grade, 2022 & 2032

Figure 42: North America Zinc Oxide Market Y-o-Y Growth by Grade, 2022-2032

Figure 43: North America Zinc Oxide Market Attractiveness Analysis Grade, 2022-2032

Figure 44: North America Zinc Oxide Market Share and BPS Analysis by Process, 2022 & 2032

Figure 45: North America Zinc Oxide Market Y-o-Y Growth by Process, 2022-2032

Figure 46: North America Zinc Oxide Market Attractiveness Analysis Process, 2022-2032

Figure 47: North America Zinc Oxide Market Share and BPS Analysis by Application, 2022 & 2032

Figure 48: North America Zinc Oxide Market Y-o-Y Growth by Application, 2022-2032

Figure 49: North America Zinc Oxide Market Attractiveness Analysis Application, 2022-2032

Figure 50: Latin America Zinc Oxide Market Share and BPS Analysis by Country, 2022 & 2032

Figure 51: Latin America Zinc Oxide Market Y-o-Y Growth by Country, 2022-2032

Figure 52: Latin America Zinc Oxide Market Attractiveness Analysis Country, 2022-2032

Figure 53: Latin America Zinc Oxide Market Share and BPS Analysis by Grade, 2022 & 2032

Figure 54: Latin America Zinc Oxide Market Y-o-Y Growth by Grade, 2022-2032

Figure 55: Latin America Zinc Oxide Market Attractiveness Analysis Grade, 2022-2032

Figure 56: Latin America Zinc Oxide Market Share and BPS Analysis by Process, 2022 & 2032

Figure 57: Latin America Zinc Oxide Market Y-o-Y Growth by Process, 2022-2032

Figure 58: Latin America Zinc Oxide Market Attractiveness Analysis Process, 2022-2032

Figure 59: Latin America Zinc Oxide Market Share and BPS Analysis by Application, 2022 & 2032

Figure 60: Latin America Zinc Oxide Market Y-o-Y Growth by Application, 2022-2032

Figure 61: Latin America Zinc Oxide Market Attractiveness Analysis Application, 2022-2032

Figure 62: Europe Zinc Oxide Market Share and BPS Analysis by Country, 2022 & 2032

Figure 63: Europe Zinc Oxide Market Y-o-Y Growth by Country, 2022-2032

Figure 64: Europe Zinc Oxide Market Attractiveness Analysis Country, 2022-2032

Figure 65: Europe Zinc Oxide Market Share and BPS Analysis by Grade, 2022 & 2032

Figure 66: Europe Zinc Oxide Market Y-o-Y Growth by Grade, 2022-2032

Figure 67: Europe Zinc Oxide Market Attractiveness Analysis Grade, 2022-2032

Figure 68: Europe Zinc Oxide Market Share and BPS Analysis by Process, 2022 & 2032

Figure 69: Europe Zinc Oxide Market Y-o-Y Growth by Process, 2022-2032

Figure 70: Europe Zinc Oxide Market Attractiveness Analysis Process, 2022-2032

Figure 71: Europe Zinc Oxide Market Share and BPS Analysis by Application, 2022 & 2032

Figure 72: Europe Zinc Oxide Market Y-o-Y Growth by Application, 2022-2032

Figure 73: Europe Zinc Oxide Market Attractiveness Analysis Application, 2022-2032

Figure 74: East Asia Zinc Oxide Market Share and BPS Analysis by Country, 2022 & 2032

Figure 75: East Asia Zinc Oxide Market Y-o-Y Growth by Country, 2022-2032

Figure 76: East Asia Zinc Oxide Market Attractiveness Analysis Country, 2022-2032

Figure 77: East Asia Zinc Oxide Market Share and BPS Analysis by Grade, 2022 & 2032

Figure 78: East Asia Zinc Oxide Market Y-o-Y Growth by Grade, 2022-2032

Figure 79: East Asia Zinc Oxide Market Attractiveness Analysis Grade, 2022-2032

Figure 80: East Asia Zinc Oxide Market Share and BPS Analysis by Process, 2022 & 2032

Figure 81: East Asia Zinc Oxide Market Y-o-Y Growth by Process, 2022-2032

Figure 82: East Asia Zinc Oxide Market Attractiveness Analysis Process, 2022-2032

Figure 83: East Asia Zinc Oxide Market Share and BPS Analysis by Application, 2022 & 2032

Figure 84: East Asia Zinc Oxide Market Y-o-Y Growth by Application, 2022-2032

Figure 85: East Asia Zinc Oxide Market Attractiveness Analysis Application, 2022-2032

Figure 86: SAP Zinc Oxide Market Share and BPS Analysis by Country, 2022 & 2032

Figure 87: SAP Zinc Oxide Market Y-o-Y Growth by Country, 2022-2032

Figure 88: SAP Zinc Oxide Market Attractiveness Analysis Country, 2022-2032

Figure 89: SAP Zinc Oxide Market Share and BPS Analysis by Grade, 2022 & 2032

Figure 90: SAP Zinc Oxide Market Y-o-Y Growth by Grade, 2022-2032

Figure 91: SAP Zinc Oxide Market Attractiveness Analysis Grade, 2022-2032

Figure 92: SAP Zinc Oxide Market Share and BPS Analysis by Process, 2022 & 2032

Figure 93: SAP Zinc Oxide Market Y-o-Y Growth by Process, 2022-2032

Figure 94: SAP Zinc Oxide Market Attractiveness Analysis Process, 2022-2032

Figure 95: SAP Zinc Oxide Market Share and BPS Analysis by Application, 2022 & 2032

Figure 96: SAP Zinc Oxide Market Y-o-Y Growth by Application, 2022-2032

Figure 97: SAP Zinc Oxide Market Attractiveness Analysis Application, 2022-2032

Figure 98: MEA Zinc Oxide Market Share and BPS Analysis by Country, 2022 & 2032

Figure 99: MEA Zinc Oxide Market Y-o-Y Growth by Country, 2022-2032

Figure 100: MEA Zinc Oxide Market Attractiveness Analysis Country, 2022-2032

Figure 101: MEA Zinc Oxide Market Share and BPS Analysis by Grade, 2022 & 2032

Figure 102: MEA Zinc Oxide Market Y-o-Y Growth by Grade, 2022-2032

Figure 103: MEA Zinc Oxide Market Attractiveness Analysis Grade, 2022-2032

Figure 104: MEA Zinc Oxide Market Share and BPS Analysis by Process, 2022 & 2032

Figure 105: MEA Zinc Oxide Market Y-o-Y Growth by Process, 2022-2032

Figure 106: MEA Zinc Oxide Market Attractiveness Analysis Process, 2022-2032

Figure 107: MEA Zinc Oxide Market Share and BPS Analysis by Application, 2022 & 2032

Figure 108: MEA Zinc Oxide Market Y-o-Y Growth by Application, 2022-2032

Figure 109: MEA Zinc Oxide Market Attractiveness Analysis Application, 2022-2032

Recommendations

Chemicals & Materials

Magnesium Oxide Market

Published : January 2024

Chemicals & Materials

Iron Oxide Market

Published : July 2023

Chemicals & Materials

Lauryl Dimethyl Amine Oxide Market

Published : February 2023

Chemicals & Materials

Bismuth Oxide Market

Published : June 2022

Explore Chemicals & Materials Insights

View Reports