

- Market Size (2026)
- USD 980.7 Mn
- Forecast (2036)
- USD 2197.0 Mn
- CAGR (2026 to 2036)
- 8.4%
How big is the Wired Drill Pipe System Market?
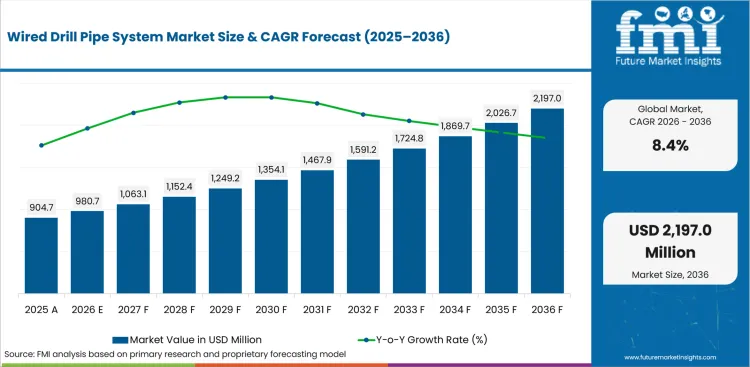
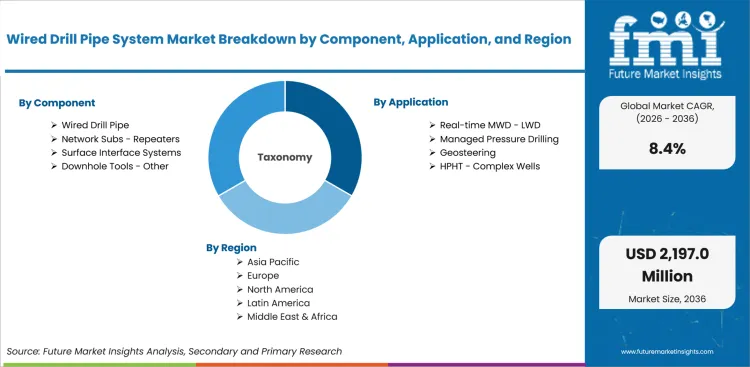
The Wired Drill Pipe System Market is projected to grow from USD 980.7 million in 2026 to USD 2197.0 million by 2036, at a CAGR of 8.4%.
The Wired Drill Pipe System Market was valued at USD 904.70 million in 2025 and is expected to reach USD 980.7 million in 2026. The market is projected to reach USD 2197.0 million by 2036 at a CAGR of 8.4%. Wired Drill Pipe is expected to account for a 52.4% share within the component segment in 2026. Real-time MWD / LWD is projected to account for a 43.5% share within the application segment in 2026.
NOV describes IntelliServ wired drill pipe as a system for near-instant downhole-to-surface data transfer, while Halliburton launched StreamStar in January 2026 for high-speed data and continuous downhole power.
Growth is tied to one practical field problem: operators need downhole data fast enough to change the drilling decision before the well path or pressure window moves out of target.
| Metric | Value |
|---|---|
| 2025 Market Size | USD 904.70 million |
| 2026 Market Size | USD 980.7 million |
| 2036 Market Size | USD 2,197.0 million |
| Forecast CAGR (2026-2036) | 8.4% |
| Leading Component | Wired Drill Pipe |
| Wired Drill Pipe Share (2026) | 52.4% |
| Leading Application | Real-time MWD / LWD |
| Real-time MWD / LWD Share (2026) | 43.5% |
| Fastest-growing Country | China |
| China CAGR by 2036 | 9.1% |
Summary of the Wired Drill Pipe System Market
| Market Signal | Commercial Impact |
|---|---|
| Demand and Growth Drivers | Demand for wired drill pipe systems is increasing as drilling operators require real-time downhole data, faster decision-making, and improved drilling efficiency in complex well environments.
|
| Product and Segment View | Wired drill pipe, real-time MWD/LWD applications, and horizontal wells continue to represent the leading commercial opportunities across the market.
|
| Geography and Growth Outlook | North America and Asia continue to drive market expansion through unconventional drilling, offshore developments, and advanced drilling automation.
|
| Competitive Landscape | Competition increasingly focuses on telemetry performance, drilling automation, downhole tool compatibility, and integrated drilling data solutions.
|
| Analyst Perspective | Wired drill pipe systems are evolving from specialized telemetry solutions into critical drilling control platforms that improve well placement, operational safety, and drilling efficiency.
- Nikhil Kaitwade, Principal Consultant at Future Market Insights |
Why is the Wired Drill Pipe System Market growing?
Operators use wired drill pipe to shorten the time between downhole measurement and surface action. Complex wells need faster pressure and vibration feedback as narrow drilling windows leave less room for delay.
- Operators use wired drill pipe to shorten the time between downhole measurement and surface action.
- Complex wells need faster pressure and vibration feedback as narrow drilling windows leave less room for delay.
- Geosteering teams value high-definition formation data when well placement depends on small boundary changes.
Complex well programs are changing how operators judge telemetry value. The United States Energy Information Administration reported that the Permian region produced 6.187 million barrels per day in June 2024 across its tracked tight-oil regions. That scale means many well programs run under factory-style drilling plans where small time savings compound across multiple wells. Wired drill pipe supports this model by making survey, pressure, and vibration data available fast enough for live adjustment. The practical result is stronger demand for systems that fit high-activity basins and high-cost rigs. Drilling automation is the second growth channel because wired pipe changes the control loop.
How is the Wired Drill Pipe System Market segmented?
The Wired Drill Pipe System Market is segmented by component, application, well type, end use, sales model, and region.
- With an estimated 52.4% share in 2026, Wired Drill Pipe is expected to lead the component category because the pipe string holds the telemetry pathway.
- Real-time MWD / LWD is projected to account for 43.5% of the application category in 2026 as formation and survey data drive early use.
- Horizontal Wells are anticipated to hold 38.8% of the well type category in 2026 with long laterals raising downhole data value.
How does Wired Drill Pipe contribute to the component category?
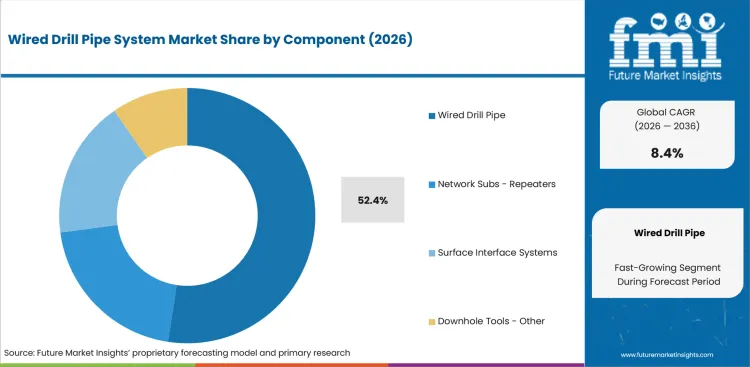
- Wired Drill Pipe is projected to account for a 52.4% share in 2026 as the telemetry conductor sits inside the drill string and enables continuous high-speed downhole communication.
- Buyers compare pipe availability and connection reliability before software features, since a single failed connection can break data continuity across the bottomhole assembly.
What supports demand for Real-time MWD / LWD?
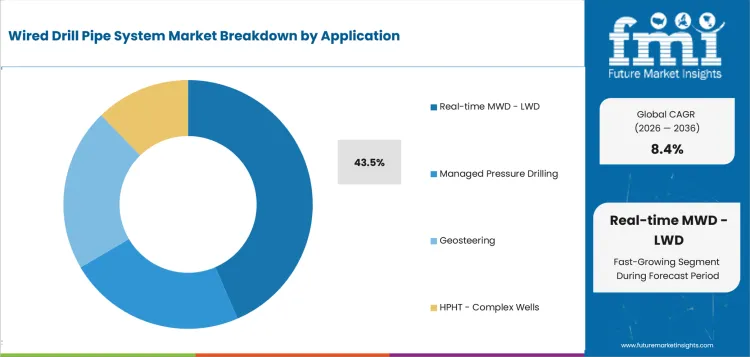
- Real-time MWD / LWD is estimated to hold a 43.5% share in 2026 as formation evaluation and survey updates create the clearest daily value for operators.
- This segment benefits from oil and gas sensors because higher sensor density increases the amount of data that wired pipe can move.
How do buyers evaluate Horizontal Wells within the well type category?
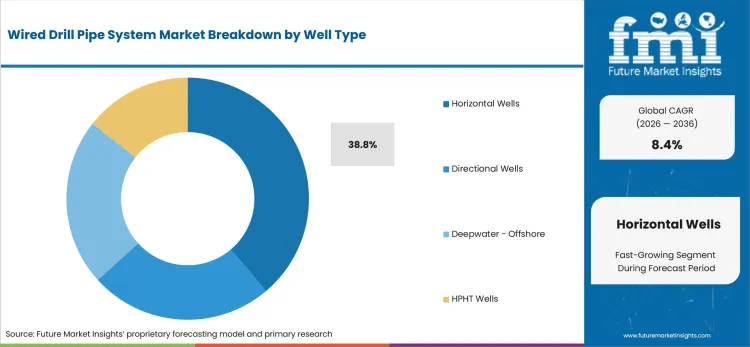
- Horizontal Wells are anticipated to represent a 38.8% share in 2026 as long laterals amplify the cost of delayed steering and poor trajectory control.
- North American shale buyers often value wired pipe where pad drilling repeats similar well paths and faster decisions reduce non-productive time across multiple wells.
What market factors influence demand for Oil Wells?
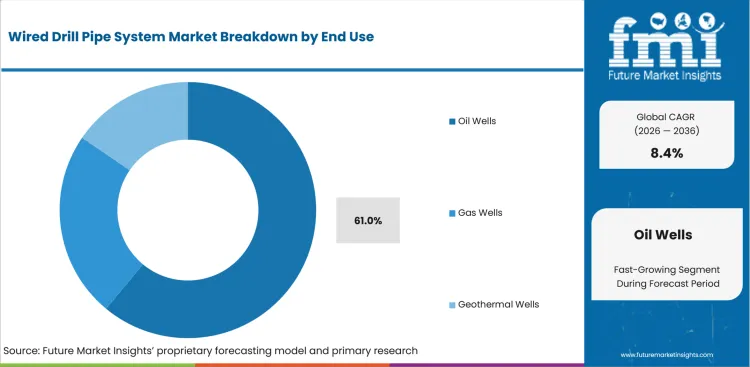
- Oil Wells are expected to account for a 61.0% share in 2026 as higher revenue per well supports the rental cost of premium telemetry systems.
- Gas and geothermal wells need similar data quality, but oil programs usually clear investment hurdles faster when rig-day cost and reservoir value are high.
How does Rental / Service affect the sales model outlook?
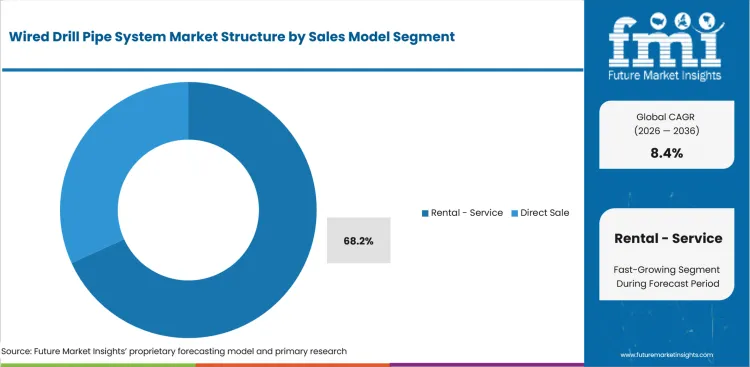
- Rental / Service is projected to hold a 68.2% share in 2026 as operators prefer field support and pipe availability over capital ownership.
- Service contracts often bundle inspection, make-up support, and interface troubleshooting, which reduces downtime risk for operators using drilling liquid level monitoring equipment.
What drives and restrains the market?
Driver: Real-time pressure control drives demand as MPD teams need faster downhole readings in narrow drilling windows; restraint: High pipe fleet cost restrains adoption among small operators and low-complexity wells; opportunity: geothermal drilling offers opportunity as hard-rock wells need better downhole data and tool control.
The market reflects a balance between the identified demand driver, adoption constraints, and the supplier opportunity outlined below.
- Driver: Real-time pressure control drives demand as MPD teams need faster downhole readings in narrow drilling windows.
- Restraint: High pipe fleet cost restrains adoption among small operators and low-complexity wells.
- Opportunity: geothermal drilling offers opportunity as hard-rock wells need better downhole data and tool control.
Pressure Window Control: Narrow pressure windows create one of the clearest demand cases for wired drill pipe. Managed pressure drilling depends on knowing downhole conditions before surface symptoms become unsafe or expensive. Halliburton states that StreamStar delivers high-speed data and continuous downhole power through wired drill pipe. This gives MPD teams a stronger data feed for pressure control and closed-loop drilling.
The mechanism is simple: faster data lets the rig team adjust surface backpressure and drilling parameters sooner. Suppliers that link wired pipe to MPD workflows can win premium jobs. Geosteering Boundary Accuracy: Geosteering demand rises when operators need to keep the wellbore inside a thin productive zone. SLB reported an offshore Norway case where wired drillpipe and fluid mapping while drilling saved nearly two hours of rig time per well. That result shows how faster downhole transmission can change well placement and sampling decisions. Wired drill pipe reduces the delay between measurement and steering response.
Which factors support expansion?
Commercial expansion is reinforced by the value, workflow, and recurring-demand factors below.
- Market value is rising as real-time steering and logging move from optional performance tools into core well-construction workflows.
- High system cost keeps rental models ahead, which is why Rental / Service is projected to hold a 68.2% share in 2026.
- Offshore and HPHT wells create higher value per job since a single missed pressure event can outweigh telemetry rental cost.
Which country markets are included in the CAGR comparison?
The selected CAGR comparison covers China (9.1%), India (8.9%), United States (8.7%), United Kingdom (7.6%), and Japan (7.1%) through 2036.
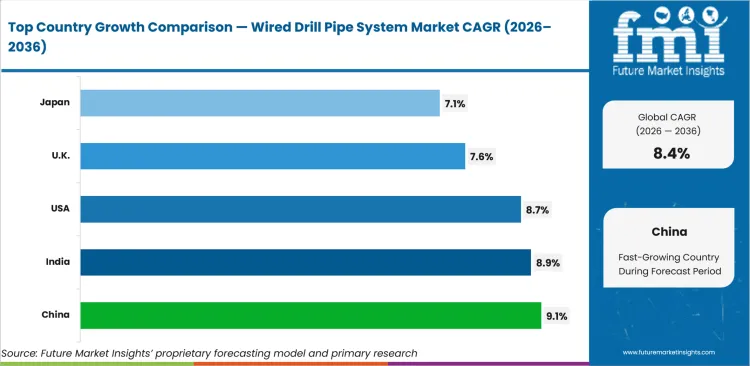
| Country | CAGR |
|---|---|
| China | 9.1% |
| India | 8.9% |
| United States | 8.7% |
| United Kingdom | 7.6% |
| Japan | 7.1% |
Source: Future Market Insights analysis.
How do country-level CAGRs compare?
- China (CAGR: 9.1%): Ultra-deep gas, shale gas, and offshore drilling support the country outlook.
- India (CAGR: 8.9%): India has active exploration and development drilling across nomination and contractual regimes.
- United States (CAGR: 8.7%): Permian and Gulf of Mexico wells create the notable commercial base for high-speed downhole telemetry.
- United Kingdom (CAGR: 7.6%): UK Continental Shelf activity is mature, offshore, and focused on life-extension economics.
- Japan (CAGR: 7.1%): Japan’s geothermal resource base creates a selective non-oil demand route.
The global Wired Drill Pipe System Market is forecast to record a CAGR of 8.4% from 2026 to 2036. The study covers 30+ countries across the report regions.
How is the Wired Drill Pipe System Market developing in China?
China is projected to record a CAGR of 9.1% through 2036. The country outlook identifies this demand signal: Ultra-deep gas, shale gas, and offshore drilling support the country outlook.
Country Market Snapshot
| Country | China |
|---|---|
| Forecast CAGR | 9.1% |
| Demand anchor | Ultra-deep gas, shale gas, and offshore drilling support the country outlook. |
| Local proof point | China’s statistics agency reported 216.05 million tons of crude oil output in 2025. |
| Application mix | Ultra-deep Sichuan shale and offshore wells need real-time downhole control. |
| Procurement route | National oil companies shape buying through large technical tenders. |
| Supply base | PetroChina, Sinopec, and CNOOC influence technology qualification. |
| Restraint | Domestic localization requirements can slow foreign supplier access. |
| Company context | Companies active in or serving this market include PetroChina, Sinopec Oilfield Service, China Oilfield Services, NOV, and SLB. |
Market Outlook
China is forecast to grow at a CAGR of 9.1% through 2036 as state energy firms push into deeper and more complex domestic resources. Buyers will value wired pipe where conventional telemetry is too slow or unreliable for ultra-deep wells. China’s National Bureau of Statistics reported 216.05 million tons of crude oil production in 2025. That production scale gives national oil companies both the need and the budget to test high-end drilling systems.
Key Growth Drivers
- Ultra-deep shale gas in Sichuan raises the need for faster downhole data.
- Offshore projects in Bohai and South China Sea support premium drilling systems.
- National oil company tenders can scale qualified technologies quickly.
- Ultra-deep gas, shale gas, and offshore drilling support the country outlook.
Key Restraints
- Localization rules can limit foreign supplier share in state-backed projects.
- Price control in domestic gas can restrict spending on premium drilling tools.
- Domestic localization requirements can slow foreign supplier access.
Country Market FAQs
What should C-suite teams prioritize in China?
C-suite teams should prioritize qualification requirements, procurement routes, local service coverage, and implementation economics before committing capital or supplier volume.
How should suppliers approach the China market?
Suppliers should align technical evidence, local channel support, and account-specific commercial terms with the buying process used by major customers in China.
What can weaken the business case in China?
Domestic localization requirements can slow foreign supplier access. Executives should test this exposure during supplier, investment, and rollout reviews.
How is the Wired Drill Pipe System Market developing in India?
India is projected to record a CAGR of 8.9% through 2036. The country outlook identifies this demand signal: India has active exploration and development drilling across nomination and contractual regimes.
Country Market Snapshot
| Country | India |
|---|---|
| Forecast CAGR | 8.9% |
| Demand anchor | India has active exploration and development drilling across nomination and contractual regimes. |
| Local proof point | India’s petroleum ministry reported 741 wells drilled in FY 2023-24. |
| Procurement route | ONGC, Oil India, and private E&P firms shape tender demand. |
| Application mix | Gas wells, HPHT zones, and offshore drilling create premium use cases. |
| Policy context | Open acreage rounds expand exploration acreage and service opportunities. |
| Restraint | Price sensitivity can push buyers toward conventional telemetry in lower-risk wells. |
| Company context | Companies active in or serving this market include ONGC, Oil India, SLB, Halliburton, and Baker Hughes. |
Market Outlook
India is projected to record a CAGR of 8.9% through 2036 as exploration programs and complex gas wells support high-speed downhole data. Buyers will use wired pipe selectively where the value of faster decisions outweighs rental cost. India’s petroleum ministry reported 741 wells drilled in FY 2023-24, including 132 exploratory wells and 609 development wells. That activity gives service providers a measurable route into complex wells, especially in offshore and HPHT settings.
Key Growth Drivers
- ONGC and Oil India exploration programs create demand for better downhole data.
- Offshore and HPHT wells support premium telemetry use cases.
- Open acreage rounds widen the future pool of complex wells.
- India has active exploration and development drilling across nomination and contractual regimes.
Key Restraints
- Tender price pressure can limit premium tool selection.
- Service logistics across remote basins can raise mobilization cost.
- Price sensitivity can push buyers toward conventional telemetry in lower-risk wells.
Country Market FAQs
What should C-suite teams prioritize in India?
C-suite teams should prioritize qualification requirements, procurement routes, local service coverage, and implementation economics before committing capital or supplier volume.
How should suppliers approach the India market?
Suppliers should align technical evidence, local channel support, and account-specific commercial terms with the buying process used by major customers in India.
What can weaken the business case in India?
Price sensitivity can push buyers toward conventional telemetry in lower-risk wells. Executives should test this exposure during supplier, investment, and rollout reviews.
How is the Wired Drill Pipe System Market developing in the United States?
The United States is projected to record a CAGR of 8.7% through 2036. The country outlook identifies this demand signal: Permian and Gulf of Mexico wells create the notable commercial base for high-speed downhole telemetry.
Country Market Snapshot
| Country | United States |
|---|---|
| Forecast CAGR | 8.7% |
| Demand anchor | Permian and Gulf of Mexico wells create the notable commercial base for high-speed downhole telemetry. |
| Procurement route | Operators buy through integrated service tenders and tubular rental agreements. |
| Application mix | Horizontal shale wells support repeat use while deepwater wells support high-value use. |
| Local proof point | The EIA tracked 6.187 million barrels per day of Permian oil output in June 2024. |
| Channel signal | NOV, SLB, Halliburton, Baker Hughes, Nabors, and Weatherford all have major U.S. service operations. |
| Restraint | Capital discipline limits use in lower-risk wells where mud-pulse telemetry is adequate. |
| Company context | Companies active in or serving this market include NOV, SLB, Baker Hughes, Halliburton, and Weatherford. |
Market Outlook
The United States is projected to record a CAGR of 8.7% through 2036 as shale efficiency and offshore complexity support premium telemetry. Buyers are more willing to use wired pipe where long laterals, repeat pad drilling, and high rig-day costs create measurable savings. U.S. demand behaves differently from smaller markets because service capacity is already present. The EIA’s drilling data show that U.S. tight-oil activity is concentrated in basins where productivity per rig is tracked monthly.
Key Growth Drivers
- Permian pad drilling creates repeatable wells where telemetry time savings can be measured across campaigns.
- Gulf of Mexico drilling supports premium systems for HPHT and deepwater risk control.
- Automation platforms from Nabors, SLB, and NOV create a ready surface layer for wired data.
- Permian and Gulf of Mexico wells create the notable commercial base for high-speed downhole telemetry.
Key Restraints
- Lower commodity prices can push operators back toward lower-cost mud-pulse telemetry.
- Smaller independents may lack the planning scale needed to justify wired pipe rental.
- Capital discipline limits use in lower-risk wells where mud-pulse telemetry is adequate.
Country Market FAQs
What should C-suite teams prioritize in the United States?
C-suite teams should prioritize qualification requirements, procurement routes, local service coverage, and implementation economics before committing capital or supplier volume.
How should suppliers approach the United States market?
Suppliers should align technical evidence, local channel support, and account-specific commercial terms with the buying process used by major customers in the United States.
What can weaken the business case in the United States?
Capital discipline limits use in lower-risk wells where mud-pulse telemetry is adequate. Executives should test this exposure during supplier, investment, and rollout reviews.
How is the Wired Drill Pipe System Market developing in the United Kingdom?
The United Kingdom is projected to record a CAGR of 7.6% through 2036. The country outlook identifies this demand signal: UK Continental Shelf activity is mature, offshore, and focused on life-extension economics.
Country Market Snapshot
| Country | United Kingdom |
|---|---|
| Forecast CAGR | 7.6% |
| Demand anchor | UK Continental Shelf activity is mature, offshore, and focused on life-extension economics. |
| Procurement route | Buying often runs through operator-led offshore service tenders. |
| Local proof point | NSTA reported 425 UKCS well interventions in 2024 and 37.5 million boe of added value. |
| Application mix | Offshore wells and intervention planning shape demand more than new high-volume drilling. |
| Policy context | North Sea transition rules create pressure to lower emissions and improve well efficiency. |
| Restraint | Lower new-well activity reduces the addressable pool for wired drill pipe. |
| Company context | Companies active in or serving this market include NOV, SLB, Baker Hughes, Halliburton, and Expro. |
Market Outlook
The United Kingdom is expected to grow at a CAGR of 7.6% through 2036 as offshore operators focus on precision rather than drilling volume. Wired drill pipe demand is tied to projects that need better reservoir contact, pressure control, or faster wellbore decisions. UK demand is selective because mature fields must defend every incremental rig day. The North Sea Transition Authority reported that UKCS interventions delivered 37.5 million boe in 2024.
Key Growth Drivers
- Mature UKCS reservoirs need better placement to protect remaining production.
- Offshore rig cost supports telemetry that shortens decision cycles.
- Intervention and life-extension programs keep downhole data workflows relevant.
- UK Continental Shelf activity is mature, offshore, and focused on life-extension economics.
Key Restraints
- Limited new drilling reduces the number of wells that can justify wired pipe.
- Regulatory uncertainty can delay offshore project approvals and tender timing.
- Lower new-well activity reduces the addressable pool for wired drill pipe.
Country Market FAQs
What should C-suite teams prioritize in the United Kingdom?
C-suite teams should prioritize qualification requirements, procurement routes, local service coverage, and implementation economics before committing capital or supplier volume.
How should suppliers approach the United Kingdom market?
Suppliers should align technical evidence, local channel support, and account-specific commercial terms with the buying process used by major customers in the United Kingdom.
What can weaken the business case in the United Kingdom?
Lower new-well activity reduces the addressable pool for wired drill pipe. Executives should test this exposure during supplier, investment, and rollout reviews.
How is the Wired Drill Pipe System Market developing in Japan?
Japan is projected to record a CAGR of 7.1% through 2036. The country outlook identifies this demand signal: Japan’s geothermal resource base creates a selective non-oil demand route.
Country Market Snapshot
| Country | Japan |
|---|---|
| Forecast CAGR | 7.1% |
| Demand anchor | Japan’s geothermal resource base creates a selective non-oil demand route. |
| Local proof point | JOGMEC reports 98 geothermal power plants with about 540 MW capacity in Japan. |
| Procurement route | JOGMEC support and developer-led drilling programs shape geothermal buying. |
| Application mix | Geothermal wells need temperature tolerance and careful reservoir assessment. |
| Restraint | Hot spring stakeholder concerns can slow geothermal permits. |
| Channel signal | Japanese engineering firms and resource developers influence equipment choice. |
| Company context | Companies active in or serving this market include INPEX, JAPEX, Idemitsu Kosan, SLB, and Baker Hughes. |
Market Outlook
Japan is projected to grow at a CAGR of 7.1% through 2036 as geothermal development and overseas oilfield expertise support complex drilling tools. Domestic hydrocarbon drilling is limited, so the notable local role is geothermal resource appraisal. JOGMEC states that it supports geothermal development through geological surveys, drilling survey support, investment, and debt guarantees. That structure matters because early-stage geothermal drilling carries high resource risk. Wired pipe can support faster decisions when subsurface temperature and fracture behavior are uncertain.
Key Growth Drivers
- Geothermal resource support creates a path for drilling survey tools.
- High-temperature wells need reliable downhole electronics and telemetry.
- Japanese firms can use domestic geothermal expertise in overseas projects.
- Japan’s geothermal resource base creates a selective non-oil demand route.
Key Restraints
- Local hot spring interests can restrict drilling locations and timing.
- Domestic oil and gas demand for wired pipe is narrower than geothermal demand.
- Hot spring stakeholder concerns can slow geothermal permits.
Country Market FAQs
What should C-suite teams prioritize in Japan?
C-suite teams should prioritize qualification requirements, procurement routes, local service coverage, and implementation economics before committing capital or supplier volume.
How should suppliers approach the Japan market?
Suppliers should align technical evidence, local channel support, and account-specific commercial terms with the buying process used by major customers in Japan.
What can weaken the business case in Japan?
Hot spring stakeholder concerns can slow geothermal permits. Executives should test this exposure during supplier, investment, and rollout reviews.
Which companies are discussed in the Wired Drill Pipe System Market?
The preview discusses NOV, SLB, Baker Hughes, Halliburton, and Weatherford among the companies active in this market.
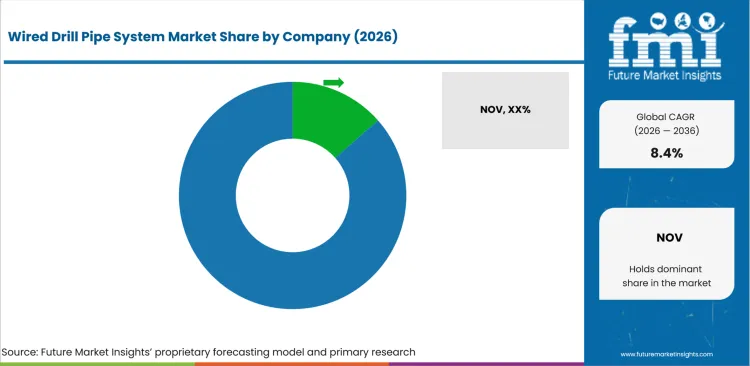
The market is concentrated around suppliers with wired pipe, downhole tools, and surface interface capability. NOV and SLB have strong positions due to IntelliServ and NeoLink exposure. Halliburton has strengthened competition through StreamStar and its downhole power approach.
Smaller players compete through compatible electronics, MWD tools, and interface support. Entry barriers include pipe fleet cost, connection reliability, field service depth, and operator qualification. Capability breadth decides supplier power in this market. NOV has direct wired drill pipe evidence through IntelliServ, which allows fast data transfer between downhole tools and surface systems.
How is competition structured?
Competition reflects differences in specialization, portfolio scope, geographic reach, evidence, and customer access.
The competitive structure is best viewed by role across wired telemetry, service integration, and rig automation.
- Wired Telemetry Leaders: NOV, SLB, and Halliburton hold the notable direct fit. NOV’s IntelliServ is a wired drill pipe system. SLB’s NeoLink supports real-time downhole wired-drillpipe control. Halliburton’s StreamStar adds high-speed data and continuous downhole power.
- Integrated Well Construction Providers: Baker Hughes and Weatherford compete around compatible downhole tools, drilling services, and managed pressure workflows. Baker Hughes references wired-pipe telemetry in TRU-ARMS offshore testing. Weatherford is relevant through MPD and real-time drilling control capabilities.
- Automation and Specialist Enablers: Nabors, APS Technology, and Drillmec support the market through rig operating systems, downhole electronics, and drilling automation interfaces. Nabors has direct automation integration evidence with SLB. APS Technology is relevant in MWD electronics.
How do selected companies compare?
The selected companies differ in portfolio focus, geographic reach, evidence depth, and channel strength.
| Company | Competitive position |
|---|---|
| NOV | NOV is assessed for drilling-system compatibility, installed-base support, field service, and upgrade capability. |
| SLB | SLB is assessed for drilling-system compatibility, installed-base support, field service, and upgrade capability. |
| Baker Hughes | Baker Hughes is assessed for drilling-system compatibility, installed-base support, field service, and upgrade capability. |
| Halliburton | Halliburton is assessed for drilling-system compatibility, installed-base support, field service, and upgrade capability. |
| Weatherford | Weatherford is assessed for drilling-system compatibility, installed-base support, field service, and upgrade capability. |
What are the key developments in the Wired Drill Pipe System Market?
- In February 2024, NOV reported orders for Delta 544 connections threaded on IntelliServ wired drill pipe for a Middle East project. The order supported deployment of wired telemetry through the drill string.
- In January 2024, SLB and Nabors announced a collaboration to scale drilling-automation solutions. The agreement improved interoperability between rig operating systems and automation applications.
- In August 2024, SLB published NeoLink real-time downhole wired-drillpipe control. The system provided a direct development signal for closed-loop drilling using wired-pipe data.
Selected Companies in the Wired Drill Pipe System Market
Companies referenced in this preview
- NOV.
- SLB.
- Baker Hughes.
- Halliburton.
- Weatherford.
- Nabors Industries.
- PetroChina.
- China Oilfield Services.
Market Scope & Definition
| Metric | Value |
|---|---|
| Market definition | The Wired Drill Pipe System Market covers drill pipe strings with embedded communication hardware, network subs, repeaters, surface interface systems, and compatible downhole tools used during drilling. These systems transmit data and commands between the bottomhole assembly and surface equipment. |
| Functions covered | Wired Drill Pipe, Network Subs / Repeaters, Surface Interface Systems, Downhole Tools / Other |
| Applications covered | Real-time MWD / LWD, Managed Pressure Drilling, Geosteering, HPHT / Complex Wells |
| End-use industries | Oil Wells, Gas Wells, Geothermal Wells |
| Inclusions | Market scope covers Wired Drill Pipe, Network Subs / Repeaters, Surface Interface Systems, and Downhole Tools / Other across oil wells, gas wells, and geothermal wells. Revenue scope covers 2026 to 2036. |
| Exclusions | Market scope excludes standard drill pipe, drill collars, casing, standalone mud-pulse telemetry, wireline logging tools, general directional drilling services without wired pipe, and rig control software that is not sold with a wired drill pipe interface. |
Research Methodology
| Metric | Value |
|---|---|
| Primary Research | FMI analysts reviewed operator buying behavior across offshore, shale, HPHT, and geothermal drilling programs. Interviews covered drilling engineers, MWD service teams, tubular rental firms, and rig automation specialists. |
| Desk Research | reviewed official drilling statistics, regulator well activity data, company product pages, investor releases, and technical references from oil and gas associations. Product scope was checked against wired telemetry systems, surface interfaces, and compatible downhole tools. |
| Market Sizing and Forecasting | The model combined drill pipe rental activity, complex well counts, service pricing, and country-level drilling intensity. Segment shares were estimated from use-case fit across MWD / LWD, MPD, geosteering, and HPHT wells. |
| Data Validation | Forecasts were checked against oilfield equipment demand, digital oilfield spending, and supplier portfolio evidence. Cross-checks used operational digital oilfield solutions and drilling automation adoption patterns. |
What does the report cover?
The report covers component, application, well type, end use, sales model, and region across the 2026-2036 forecast period in 30+ countries.
| Metric | Value |
|---|---|
| Periods | Base year 2025; estimated year 2026; forecast period 2026-2036 |
| Segment axes | component, application, well type, end use, sales model, and region |
| Regions | North America, Latin America, Europe, East Asia, South Asia and Pacific, Middle East and Africa |
| Countries | United States, United Kingdom, Germany, France, Japan, China, South Korea, India and 30+ countries |
| Companies | NOV, SLB, Baker Hughes, Halliburton, Weatherford, Nabors Industries, PetroChina, China Oilfield Services, and others |
| Approach | Hybrid bottom-up and top-down methodology using complex well activity, service pricing, component scope, and adoption rates across drilling workflows. |
Market Segmentation Analysis
Segmented by Component
- Wired Drill Pipe.
- Network Subs / Repeaters.
- Surface Interface Systems.
- Downhole Tools / Other.
Segmented by Application
- Real-time MWD / LWD.
- Managed Pressure Drilling.
- Geosteering.
- HPHT / Complex Wells.
Segmented by Well Type
- Horizontal Wells.
- Directional Wells.
- Deepwater / Offshore.
- HPHT Wells.
Segmented by End Use
- Oil Wells.
- Gas Wells.
- Geothermal Wells.
Segmented by Sales Model
- Rental / Service.
- Direct Sale.
By Region
- North America.
- United States.
- Canada.
- Mexico.
- Latin America.
- Brazil.
- Chile.
- Rest of Latin America.
- Western Europe.
- Germany.
- UK.
- Italy.
- Spain.
- France.
- Nordic.
- BENELUX.
- Rest of Western Europe.
- Eastern Europe.
- Russia.
- Poland.
- Hungary.
- Balkan & Baltic.
- Rest of Eastern Europe.
- East Asia.
- China.
- Japan.
- South Korea.
- South Asia and Pacific.
- India.
- ASEAN.
- Australia & New Zealand.
- Rest of South Asia and Pacific.
- Middle East & Africa.
- Kingdom of Saudi Arabia.
- Other GCC Countries.
- Turkiye.
- South Africa.
- Other African Union.
- Rest of Middle East & Africa.
Research Sources and Bibliography
- U.S. Energy Information Administration. (2024, June). Drilling Productivity Report. U.S. Energy Information Administration. https://www.eia.gov/petroleum/drilling/
- U.S. Energy Information Administration. (2026, April 8). Annual Energy Outlook 2026. U.S. Energy Information Administration. https://www.eia.gov/outlooks/aeo/
- North Sea Transition Authority. (2025, October 28). Wells Insights Report 2025. North Sea Transition Authority. https://www.nstauthority.co.uk/news-publications/wells-insights-report-2025/
- Department for Energy Security and Net Zero. (2026, April 28). North Sea Transition Authority oil and gas authority review 2025. GOV.UK.
- D-EITI. (2025). Deep Geothermal Energy. German Extractive Industries Transparency Initiative. https://d-eiti.de/en/report/tiefe-geothermie/
- Japan Organization for Metals and Energy Security. (2025). Geothermal: JOGMEC’s Activities. Japan Organization for Metals and Energy Security.
- National Bureau of Statistics of China. (2026, January 20). Energy Production in December 2025. National Bureau of Statistics of China.
- Ministry of Petroleum and Natural Gas. (2025, January 7). Year End Review 2024. Press Information Bureau. https://www.pib.gov.in/PressReleasePage.aspx? PRID=2090844
- Korea National Oil Corporation. (2026, March 31). Investor Relations. Korea National Oil Corporation. https://www.knoc.co.kr/ENG/sub04/sub0423.jsp
- NOV Inc. (2024, February 2). NOV Reports Fourth Quarter and Full Year 2023 Earnings. NOV Investor Relations.
- SLB. (2024, January 30). SLB and Equinor Drill Most Autonomous Well Section To-Date. SLB Investor Center.
- Nabors Industries. (2024, January 11). SLB and Nabors Announce Collaboration to Scale Adoption of Drilling Automation Solutions. Nabors Industries.
- SLB. (2024, April 19). SLB Announces First-Quarter 2024 Results. SLB Investor Center.
- SLB. (2024, August 23). NeoLink Real-Time Downhole Wired Drillpipe Control. SLB.
- SLB. (2024, August 30). NeoLink Real-Time Downhole Wired-Drillpipe Control. SLB.
- Baker Hughes. (2024). TRU-ARMS Advanced Reservoir Mapping Services. Baker Hughes.
The bibliography is provided for reader reference, and all sources are primary non-commercial government, regulatory, academic, official trade body, or official company publications.
This Report Answers
- What is the projected value of the Wired Drill Pipe System Market in 2026?
- What value is forecast for the Wired Drill Pipe System Market by 2036?
- What CAGR is forecast for the Wired Drill Pipe System Market from 2026 to 2036?
- What 2026 share is projected for Wired Drill Pipe within the component category?
- What 2026 share is projected for Real-time MWD / LWD within the application category?
- Which demand factors support the Wired Drill Pipe System Market outlook?
- Which restraints and opportunities affect adoption in the Wired Drill Pipe System Market?
- How are country CAGR outlooks, including China at 9.1%, compared?
- Which companies and product developments are covered in the competitive analysis?
- What is included in the market scope, and how is the forecast validated?
Frequently Asked Questions
Why should executives track the Wired Drill Pipe System Market?
Executives should track this market because it can affect capital allocation, supplier strategy, operating risk, and competitive positioning across commercial planning cycles.
What business problem does the Wired Drill Pipe System Market address?
It helps executive teams judge where customer pain, supplier capability, compliance exposure, and implementation economics justify investment, procurement, or portfolio action.
What should procurement leaders evaluate before selecting suppliers?
Procurement leaders should assess evidence quality, integration fit, service coverage, compliance readiness, total cost of ownership, and supplier execution capability.
What can limit return on investment for buyers?
Return on investment can be limited by low utilization, integration delays, training gaps, unclear ownership, pricing pressure, or weak fit with existing workflows.
How can suppliers build executive confidence?
Suppliers can build confidence by proving implementation speed, risk reduction, support depth, reference use cases, and measurable outcomes for budget owners.
Preview the report firsthand - request a free sample
Get SampleGet the brochure for pricing and purchase details.
Get PDFTable of Content
- Key Takeaways
- Market Size and CAGR
- Top Growth Driver
- Fastest Growing Segment
- Leading Region
- Key Companies
- Emerging Opportunities
- Executive Summary
- Global Market Outlook
- Demand-side Trends
- Supply-side Trends
- Technology Roadmap Analysis
- Analysis and Recommendations
- Analyst Perspective (What is happening? Why now? What should investors know?)
- Key Questions Answered
- How large is the market?
- What is the CAGR?
- What are key trends?
- Which region dominates?
- Who are the leaders?
- Market Overview
- Market Coverage / Taxonomy
- Market Definition / Scope / Limitations
- Research Methodology
- Chapter Orientation
- Analytical Lens and Working Hypotheses
- Market Structure, Signals, and Trend Drivers
- Benchmarking and Cross-market Comparability
- Market Sizing, Forecasting, and Opportunity Mapping
- Research Design and Evidence Framework
- Desk Research Programme (Secondary Evidence)
- Expert Input and Fieldwork (Primary Evidence)
- Tooling, Models, and Reference Databases
- Data Engineering and Model Build
- Quality Assurance and Audit Trail
- Market Background
- Market Dynamics (Drivers, Restraints, Opportunity, Trends)
- Scenario Forecast (Optimistic, Likely, Conservative)
- Impact Analysis
- AI Impact
- Sustainability Impact
- Regulatory Impact
- Technology Impact
- Consumer / Buyer Analysis
- Purchase Drivers
- Adoption Barriers
- Buyer Journey
- Opportunity Map Analysis
- Product Life Cycle Analysis
- Supply Chain Analysis
- Investment Feasibility Matrix
- Value Chain Analysis
- PESTLE and Porter's Analysis
- Regulatory Landscape
- Regional Parent Market Outlook
- Production and Consumption Statistics
- Import and Export Statistics
- Global Market Analysis and Forecast, 2021 to 2036
- Historical Market Size Value (USD Million) & Volume (Unit) Analysis, 2021 to 2025
- Current and Future Market Size Value (USD Million) & Volume (Unit) Projections, 2026 to 2036
- Y-o-Y Growth Trend Analysis
- Absolute $ Opportunity Analysis
- Global Market Pricing Analysis, 2021 to 2036
- Global Market Analysis and Forecast, By Component, 2021 to 2036
- Introduction / Key Findings
- Historical Market Size Value (USD Million) & Volume (Unit) Analysis By Component, 2021 to 2025
- Current and Future Market Size Value (USD Million) & Volume (Unit) Analysis and Forecast By Component, 2026 to 2036
- Wired Drill Pipe
- Network Subs - Repeaters
- Surface Interface Systems
- Downhole Tools - Other
- Wired Drill Pipe
- Y-o-Y Growth Trend Analysis By Component, 2021 to 2025
- Absolute $ Opportunity Analysis By Component, 2026 to 2036
- Global Market Analysis and Forecast, By Application, 2021 to 2036
- Introduction / Key Findings
- Historical Market Size Value (USD Million) & Volume (Unit) Analysis By Application, 2021 to 2025
- Current and Future Market Size Value (USD Million) & Volume (Unit) Analysis and Forecast By Application, 2026 to 2036
- Real-time MWD - LWD
- Managed Pressure Drilling
- Geosteering
- HPHT - Complex Wells
- Real-time MWD - LWD
- Y-o-Y Growth Trend Analysis By Application, 2021 to 2025
- Absolute $ Opportunity Analysis By Application, 2026 to 2036
- Global Market Analysis and Forecast, By Well Type, 2021 to 2036
- Introduction / Key Findings
- Historical Market Size Value (USD Million) & Volume (Unit) Analysis By Well Type, 2021 to 2025
- Current and Future Market Size Value (USD Million) & Volume (Unit) Analysis and Forecast By Well Type, 2026 to 2036
- Horizontal Wells
- Directional Wells
- Deepwater - Offshore
- HPHT Wells
- Horizontal Wells
- Y-o-Y Growth Trend Analysis By Well Type, 2021 to 2025
- Absolute $ Opportunity Analysis By Well Type, 2026 to 2036
- Global Market Analysis and Forecast, By End Use, 2021 to 2036
- Introduction / Key Findings
- Historical Market Size Value (USD Million) & Volume (Unit) Analysis By End Use, 2021 to 2025
- Current and Future Market Size Value (USD Million) & Volume (Unit) Analysis and Forecast By End Use, 2026 to 2036
- Oil Wells
- Gas Wells
- Geothermal Wells
- Oil Wells
- Y-o-Y Growth Trend Analysis By End Use, 2021 to 2025
- Absolute $ Opportunity Analysis By End Use, 2026 to 2036
- Global Market Analysis and Forecast, By Sales Model, 2021 to 2036
- Introduction / Key Findings
- Historical Market Size Value (USD Million) & Volume (Unit) Analysis By Sales Model, 2021 to 2025
- Current and Future Market Size Value (USD Million) & Volume (Unit) Analysis and Forecast By Sales Model, 2026 to 2036
- Rental - Service
- Direct Sale
- Rental - Service
- Y-o-Y Growth Trend Analysis By Sales Model, 2021 to 2025
- Absolute $ Opportunity Analysis By Sales Model, 2026 to 2036
- Global Market Analysis and Forecast, By Region, 2021 to 2036
- Introduction
- Historical Market Size Value (USD Million) & Volume (Unit) Analysis By Region, 2021 to 2025
- Current Market Size Value (USD Million) & Volume (Unit) Analysis and Forecast By Region, 2026 to 2036
- North America
- Latin America
- Western Europe
- Eastern Europe
- East Asia
- South Asia and Pacific
- Middle East & Africa
- Market Attractiveness Analysis By Region
- North America Market Analysis and Forecast, By Country, 2021 to 2036
- Historical Market Size Value (USD Million) & Volume (Unit) Trend Analysis By Market Taxonomy, 2021 to 2025
- Market Size Value (USD Million) & Volume (Unit) Forecast By Market Taxonomy, 2026 to 2036
- By Country
- USA
- Canada
- Mexico
- By Component
- By Application
- By Well Type
- By End Use
- By Sales Model
- By Country
- Market Attractiveness Analysis
- By Country
- By Component
- By Application
- By Well Type
- By End Use
- By Sales Model
- Key Takeaways
- Latin America Market Analysis and Forecast, By Country
- Historical Market Size Value (USD Million) & Volume (Unit) Trend Analysis By Market Taxonomy, 2021 to 2025
- Market Size Value (USD Million) & Volume (Unit) Forecast By Market Taxonomy, 2026 to 2036
- By Country
- Brazil
- Chile
- Rest of Latin America
- By Component
- By Application
- By Well Type
- By End Use
- By Sales Model
- By Country
- Market Attractiveness Analysis
- By Country
- By Component
- By Application
- By Well Type
- By End Use
- By Sales Model
- Key Takeaways
- Western Europe Market Analysis and Forecast, By Country
- Historical Market Size Value (USD Million) & Volume (Unit) Trend Analysis By Market Taxonomy, 2021 to 2025
- Market Size Value (USD Million) & Volume (Unit) Forecast By Market Taxonomy, 2026 to 2036
- By Country
- Germany
- UK
- Italy
- Spain
- France
- Nordic
- BENELUX
- Rest of Western Europe
- By Component
- By Application
- By Well Type
- By End Use
- By Sales Model
- By Country
- Market Attractiveness Analysis
- By Country
- By Component
- By Application
- By Well Type
- By End Use
- By Sales Model
- Key Takeaways
- Eastern Europe Market Analysis and Forecast, By Country
- Historical Market Size Value (USD Million) & Volume (Unit) Trend Analysis By Market Taxonomy, 2021 to 2025
- Market Size Value (USD Million) & Volume (Unit) Forecast By Market Taxonomy, 2026 to 2036
- By Country
- Russia
- Poland
- Hungary
- Balkan & Baltic
- Rest of Eastern Europe
- By Component
- By Application
- By Well Type
- By End Use
- By Sales Model
- By Country
- Market Attractiveness Analysis
- By Country
- By Component
- By Application
- By Well Type
- By End Use
- By Sales Model
- Key Takeaways
- East Asia Market Analysis and Forecast, By Country
- Historical Market Size Value (USD Million) & Volume (Unit) Trend Analysis By Market Taxonomy, 2021 to 2025
- Market Size Value (USD Million) & Volume (Unit) Forecast By Market Taxonomy, 2026 to 2036
- By Country
- China
- Japan
- South Korea
- By Component
- By Application
- By Well Type
- By End Use
- By Sales Model
- By Country
- Market Attractiveness Analysis
- By Country
- By Component
- By Application
- By Well Type
- By End Use
- By Sales Model
- Key Takeaways
- South Asia and Pacific Market Analysis and Forecast, By Country
- Historical Market Size Value (USD Million) & Volume (Unit) Trend Analysis By Market Taxonomy, 2021 to 2025
- Market Size Value (USD Million) & Volume (Unit) Forecast By Market Taxonomy, 2026 to 2036
- By Country
- India
- ASEAN
- Australia & New Zealand
- Rest of South Asia and Pacific
- By Component
- By Application
- By Well Type
- By End Use
- By Sales Model
- By Country
- Market Attractiveness Analysis
- By Country
- By Component
- By Application
- By Well Type
- By End Use
- By Sales Model
- Key Takeaways
- Middle East & Africa Market Analysis and Forecast, By Country
- Historical Market Size Value (USD Million) & Volume (Unit) Trend Analysis By Market Taxonomy, 2021 to 2025
- Market Size Value (USD Million) & Volume (Unit) Forecast By Market Taxonomy, 2026 to 2036
- By Country
- Kingdom of Saudi Arabia
- Other GCC Countries
- Türkiye
- South Africa
- Other African Union
- Rest of Middle East & Africa
- By Component
- By Application
- By Well Type
- By End Use
- By Sales Model
- By Country
- Market Attractiveness Analysis
- By Country
- By Component
- By Application
- By Well Type
- By End Use
- By Sales Model
- Key Takeaways
- Key Countries Market Analysis
- USA
- Pricing Analysis
- Market Share Analysis, 2025
- By Component
- By Application
- By Well Type
- By End Use
- By Sales Model
- Canada
- Pricing Analysis
- Market Share Analysis, 2025
- By Component
- By Application
- By Well Type
- By End Use
- By Sales Model
- Mexico
- Pricing Analysis
- Market Share Analysis, 2025
- By Component
- By Application
- By Well Type
- By End Use
- By Sales Model
- Brazil
- Pricing Analysis
- Market Share Analysis, 2025
- By Component
- By Application
- By Well Type
- By End Use
- By Sales Model
- Chile
- Pricing Analysis
- Market Share Analysis, 2025
- By Component
- By Application
- By Well Type
- By End Use
- By Sales Model
- Germany
- Pricing Analysis
- Market Share Analysis, 2025
- By Component
- By Application
- By Well Type
- By End Use
- By Sales Model
- UK
- Pricing Analysis
- Market Share Analysis, 2025
- By Component
- By Application
- By Well Type
- By End Use
- By Sales Model
- Italy
- Pricing Analysis
- Market Share Analysis, 2025
- By Component
- By Application
- By Well Type
- By End Use
- By Sales Model
- Spain
- Pricing Analysis
- Market Share Analysis, 2025
- By Component
- By Application
- By Well Type
- By End Use
- By Sales Model
- France
- Pricing Analysis
- Market Share Analysis, 2025
- By Component
- By Application
- By Well Type
- By End Use
- By Sales Model
- India
- Pricing Analysis
- Market Share Analysis, 2025
- By Component
- By Application
- By Well Type
- By End Use
- By Sales Model
- ASEAN
- Pricing Analysis
- Market Share Analysis, 2025
- By Component
- By Application
- By Well Type
- By End Use
- By Sales Model
- Australia & New Zealand
- Pricing Analysis
- Market Share Analysis, 2025
- By Component
- By Application
- By Well Type
- By End Use
- By Sales Model
- China
- Pricing Analysis
- Market Share Analysis, 2025
- By Component
- By Application
- By Well Type
- By End Use
- By Sales Model
- Japan
- Pricing Analysis
- Market Share Analysis, 2025
- By Component
- By Application
- By Well Type
- By End Use
- By Sales Model
- South Korea
- Pricing Analysis
- Market Share Analysis, 2025
- By Component
- By Application
- By Well Type
- By End Use
- By Sales Model
- Russia
- Pricing Analysis
- Market Share Analysis, 2025
- By Component
- By Application
- By Well Type
- By End Use
- By Sales Model
- Poland
- Pricing Analysis
- Market Share Analysis, 2025
- By Component
- By Application
- By Well Type
- By End Use
- By Sales Model
- Hungary
- Pricing Analysis
- Market Share Analysis, 2025
- By Component
- By Application
- By Well Type
- By End Use
- By Sales Model
- Kingdom of Saudi Arabia
- Pricing Analysis
- Market Share Analysis, 2025
- By Component
- By Application
- By Well Type
- By End Use
- By Sales Model
- Türkiye
- Pricing Analysis
- Market Share Analysis, 2025
- By Component
- By Application
- By Well Type
- By End Use
- By Sales Model
- South Africa
- Pricing Analysis
- Market Share Analysis, 2025
- By Component
- By Application
- By Well Type
- By End Use
- By Sales Model
- USA
- Market Structure Analysis
- Competition Dashboard
- Competition Benchmarking
- Market Share Analysis of Top Players
- By Regional
- By Component
- By Application
- By Well Type
- By End Use
- By Sales Model
- Emerging Startups
- Innovation Benchmarking
- Competition Analysis
- Competition Deep Dive
- NOV
- Overview
- Product Portfolio
- Profitability by Market Segments (Product/Region/Sales Channel)
- Sales Footprint
- Strategy Overview
- Marketing Strategy
- Product Strategy
- Channel Strategy
- SLB
- Baker Hughes
- Halliburton
- Weatherford
- Nabors Industries
- PetroChina
- China Oilfield Services
- NOV
- Case Studies
- Success Stories
- Recent Developments
- Competition Deep Dive
- Assumptions & Acronyms Used


